Chapter 21. Setting up metrics and dashboards for Streams for Apache Kafka
Collecting metrics is critical for understanding the health and performance of your Kafka deployment. By monitoring metrics, you can actively identify issues before they become critical and make informed decisions about resource allocation and capacity planning. Without metrics, you may be left with limited visibility into the behavior of your Kafka deployment, which can make troubleshooting more difficult and time-consuming. Setting up metrics can save you time and resources in the long run, and help ensure the reliability of your Kafka deployment.
Metrics are available for each component in Streams for Apache Kafka, providing valuable insights into their individual performance. While other components require configuration to expose metrics metric exposure, Streams for Apache Kafka operators automatically expose Prometheus metrics by default. These metrics include:
- Reconciliation count
- Custom Resource count being processed
- Reconciliation duration
- JVM metrics
You can also collect metrics specific to oauth authentication and opa or keycloak authorization by enabling the enableMetrics property in the listener or authorization configuration of the Kafka resource. Similarly, you can enable metrics for oauth authentication in custom resources such as KafkaBridge, KafkaConnect, KafkaMirrorMaker, and KafkaMirrorMaker2.
The Streams for Apache Kafka Console provides a user interface for monitoring metrics in a Kafka cluster. By connecting a Kafka cluster managed by Streams for Apache Kafka to the Streams for Apache Kafka Console, you can access detailed information on components such as brokers, topics, partitions, and consumer groups.
The Streams for Apache Kafka Console is currently available as a technology preview.
You can also use Prometheus and Grafana to monitor Streams for Apache Kafka. Prometheus consumes metrics from the running pods in your cluster when configured with Prometheus rules. Grafana visualizes these metrics on dashboards, providing an intuitive interface for monitoring.
To facilitate metrics integration, Streams for Apache Kafka provides example Prometheus rules and Grafana dashboards for Streams for Apache Kafka components. You can customize the example Grafana dashboards to suit your specific deployment requirements. You can use rules to define conditions that trigger alerts based on specific metrics.
Depending on your monitoring requirements, you can do the following:
Additionally, you can configure your deployment to track messages end-to-end by setting up distributed tracing, or retrieve troubleshooting data using the diagnostics tool (report.sh).
Streams for Apache Kafka provides example installation files for Prometheus and Grafana, which can serve as a starting point for monitoring your Streams for Apache Kafka deployment. For further support, try engaging with the Prometheus and Grafana developer communities.
Supporting documentation for metrics and monitoring tools
For more information on the metrics and monitoring tools, refer to the supporting documentation:
- Prometheus
- Prometheus configuration
- Kafka Exporter
- Grafana Labs
- Apache Kafka Monitoring describes JMX metrics exposed by Apache Kafka
- ZooKeeper JMX describes JMX metrics exposed by Apache ZooKeeper
21.1. Monitoring consumer lag with Kafka Exporter
Kafka Exporter is an open source project to enhance monitoring of Apache Kafka brokers and clients. You can configure the Kafka resource to deploy Kafka Exporter with your Kafka cluster. Kafka Exporter extracts additional metrics data from Kafka brokers related to offsets, consumer groups, consumer lag, and topics. The metrics data is used, for example, to help identify slow consumers. Lag data is exposed as Prometheus metrics, which can then be presented in Grafana for analysis.
Kafka Exporter reads from the __consumer_offsets topic, which stores information on committed offsets for consumer groups. For Kafka Exporter to be able to work properly, consumer groups needs to be in use.
A Grafana dashboard for Kafka Exporter is one of a number of example Grafana dashboards provided by Streams for Apache Kafka.
Kafka Exporter provides only additional metrics related to consumer lag and consumer offsets. For regular Kafka metrics, you have to configure the Prometheus metrics in Kafka brokers.
Consumer lag indicates the difference in the rate of production and consumption of messages. Specifically, consumer lag for a given consumer group indicates the delay between the last message in the partition and the message being currently picked up by that consumer.
The lag reflects the position of the consumer offset in relation to the end of the partition log.
Consumer lag between the producer and consumer offset
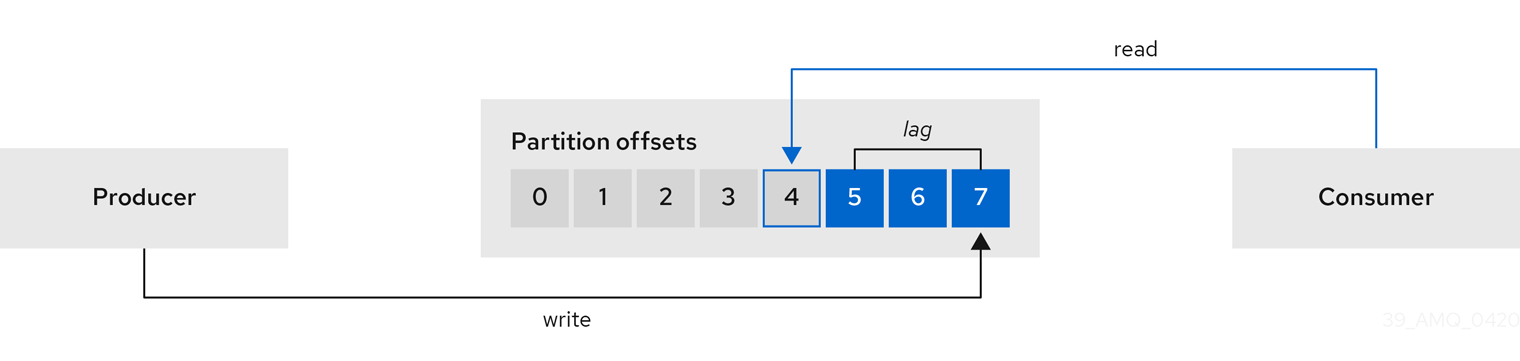
This difference is sometimes referred to as the delta between the producer offset and consumer offset: the read and write positions in the Kafka broker topic partitions.
Suppose a topic streams 100 messages a second. A lag of 1000 messages between the producer offset (the topic partition head) and the last offset the consumer has read means a 10-second delay.
The importance of monitoring consumer lag
For applications that rely on the processing of (near) real-time data, it is critical to monitor consumer lag to check that it does not become too big. The greater the lag becomes, the further the process moves from the real-time processing objective.
Consumer lag, for example, might be a result of consuming too much old data that has not been purged, or through unplanned shutdowns.
Reducing consumer lag
Use the Grafana charts to analyze lag and to check if actions to reduce lag are having an impact on an affected consumer group. If, for example, Kafka brokers are adjusted to reduce lag, the dashboard will show the Lag by consumer group chart going down and the Messages consumed per minute chart going up.
Typical actions to reduce lag include:
- Scaling-up consumer groups by adding new consumers
- Increasing the retention time for a message to remain in a topic
- Adding more disk capacity to increase the message buffer
Actions to reduce consumer lag depend on the underlying infrastructure and the use cases Streams for Apache Kafka is supporting. For instance, a lagging consumer is less likely to benefit from the broker being able to service a fetch request from its disk cache. And in certain cases, it might be acceptable to automatically drop messages until a consumer has caught up.
21.2. Monitoring Cruise Control operations
Cruise Control monitors Kafka brokers in order to track the utilization of brokers, topics, and partitions. Cruise Control also provides a set of metrics for monitoring its own performance.
The Cruise Control metrics reporter collects raw metrics data from Kafka brokers. The data is produced to topics that are automatically created by Cruise Control. The metrics are used to generate optimization proposals for Kafka clusters.
Cruise Control metrics are available for real-time monitoring of Cruise Control operations. For example, you can use Cruise Control metrics to monitor the status of rebalancing operations that are running or provide alerts on any anomalies that are detected in an operation’s performance.
You expose Cruise Control metrics by enabling the Prometheus JMX Exporter in the Cruise Control configuration.
For a full list of available Cruise Control metrics, which are known as sensors, see the Cruise Control documentation
21.2.1. Monitoring balancedness scores
Cruise Control metrics include a balancedness score. Balancedness is the measure of how evenly a workload is distributed in a Kafka cluster.
The Cruise Control metric for balancedness score (balancedness-score) might differ from the balancedness score in the KafkaRebalance resource. Cruise Control calculates each score using anomaly.detection.goals which might not be the same as the default.goals used in the KafkaRebalance resource. The anomaly.detection.goals are specified in the spec.cruiseControl.config of the Kafka custom resource.
Refreshing the KafkaRebalance resource fetches an optimization proposal. The latest cached optimization proposal is fetched if one of the following conditions applies:
-
KafkaRebalance
goalsmatch the goals configured in thedefault.goalssection of theKafkaresource -
KafkaRebalance
goalsare not specified
Otherwise, Cruise Control generates a new optimization proposal based on KafkaRebalance goals. If new proposals are generated with each refresh, this can impact performance monitoring.
21.2.2. Setting up alerts for anomaly detection
Cruise control’s anomaly detector provides metrics data for conditions that block the generation of optimization goals, such as broker failures. If you want more visibility, you can use the metrics provided by the anomaly detector to set up alerts and send out notifications. You can set up Cruise Control’s anomaly notifier to route alerts based on these metrics through a specified notification channel. Alternatively, you can set up Prometheus to scrape the metrics data provided by the anomaly detector and generate alerts. Prometheus Alertmanager can then route the alerts generated by Prometheus.
The Cruise Control documentation provides information on AnomalyDetector metrics and the anomaly notifier.
21.3. Example metrics files
You can find example Grafana dashboards and other metrics configuration files in the example configuration files provided by Streams for Apache Kafka.
Example metrics files provided with Streams for Apache Kafka
metrics
├── grafana-dashboards
│   ├── strimzi-cruise-control.json
│   ├── strimzi-kafka-bridge.json
│   ├── strimzi-kafka-connect.json
│   ├── strimzi-kafka-exporter.json
│   ├── strimzi-kafka-mirror-maker-2.json
│   ├── strimzi-kafka.json
│   ├── strimzi-operators.json
│   └── strimzi-zookeeper.json
├── grafana-install
│   └── grafana.yaml
├── prometheus-additional-properties
│   └── prometheus-additional.yaml
├── prometheus-alertmanager-config
│   └── alert-manager-config.yaml
├── prometheus-install
│    ├── alert-manager.yaml
│ ├── prometheus-rules.yaml
│ ├── prometheus.yaml
│ └── strimzi-pod-monitor.yaml
├── kafka-bridge-metrics.yaml
├── kafka-connect-metrics.yaml
├── kafka-cruise-control-metrics.yaml
├── kafka-metrics.yaml
└── kafka-mirror-maker-2-metrics.yaml - 1
- Example Grafana dashboards for the different Streams for Apache Kafka components.
- 2
- Installation file for the Grafana image.
- 3
- Additional configuration to scrape metrics for CPU, memory and disk volume usage, which comes directly from the OpenShift cAdvisor agent and kubelet on the nodes.
- 4
- Hook definitions for sending notifications through Alertmanager.
- 5
- Resources for deploying and configuring Alertmanager.
- 6
- Alerting rules examples for use with Prometheus Alertmanager (deployed with Prometheus).
- 7
- Installation resource file for the Prometheus image.
- 8
- PodMonitor definitions translated by the Prometheus Operator into jobs for the Prometheus server to be able to scrape metrics data directly from pods.
- 9
- Kafka Bridge resource with metrics enabled.
- 10
- Metrics configuration that defines Prometheus JMX Exporter relabeling rules for Kafka Connect.
- 11
- Metrics configuration that defines Prometheus JMX Exporter relabeling rules for Cruise Control.
- 12
- Metrics configuration that defines Prometheus JMX Exporter relabeling rules for Kafka and ZooKeeper.
- 13
- Metrics configuration that defines Prometheus JMX Exporter relabeling rules for Kafka MirrorMaker 2.
21.3.1. Example Prometheus metrics configuration
Streams for Apache Kafka uses the Prometheus JMX Exporter to expose metrics through an HTTP endpoint, which can be scraped by the Prometheus server.
Grafana dashboards are dependent on Prometheus JMX Exporter relabeling rules, which are defined for Streams for Apache Kafka components in the custom resource configuration.
A label is a name-value pair. Relabeling is the process of writing a label dynamically. For example, the value of a label may be derived from the name of a Kafka server and client ID.
Streams for Apache Kafka provides example custom resource configuration YAML files with relabeling rules. When deploying Prometheus metrics configuration, you can can deploy the example custom resource or copy the metrics configuration to your own custom resource definition.
| Component | Custom resource | Example YAML file |
|---|---|---|
| Kafka and ZooKeeper |
|
|
| Kafka Connect |
|
|
| Kafka MirrorMaker 2 |
|
|
| Kafka Bridge |
|
|
| Cruise Control |
|
|
21.3.2. Example Prometheus rules for alert notifications
Example Prometheus rules for alert notifications are provided with the example metrics configuration files provided by Streams for Apache Kafka. The rules are specified in the example prometheus-rules.yaml file for use in a Prometheus deployment.
The prometheus-rules.yaml file contains example rules for the following components:
- Kafka
- ZooKeeper
- Entity Operator
- Kafka Connect
- Kafka Bridge
- MirrorMaker
- Kafka Exporter
A description of each of the example rules is provided in the file.
Alerting rules provide notifications about specific conditions observed in metrics. Rules are declared on the Prometheus server, but Prometheus Alertmanager is responsible for alert notifications.
Prometheus alerting rules describe conditions using PromQL expressions that are continuously evaluated.
When an alert expression becomes true, the condition is met and the Prometheus server sends alert data to the Alertmanager. Alertmanager then sends out a notification using the communication method configured for its deployment.
General points about the alerting rule definitions:
-
A
forproperty is used with the rules to determine the period of time a condition must persist before an alert is triggered. -
A tick is a basic ZooKeeper time unit, which is measured in milliseconds and configured using the
tickTimeparameter ofKafka.spec.zookeeper.config. For example, if ZooKeepertickTime=3000, 3 ticks (3 x 3000) equals 9000 milliseconds. -
The availability of the
ZookeeperRunningOutOfSpacemetric and alert is dependent on the OpenShift configuration and storage implementation used. Storage implementations for certain platforms may not be able to supply the information on available space required for the metric to provide an alert.
Alertmanager can be configured to use email, chat messages or other notification methods. Adapt the default configuration of the example rules according to your specific needs.
21.3.3. Example Grafana dashboards
If you deploy Prometheus to provide metrics, you can use the example Grafana dashboards provided with Streams for Apache Kafka to monitor Streams for Apache Kafka components.
Example dashboards are provided in the examples/metrics/grafana-dashboards directory as JSON files.
All dashboards provide JVM metrics, as well as metrics specific to the component. For example, the Grafana dashboard for Streams for Apache Kafka operators provides information on the number of reconciliations or custom resources they are processing.
The example dashboards don’t show all the metrics supported by Kafka. The dashboards are populated with a representative set of metrics for monitoring.
| Component | Example JSON file |
|---|---|
| Streams for Apache Kafka operators |
|
| Kafka |
|
| ZooKeeper |
|
| Kafka Connect |
|
| Kafka MirrorMaker 2 |
|
| Kafka Bridge |
|
| Cruise Control |
|
| Kafka Exporter |
|
When metrics are not available to the Kafka Exporter, because there is no traffic in the cluster yet, the Kafka Exporter Grafana dashboard will show N/A for numeric fields and No data to show for graphs.
21.4. Enabling Prometheus metrics through configuration
To enable and expose metrics in Streams for Apache Kafka for Prometheus, use metrics configuration properties.
The following components require metricsConfig configuration to expose metrics:
- Kafka
- KafkaConnect
- MirrorMaker
- Cruise Control
- ZooKeeper
This configuration enables the Prometheus JMX Exporter to expose metrics through an HTTP endpoint. The port for the JMX exporter HTTP endpoint is 9404. Prometheus scrapes this endpoint to collect Kafka metrics.
You set the enableMetrics property to true in order to expose metrics for these components:
- Kafka Bridge
- OAuth 2.0 authentication and authorization framework
- Open Policy Agent (OPA) for authorization
To deploy Prometheus metrics configuration in Streams for Apache Kafka, you can use your own configuration or the example custom resource configuration files provided with Streams for Apache Kafka:
-
kafka-metrics.yaml -
kafka-connect-metrics.yaml -
kafka-mirror-maker-2-metrics.yaml -
kafka-bridge-metrics.yaml -
kafka-cruise-control-metrics.yaml -
oauth-metrics.yaml
These files contain the necessary relabeling rules and configuration to enable Prometheus metrics. They are a good starting point for trying Prometheus with Streams for Apache Kafka.
This procedure shows how to deploy example Prometheus metrics configuration in the Kafka resource. The process is the same when deploying the example files for other resources.
If you wish to include Kafka Exporter metrics, add kafkaExporter configuration to your Kafka resource.
Kafka Exporter only provides additional metrics related to consumer lag and consumer offsets. For regular Kafka metrics, you must configure the Prometheus metrics in Kafka brokers.
Procedure
Deploy the example custom resource with the Prometheus configuration.
For example, for each
Kafkaresource you can apply thekafka-metrics.yamlfile.Deploying the example configuration
oc apply -f kafka-metrics.yamlAlternatively, you can copy the example configuration in
kafka-metrics.yamlto your ownKafkaresource.Copying the example configuration
oc edit kafka <kafka_configuration_file>Copy the
metricsConfigproperty and theConfigMapit references to yourKafkaresource.Example metrics configuration for Kafka
apiVersion: kafka.strimzi.io/v1beta2
kind: Kafka
metadata:
  name: my-cluster
spec:
  kafka:
    # ...
    metricsConfig:
1 type: jmxPrometheusExporter valueFrom: configMapKeyRef: name: kafka-metrics key: kafka-metrics-config.yml --- kind: ConfigMap2 apiVersion: v1 metadata: name: kafka-metrics labels: app: strimzi data: kafka-metrics-config.yml: | # metrics configuration...To deploy Kafka Exporter, add
kafkaExporterconfiguration.kafkaExporterconfiguration is only specified in theKafkaresource.Example configuration for deploying Kafka Exporter
apiVersion: kafka.strimzi.io/v1beta2
kind: Kafka
metadata:
  name: my-cluster
spec:
  # ...
  kafkaExporter:
    image: my-registry.io/my-org/my-exporter-cluster:latest
1 groupRegex: ".*"2 topicRegex: ".*"3 groupExcludeRegex: "^excluded-.*"4 topicExcludeRegex: "^excluded-.*"5 resources:6 requests: cpu: 200m memory: 64Mi limits: cpu: 500m memory: 128Mi logging: debug7 enableSaramaLogging: true8 template:9 pod: metadata: labels: label1: value1 imagePullSecrets: - name: my-docker-credentials securityContext: runAsUser: 1000001 fsGroup: 0 terminationGracePeriodSeconds: 120 readinessProbe:10 initialDelaySeconds: 15 timeoutSeconds: 5 livenessProbe:11 initialDelaySeconds: 15 timeoutSeconds: 5 # ...- 1
- ADVANCED OPTION: Container image configuration, which is recommended only in special situations.
- 2
- A regular expression to specify the consumer groups to include in the metrics.
- 3
- A regular expression to specify the topics to include in the metrics.
- 4
- A regular expression to specify the consumer groups to exclude in the metrics.
- 5
- A regular expression to specify the topics to exclude in the metrics.
- 6
- CPU and memory resources to reserve.
- 7
- Logging configuration, to log messages with a given severity (debug, info, warn, error, fatal) or above.
- 8
- Boolean to enable Sarama logging, a Go client library used by Kafka Exporter.
- 9
- Customization of deployment templates and pods.
- 10
- Healthcheck readiness probes.
- 11
- Healthcheck liveness probes.
For Kafka Exporter to be able to work properly, consumer groups need to be in use.
Enabling metrics for Kafka Bridge
To expose metrics for Kafka Bridge, set the enableMetrics property to true in the KafkaBridge resource.
Example metrics configuration for Kafka Bridge
apiVersion: kafka.strimzi.io/v1beta2
kind: KafkaBridge
metadata:
  name: my-bridge
spec:
  # ...
  bootstrapServers: my-cluster-kafka:9092
  http:
    # ...
  enableMetrics: true
  # ...
Enabling metrics for OAuth 2.0 and OPA
To expose metrics for OAuth 2.0 or OPA, set the enableMetrics property to true in the appropriate custom resource.
- OAuth 2.0 metrics
Enable metrics for Kafka cluster authorization and Kafka listener authentication in the
Kafkaresource.You can also enable metrics for OAuth 2.0 authentication in the custom resource of other supported components.
- OPA metrics
-
Enable metrics for Kafka cluster authorization the
Kafkaresource in the same way as for OAuth 2.0.
In the following example, metrics are enabled for OAuth 2.0 listener authentication and OAuth 2.0 (keycloak) cluster authorization.
Example cluster configuration with metrics enabled for OAuth 2.0
apiVersion: kafka.strimzi.io/v1beta2
kind: Kafka
metadata:
  name: my-cluster
  namespace: myproject
spec:
  kafka:
    # ...
    listeners:
    - name: external3
      port: 9094
      type: loadbalancer
      tls: true
      authentication:
        type: oauth
        enableMetrics: true
      configuration:
        #...
    authorization:
      type: keycloak
      enableMetrics: true
  # ...
To use the OAuth 2.0 metrics with Prometheus, you can use the oauth-metrics.yaml file to deploy example Prometheus metrics configuration. Copy the ConfigMap configuration the oauth-metrics.yaml file contains to the same Kafka resource configuration file where you enabled metrics for OAuth 2.0.
21.5. Viewing Kafka metrics and dashboards in OpenShift
When Streams for Apache Kafka is deployed to OpenShift Container Platform, metrics are provided through monitoring for user-defined projects. This OpenShift feature gives developers access to a separate Prometheus instance for monitoring their own projects (for example, a Kafka project).
If monitoring for user-defined projects is enabled, the openshift-user-workload-monitoring project contains the following components:
- A Prometheus operator
- A Prometheus instance (automatically deployed by the Prometheus Operator)
- A Thanos Ruler instance
Streams for Apache Kafka uses these components to consume metrics.
A cluster administrator must enable monitoring for user-defined projects and then grant developers and other users permission to monitor applications within their own projects.
Grafana deployment
You can deploy a Grafana instance to the project containing your Kafka cluster. The example Grafana dashboards can then be used to visualize Prometheus metrics for Streams for Apache Kafka in the Grafana user interface.
The openshift-monitoring project provides monitoring for core platform components. Do not use the Prometheus and Grafana components in this project to configure monitoring for Streams for Apache Kafka on OpenShift Container Platform 4.x.
Procedure outline
To set up Streams for Apache Kafka monitoring in OpenShift Container Platform, follow these procedures in order:
21.5.1. Prerequisites
- You have deployed the Prometheus metrics configuration using the example YAML files.
-
Monitoring for user-defined projects is enabled. A cluster administrator has created a
cluster-monitoring-configconfig map in your OpenShift cluster. -
A cluster administrator has assigned you a
monitoring-rules-editormonitoring-editrole.
For more information on creating a cluster-monitoring-config config map and granting users permission to monitor user-defined projects, see the OpenShift documentation.
21.5.2. Deploying the Prometheus resources
Use Prometheus to obtain monitoring data in your Kafka cluster.
You can use your own Prometheus deployment or deploy Prometheus using the example metrics configuration files provided by Streams for Apache Kafka. To use the example files, you configure and deploy the PodMonitor resources. The PodMonitors scrape data directly from pods for Apache Kafka, ZooKeeper, Operators, the Kafka Bridge, and Cruise Control.
You then deploy the example alerting rules for Alertmanager.
Prerequisites
- A running Kafka cluster.
- Check the example alerting rules provided with Streams for Apache Kafka.
Procedure
Check that monitoring for user-defined projects is enabled:
oc get pods -n openshift-user-workload-monitoringIf enabled, pods for the monitoring components are returned. For example:
NAME                                   READY   STATUS    RESTARTS   AGE
prometheus-operator-5cc59f9bc6-kgcq8   1/1     Running   0          25s
prometheus-user-workload-0             5/5     Running   1          14s
prometheus-user-workload-1             5/5     Running   1          14s
thanos-ruler-user-workload-0           3/3     Running   0          14s
thanos-ruler-user-workload-1           3/3     Running   0          14s
If no pods are returned, monitoring for user-defined projects is disabled. See the Prerequisites in Section 21.5, “Viewing Kafka metrics and dashboards in OpenShift”.
Multiple
PodMonitorresources are defined inexamples/metrics/prometheus-install/strimzi-pod-monitor.yaml.For each
PodMonitorresource, edit thespec.namespaceSelector.matchNamesproperty:apiVersion: monitoring.coreos.com/v1 kind: PodMonitor metadata: name: cluster-operator-metrics labels: app: strimzi spec: selector: matchLabels: strimzi.io/kind: cluster-operator namespaceSelector: matchNames: - <project-name>1 podMetricsEndpoints: - path: /metrics port: http # ...- 1
- The project where the pods to scrape the metrics from are running, for example,
Kafka.
Deploy the
strimzi-pod-monitor.yamlfile to the project where your Kafka cluster is running:oc apply -f strimzi-pod-monitor.yaml -n MY-PROJECTDeploy the example Prometheus rules to the same project:
oc apply -f prometheus-rules.yaml -n MY-PROJECT
21.5.3. Creating a service account for Grafana
A Grafana instance for Streams for Apache Kafka needs to run with a service account that is assigned the cluster-monitoring-view role.
Create a service account if you are using Grafana to present metrics for monitoring.
Prerequisites
Procedure
Create a
ServiceAccountfor Grafana in the project containing your Kafka cluster:oc create sa grafana-service-account -n my-projectIn this example, a service account named
grafana-service-accountis created in themy-projectnamespace.Create a
ClusterRoleBindingresource that assigns thecluster-monitoring-viewrole to the GrafanaServiceAccount. Here the resource is namedgrafana-cluster-monitoring-binding.apiVersion: rbac.authorization.k8s.io/v1 kind: ClusterRoleBinding metadata: name: grafana-cluster-monitoring-binding labels: app: strimzi subjects: - kind: ServiceAccount name: grafana-service-account namespace: my-project roleRef: kind: ClusterRole name: cluster-monitoring-view apiGroup: rbac.authorization.k8s.ioDeploy the
ClusterRoleBindingto the same project:oc apply -f grafana-cluster-monitoring-binding.yaml -n my-projectCreate a token secret for the service account:
apiVersion: v1
kind: Secret
metadata:
  name: secret-sa
  annotations:
    kubernetes.io/service-account.name: "grafana-service-account"
1 type: kubernetes.io/service-account-token2 Create the
Secretobject and access token:oc create -f <secret_configuration>.yamlYou need the access token when deploying Grafana.
21.5.4. Deploying Grafana with a Prometheus datasource
Deploy Grafana to present Prometheus metrics. A Grafana application requires configuration for the OpenShift Container Platform monitoring stack.
OpenShift Container Platform includes a Thanos Querier instance in the openshift-monitoring project. Thanos Querier is used to aggregate platform metrics.
To consume the required platform metrics, your Grafana instance requires a Prometheus data source that can connect to Thanos Querier. To configure this connection, you create a config map that authenticates, by using a token, to the oauth-proxy sidecar that runs alongside Thanos Querier. A datasource.yaml file is used as the source of the config map.
Finally, you deploy the Grafana application with the config map mounted as a volume to the project containing your Kafka cluster.
Prerequisites
Procedure
Get the access token of the Grafana
ServiceAccount:oc describe sa/grafana-service-account | grep Tokens: oc describe secret grafana-service-account-token-mmlp9 | grep token:In this example, the service account is named
grafana-service-account. Copy the access token to use in the next step.Create a
datasource.yamlfile containing the Thanos Querier configuration for Grafana.Paste the access token into the
httpHeaderValue1property as indicated.apiVersion: 1 datasources: - name: Prometheus type: prometheus url: https://thanos-querier.openshift-monitoring.svc.cluster.local:9091 access: proxy basicAuth: false withCredentials: false isDefault: true jsonData: timeInterval: 5s tlsSkipVerify: true httpHeaderName1: "Authorization" secureJsonData: httpHeaderValue1: "Bearer ${GRAFANA-ACCESS-TOKEN}"1 editable: true- 1
GRAFANA-ACCESS-TOKEN: The value of the access token for the GrafanaServiceAccount.
Create a config map named
grafana-configfrom thedatasource.yamlfile:oc create configmap grafana-config --from-file=datasource.yaml -n MY-PROJECTCreate a Grafana application consisting of a
Deploymentand aService.The
grafana-configconfig map is mounted as a volume for the datasource configuration.apiVersion: apps/v1 kind: Deployment metadata: name: grafana labels: app: strimzi spec: replicas: 1 selector: matchLabels: name: grafana template: metadata: labels: name: grafana spec: serviceAccountName: grafana-service-account containers: - name: grafana image: grafana/grafana:10.4.2 ports: - name: grafana containerPort: 3000 protocol: TCP volumeMounts: - name: grafana-data mountPath: /var/lib/grafana - name: grafana-logs mountPath: /var/log/grafana - name: grafana-config mountPath: /etc/grafana/provisioning/datasources/datasource.yaml readOnly: true subPath: datasource.yaml readinessProbe: httpGet: path: /api/health port: 3000 initialDelaySeconds: 5 periodSeconds: 10 livenessProbe: httpGet: path: /api/health port: 3000 initialDelaySeconds: 15 periodSeconds: 20 volumes: - name: grafana-data emptyDir: {} - name: grafana-logs emptyDir: {} - name: grafana-config configMap: name: grafana-config --- apiVersion: v1 kind: Service metadata: name: grafana labels: app: strimzi spec: ports: - name: grafana port: 3000 targetPort: 3000 protocol: TCP selector: name: grafana type: ClusterIPDeploy the Grafana application to the project containing your Kafka cluster:
oc apply -f <grafana-application> -n <my-project>
21.5.5. Creating a route to the Grafana Service
You can access the Grafana user interface through a Route that exposes the Grafana service.
Prerequisites
Procedure
Create an edge route to the
grafanaservice:oc create route edge <my-grafana-route> --service=grafana --namespace=KAFKA-NAMESPACE
21.5.6. Importing the example Grafana dashboards
Use Grafana to provide visualizations of Prometheus metrics on customizable dashboards.
Streams for Apache Kafka provides example dashboard configuration files for Grafana in JSON format.
-
examples/metrics/grafana-dashboards
This procedure uses the example Grafana dashboards.
The example dashboards are a good starting point for monitoring key metrics, but they don’t show all the metrics supported by Kafka. You can modify the example dashboards or add other metrics, depending on your infrastructure.
Prerequisites
Procedure
Get the details of the Route to the Grafana Service. For example:
oc get routes NAME HOST/PORT PATH SERVICES MY-GRAFANA-ROUTE MY-GRAFANA-ROUTE-amq-streams.net grafana- In a web browser, access the Grafana login screen using the URL for the Route host and port.
Enter your user name and password, and then click Log In.
The default Grafana user name and password are both
admin. After logging in for the first time, you can change the password.- In Configuration > Data Sources, check that the Prometheus data source was created. The data source was created in Section 21.5.4, “Deploying Grafana with a Prometheus datasource”.
- Click the + icon and then click Import.
-
In
examples/metrics/grafana-dashboards, copy the JSON of the dashboard to import. - Paste the JSON into the text box, and then click Load.
- Repeat steps 5-7 for the other example Grafana dashboards.
The imported Grafana dashboards are available to view from the Dashboards home page.