Este contenido no está disponible en el idioma seleccionado.
Chapter 5. Monitoring the cluster
The monitoring functions of the dashboard provide different web pages which update regularly to indicate various aspects of the storage cluster. You can monitor the overall state of the cluster using the landing page, or you can monitor specific functions of the cluster, like the state of block device images.
Additional Resources
- For more information, see Accessing the landing page in the Dashboard guide.
- For more information, see Understanding the landing page in the Dashboard guide.
- For more information, see Monitoring specific functions in the Dashboard guide.
5.1. Accessing the landing page
After you log in to the dashboard, the landing page loads.
Prerequisites
- A running Red Hat Ceph Storage cluster.
- Dashboard is installed.
Procedure
Log in to the Dashboard:
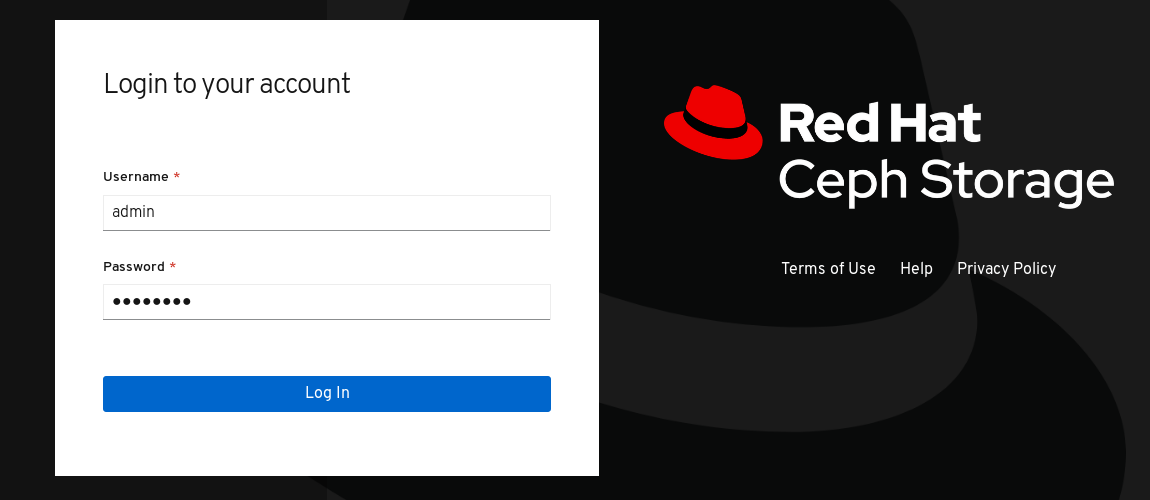
After you log in to the dashboard, the landing page loads:

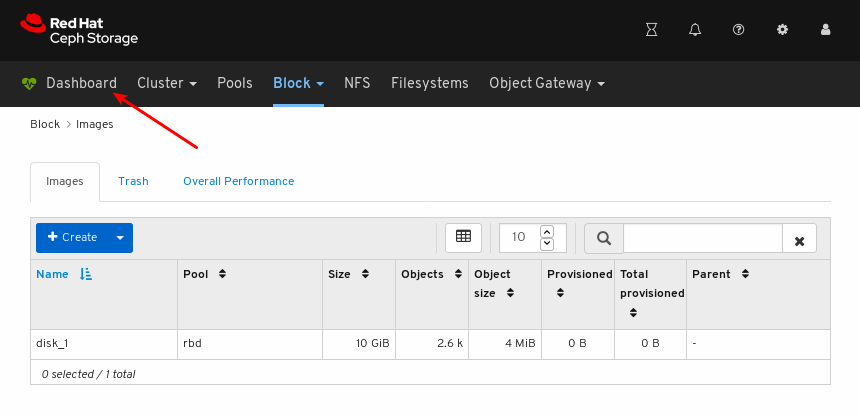
To return to the landing page after viewing other dashboard pages, click Dashboard towards the top left corner of the page:
Additional Resources
- For more information, see Understanding the landing page in the Dashboard guide.
- For more information, see Monitoring specific functions in the Dashboard guide.
5.2. Understanding the landing page
The landing page displays an overview of the entire Ceph cluster using individual panels. Each panel displays specific information about the state of the cluster.
Categories
The landing page orgnanizes panels into the following three categories:
- Status
- Capacity
- Performance
Status panels
The status panels display the health of the cluster and host and daemon states.
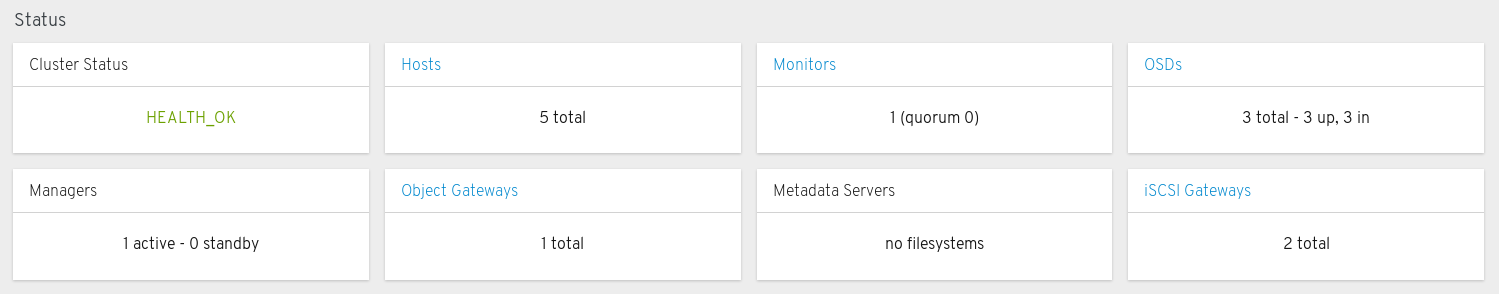
Cluster Status: Displays the current health status of the Ceph cluster.
Hosts: Displays the total number of hosts in the Ceph storage cluster.
Monitors: Displays the number of Ceph Monitors and the quorum status.
OSDs: Displays the total number of OSDs in the Ceph Storage cluster and the number that are up, and in.
Managers: Displays the number and status of the Manager Daemons.
Object Gateways: Displays the number of Object Gateways in the Ceph storage cluster.
Metadata Servers: Displays the number and status of metadata servers for Ceph Filesystems.
iSCSI Gateways: Displays the number of iSCSI Gateways in the Ceph storage cluster.
Capacity panels
The capacity panels display storage usage metrics.
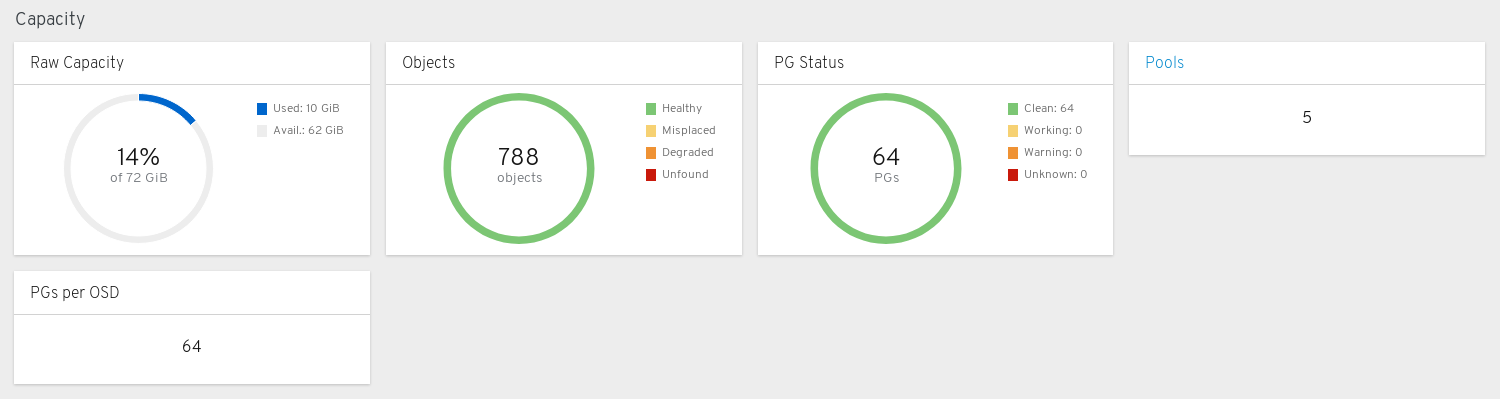
Raw Capacity: Displays the utilization and availability of the raw storage capacity of the cluster.
Objects: Displays the total number of Objects in the pools and a graph dividing objects into states of Healthy, Misplaced, Degraded, or Unfound.
PG Status: Displays the total number of Placement Groups and a graph dividing PGs into states of Clean, Working, Warning, or Unknown. To simplify display of PG states Working and Warning actually each encompass multiple states.
The Working state includes PGs with any of these states:
- activating
- backfill_wait
- backfilling
- creating
- deep
- degraded
- forced_backfill
- forced_recovery
- peering
- peered
- recovering
- recovery_wait
- repair
- scrubbing
- snaptrim
- snaptrim_wait
The Warning state includes PGs with any of these states:
- backfill_toofull
- backfill_unfound
- down
- incomplete
- inconsistent
- recovery_toofull
- recovery_unfound
- remapped
- snaptrim_error
- stale
- undersized
Pools: Displays the number of storage pools in the Ceph cluster.
PGs per OSD: Displays the number of Placement Groups per OSD.
Performance panels
The performance panels display information related to data transfer speeds.
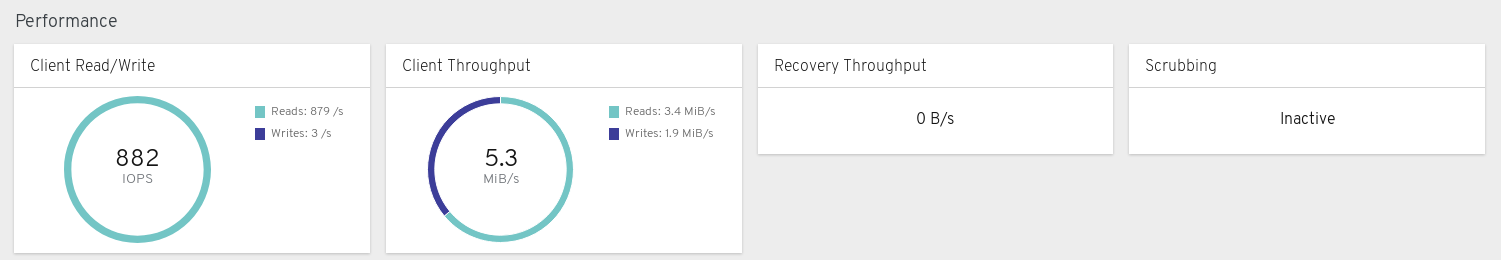
Client Read/Write: Displays total input/output opreations per second, reads per second, and writes per second.
Client Throughput: Displays total client throughput, read throughput, and write throughput.
Recovery Throughput: Displays the Client recovery rate.
Scrubbing: Displays whether Ceph is scrubbing data to verify its integrity.
Additional Resources
- For more information, see Accessing the landing page in the Dashboard guide.
- For more information, see Monitoring specific functions in the Dashboard guide.