Ce contenu n'est pas disponible dans la langue sélectionnée.
Chapter 2. Dashboard cards
The Cryostat Dashboard displays information about target Java Virtual Machines (JVMs) in the form of cards on the user interface. Each card displays a different set of information or metrics about the selected target JVM. For example, heap usage, thread statistics, or JVM vendor information.
The following dashboard cards are available:
- Target JVM Details
- Automated Analysis
- MBean Metrics Chart
Target JVM Details
The Target JVM Details card provides high-level information that relates to the selected target JVM.
Figure 2.1. Example Target JVM Details dashboard card
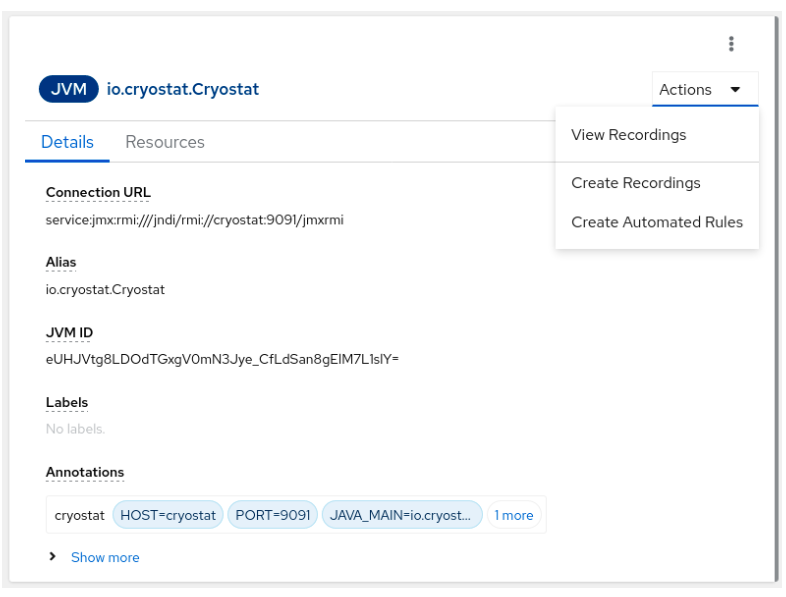
On the Details tab, you can view information such as the connection URL, labels, JVM ID, and annotations for the selected target JVM. You can also view the JVM start time, version, vendor, operating system architecture, and the number of available processors.
You can perform additional actions directly from the card. By clicking Actions, you can view recordings, start new recordings, or create automated rules for the selected target JVM.
On the Resources tab, you can view details about the resources related to the target JVM, such as the number of active recordings or the number of automated rules.
Automated Analysis
Automated analysis is a JDK Mission Control (JMC) tool with which you can diagnose issues with your target JVMs by analyzing JDK Flight Recording (JFR) data for potential errors. Cryostat integrates the JMC automated analysis reports and produces a report that shows any errors associated with the data. The Automated Analysis card provides an alternative way of displaying this report information.
Figure 2.2. Example Automated Analysis dashboard card
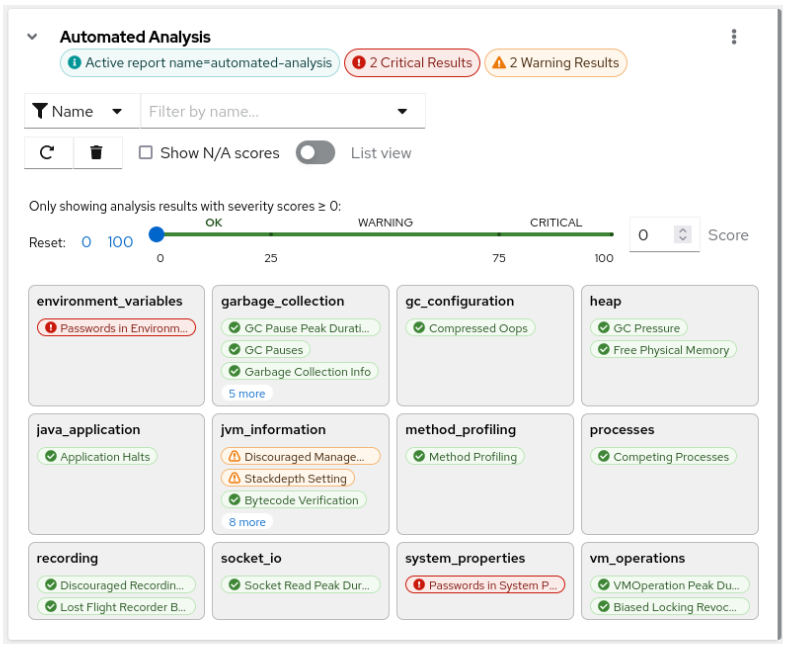
On the Automated Analysis card, you can create a JFR recording that Cryostat uses to periodically evaluate any configuration or performance issues with the selected target JVM. After you click the corresponding label for each result, the card displays the following information:
- Results of the analysis categorized according to a severity score. Severity scores range from 0, which means no error, to 100, which means a potentially critical error. You might also receive a severity score marked as N/A, which indicates that the severity score is not applicable to the recording.
- A description of the results that includes a summary, an explanation of the error, and a potential solution, if applicable.
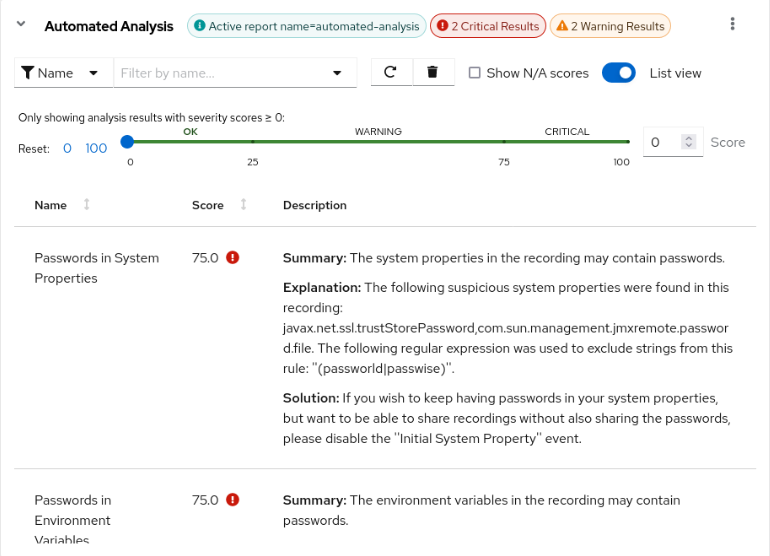
You can choose to display the card information in a list format by selecting List view.
Figure 2.3. Example Automated Analysis dashboard card displayed as a list view
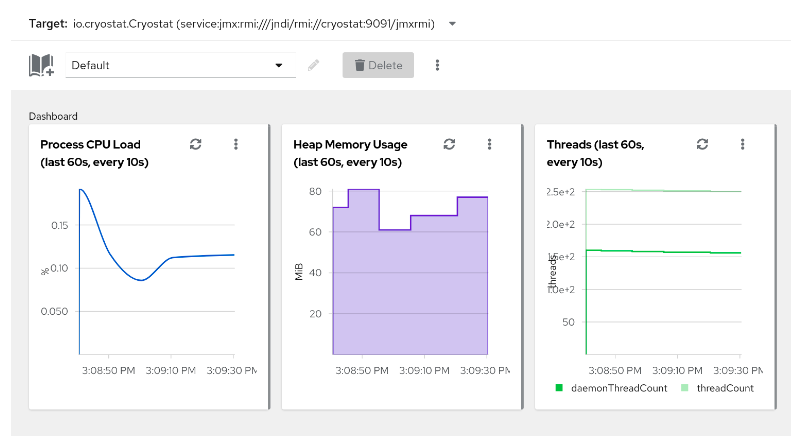
MBean Metrics Chart
The MBean Metrics Chart card displays performance metrics about the target JVM through remote access to supported MXBeans interfaces of the JVM, including Thread, Runtime, OperatingSystem, and Memory MXBeans.
Cryostat gathers a range of data from these MXBeans interfaces and displays them in the MBean Metrics Chart cards.
From the Performance Metric field, you can select the metric you want to view, for example, Process CPU Load, Physical Memory, or Heap Memory Usage, then configure the card details.
Once configured, cards showing each metric are displayed on your dashboard.
Figure 2.4. Example MBean Metrics Chart card