Ce contenu n'est pas disponible dans la langue sélectionnée.
20.5. Detailed Discussion: Event Correlation
There are a lot of moving pieces in IT infrastructure, and one change can cause a cascade of results. One factor in being able to respond to events and manage infrastructure is the ability to correlate an event with its cause.
While there is not an exact way to pinpoint what change caused what event or alert, there is a way to help visualize how unrelated JBoss ON elements — alerts, configuration changes, event logs, drift detection, or inventory changes — might be related. Each resource has a Timeline area on its Summary tab. This collects all of the major operations that have occurred on that resource, either through JBoss ON or as detected by JBoss ON.
The thing to look for is clusters. For example, in this case, there was a configuration change on the JBoss server, and shortly after there was a critical alert and a simultaneous error in the JBoss server's logs. That is a reasonable indication that the configuration change caused a performance problem.
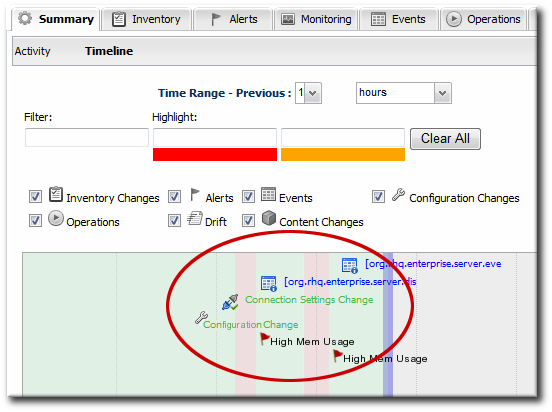
Figure 20.3. Resource Timeline Cluster