Ce contenu n'est pas disponible dans la langue sélectionnée.
Chapter 1. Introduction to Service Telemetry Framework 1.5
Service Telemetry Framework (STF) collects monitoring data from Red Hat OpenStack Platform (RHOSP) or third-party nodes. You can use STF to perform the following tasks:
- Store or archive the monitoring data for historical information.
- View the monitoring data graphically on the dashboard.
- Use the monitoring data to trigger alerts or warnings.
The monitoring data can be either metric or event:
- Metric
- A numeric measurement of an application or system.
- Event
- Irregular and discrete occurrences that happen in a system.
The components of STF use a message bus for data transport. Other modular components that receive and store data are deployed as containers on Red Hat OpenShift Container Platform.
STF is compatible with Red Hat OpenShift Container Platform Extended Update Support (EUS) release versions 4.12 and 4.14.
Additional resources
1.1. Support for Service Telemetry Framework
Red Hat supports the core Operators and workloads, including AMQ Interconnect, Cluster Observability Operator (Prometheus, Alertmanager), Service Telemetry Operator, and Smart Gateway Operator. Red Hat does not support the community Operators or workload components, inclusive of Elasticsearch, Grafana, and their Operators.
You can deploy Service Telemetry Framework (STF) in fully connected network environments or in Red Hat OpenShift Container Platform-disconnected environments. You cannot deploy STF in network proxy environments.
For more information about STF life cycle and support status, see the Service Telemetry Framework Supported Version Matrix.
1.2. Service Telemetry Framework architecture
Service Telemetry Framework (STF) uses a client-server architecture, in which Red Hat OpenStack Platform (RHOSP) is the client and Red Hat OpenShift Container Platform is the server.
By default, STF collects, transports, and stores metrics information.
You can collect RHOSP events data, transport it with the message bus, and forward it to a user-provided Elasticsearch from the Smart Gateways, but this option is deprecated.
STF consists of the following components:
Data collection
- collectd: Collects infrastructure metrics and events on RHOSP.
- Ceilometer: Collects RHOSP metrics and events on RHOSP.
Transport
- AMQ Interconnect: An AMQP 1.x compatible messaging bus that provides fast and reliable data transport to transfer the metrics from RHOSP to STF for storage or forwarding.
- Smart Gateway: A Golang application that takes metrics and events from the AMQP 1.x bus to deliver to Prometheus or an external Elasticsearch.
Data storage
- Prometheus: Time-series data storage that stores STF metrics received from the Smart Gateway.
- Alertmanager: An alerting tool that uses Prometheus alert rules to manage alerts.
User provided components
- Grafana: A visualization and analytics application that you can use to query, visualize, and explore data.
- Elasticsearch: Events data storage that stores RHOSP events received and forwarded by the Smart Gateway.
The following table describes the application of the client and server components:
| Component | Client | Server |
|---|---|---|
| An AMQP 1.x compatible messaging bus | yes | yes |
| Smart Gateway | no | yes |
| Prometheus | no | yes |
| Elasticsearch | no | yes |
| Grafana | no | yes |
| collectd | yes | no |
| Ceilometer | yes | no |
To ensure that the monitoring platform can report operational problems with your cloud, do not install STF on the same infrastructure that you are monitoring.
Figure 1.1. Service Telemetry Framework architecture overview
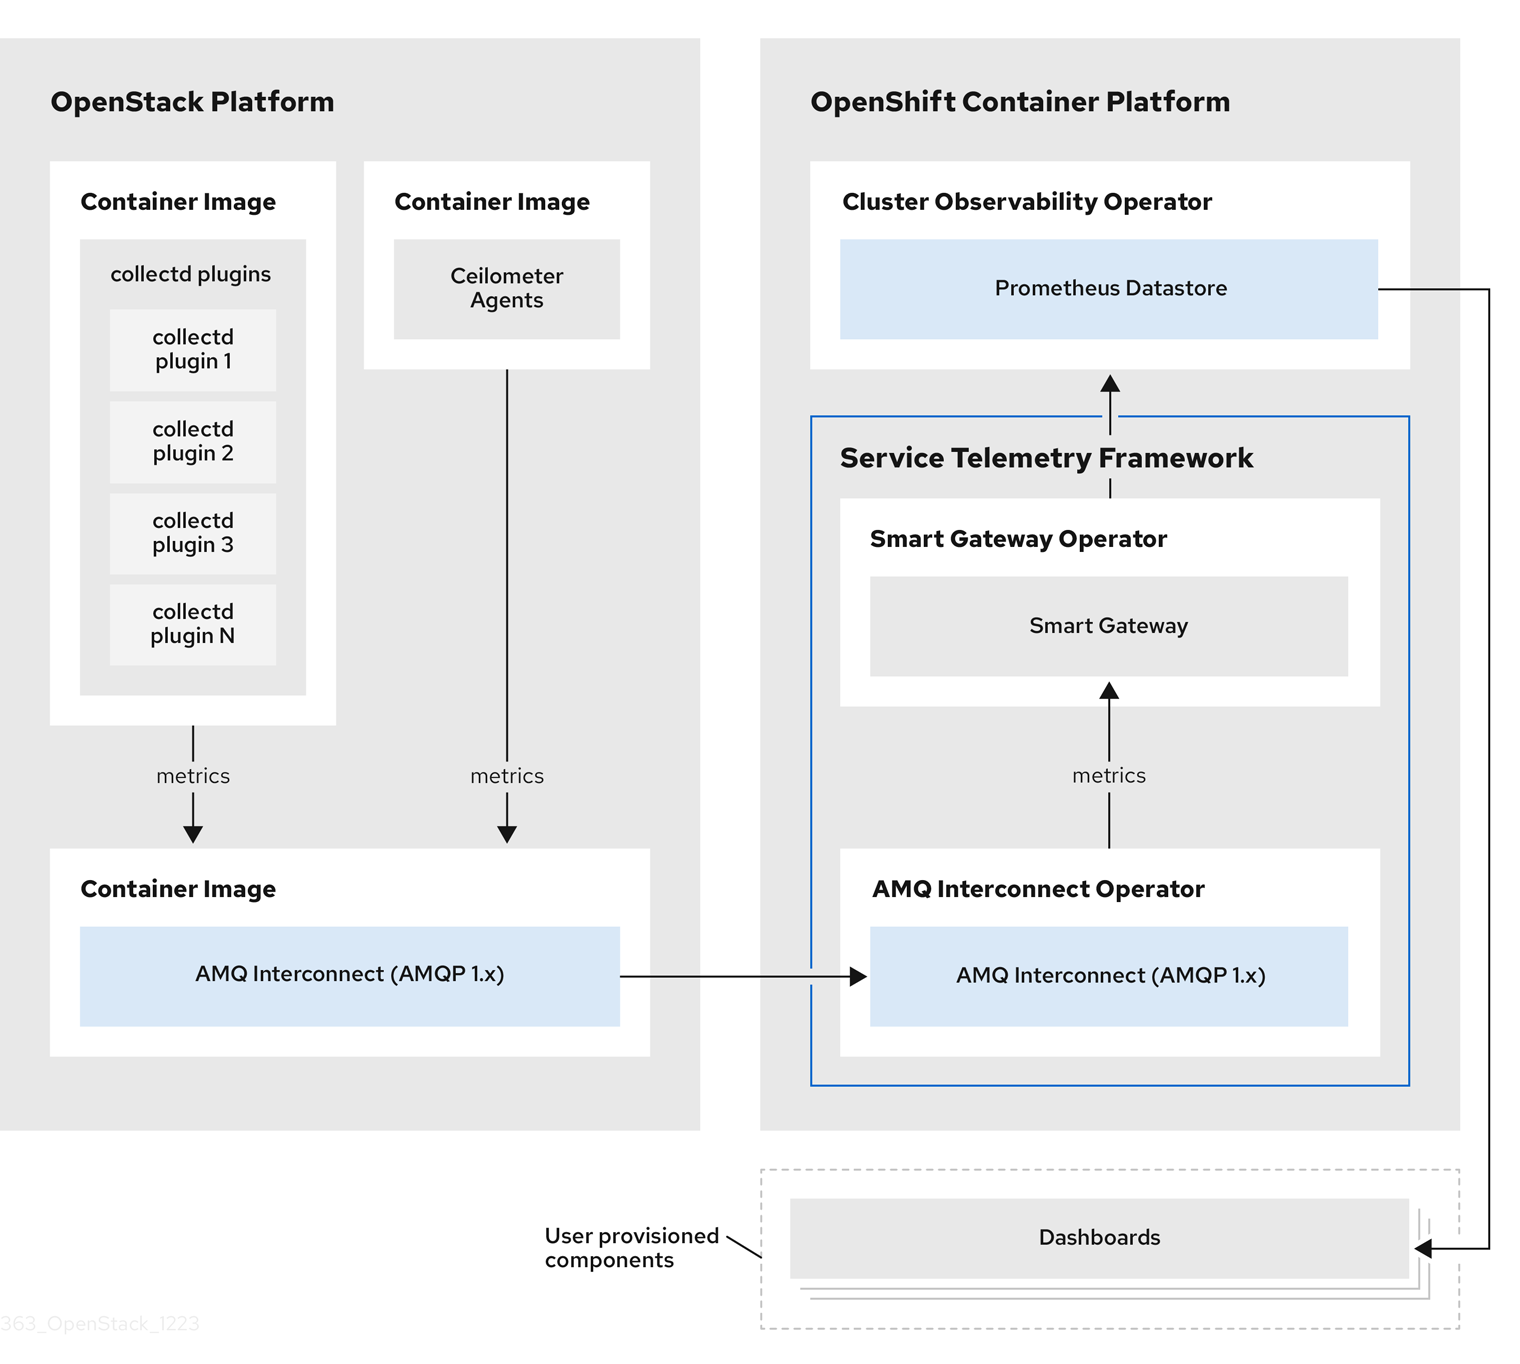
For client side metrics, collectd provides infrastructure metrics without project data, and Ceilometer provides RHOSP platform data based on projects or user workload. Both Ceilometer and collectd deliver data to Prometheus by using the AMQ Interconnect transport, delivering the data through the message bus. On the server side, a Golang application called the Smart Gateway takes the data stream from the bus and exposes it as a local scrape endpoint for Prometheus.
When you collect and store events, collectd and Ceilometer deliver event data to the server side by using the AMQ Interconnect transport. Another Smart Gateway forwards the data to a user-provided Elasticsearch datastore.
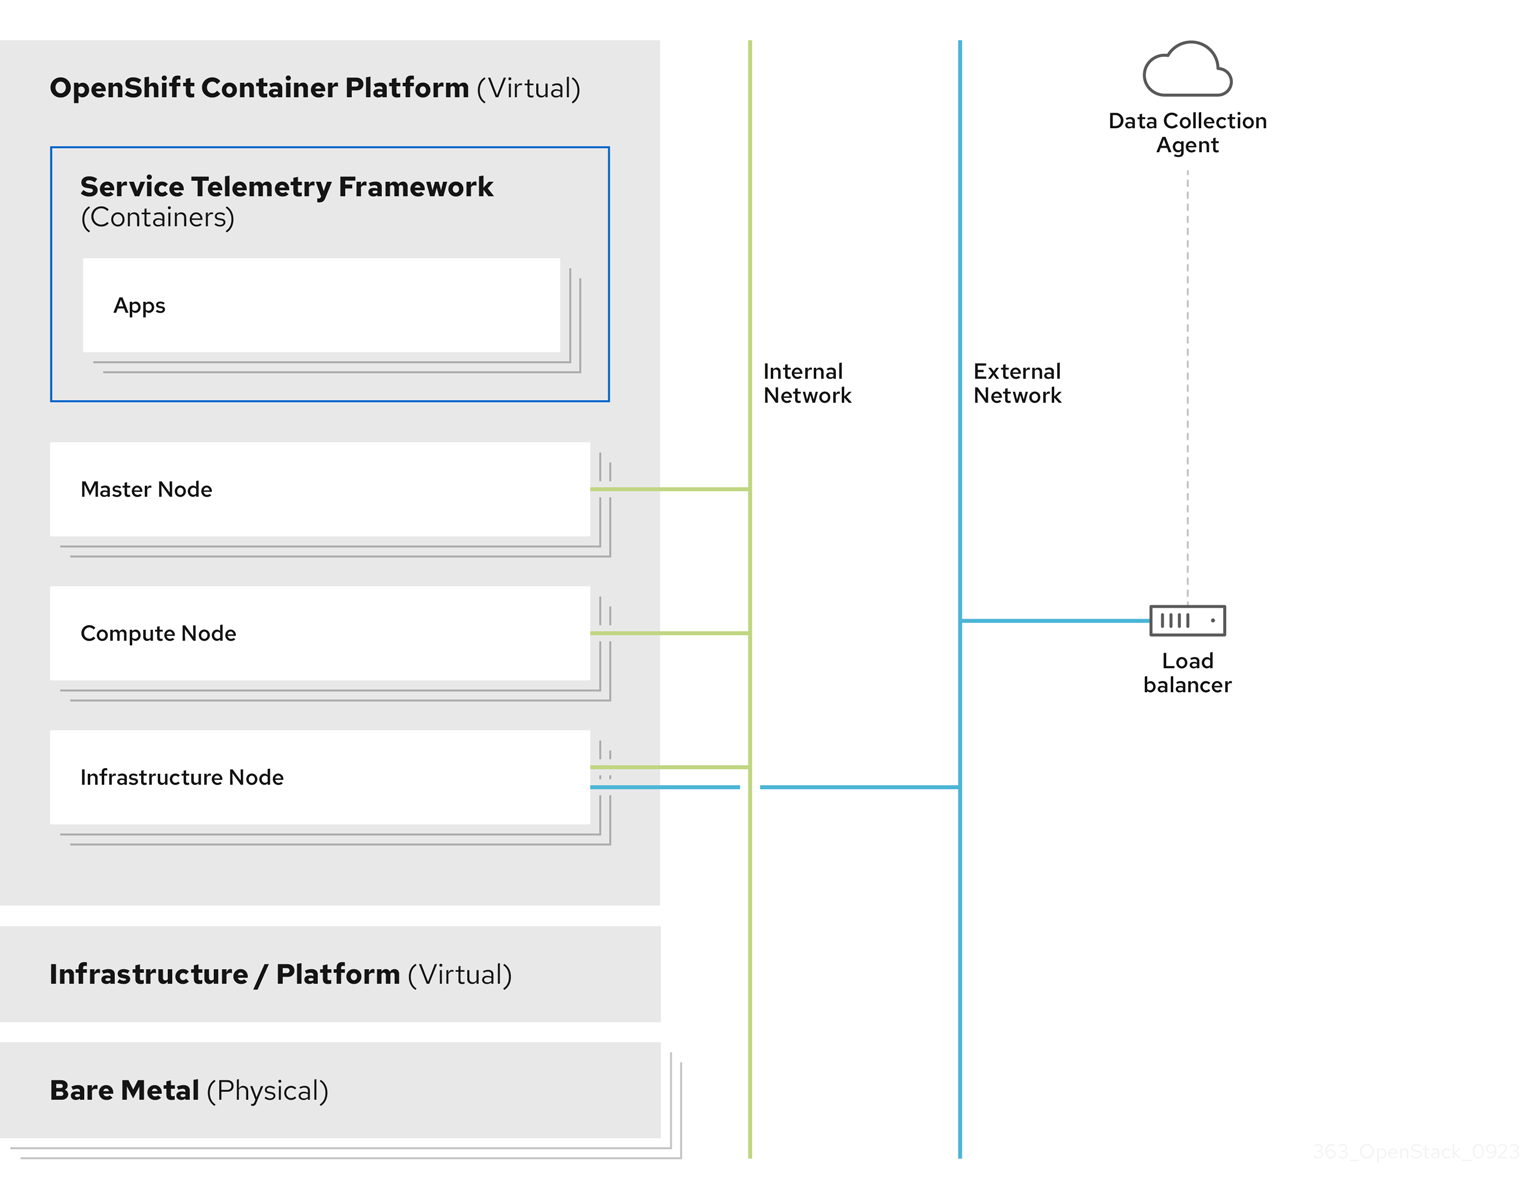
Server-side STF monitoring infrastructure consists of the following layers:
- Service Telemetry Framework 1.5
- Red Hat OpenShift Container Platform Extended Update Support (EUS) releases 4.12 and 4.14
- Infrastructure platform
For more information about the Red Hat OpenShift Container Platform EUS releases, see Red Hat OpenShift Container Platform Life Cycle Policy.
Figure 1.2. Server-side STF monitoring infrastructure
1.2.1. STF Architecture Changes
In releases of STF prior to 1.5.3, the Service Telemetry Operator requested instances of Elasticsearch from the Elastic Cloud on Kubernetes (ECK) Operator. STF now uses a forwarding model, where events are forwarded from a Smart Gateway instance to a user-provided instance of Elasticsearch.
The management of an Elasticsearch instances by Service Telemetry Operator is deprecated.
In new ServiceTelemetry deployments, the observabilityStrategy parameter has a value of use_redhat, that does not request Elasticsearch instances from ECK. Deployments of ServiceTelemetry with STF version 1.5.2 or older and were updated to 1.5.3 will have the observabilityStrategy parameter set to use_community, which matches the previous architecture.
If a user previously deployed an Elasticsearch instance with STF, the Service Telemetry Operator updates the ServiceTelemetry custom resource object to have the observabilityStrategy parameter set to use_community, and functions similar to previous releases. For more information about observability strategies, see Section 2.1, “Observability Strategy in Service Telemetry Framework”.
It is recommended that users of STF migrate to the use_redhat observability strategy. For more information about migration to the use_redhat observability strategy, see the Red Hat Knowledge Base article Migrating Service Telemetry Framework to fully supported operators.
1.3. Installation size of Red Hat OpenShift Container Platform
The size of your Red Hat OpenShift Container Platform installation depends on the following factors:
- The infrastructure that you select.
- The number of nodes that you want to monitor.
- The number of metrics that you want to collect.
- The resolution of metrics.
- The length of time that you want to store the data.
Installation of Service Telemetry Framework (STF) depends on an existing Red Hat OpenShift Container Platform environment.
For more information about minimum resources requirements when you install Red Hat OpenShift Container Platform on baremetal, see Minimum resource requirements in the Installing a cluster on bare metal guide. For installation requirements of the various public and private cloud platforms that you can install, see the corresponding installation documentation for your cloud platform of choice.