Ce contenu n'est pas disponible dans la langue sélectionnée.
Chapter 9. Using the Service Interconnect Console
The Service Interconnect Console provides data and visualizations of the traffic flow between Skupper sites.
9.1. Enabling the Service Interconnect Console
By default, when you create a Skupper site, a Service Interconnect Console is not available.
When enabled, the Service Interconnect Console URL is displayed whenever you check site status using skupper status.
Prerequisites
- A Kubernetes namespace where you plan to create a site
Procedure
Determine which site in your service network is best to enable the console.
Enabling the console also requires that you enable the flow-collector component, which requires resources to process traffic data from all sites. You might locate the console using the following criteria:
- Does the service network cross a firewall? For example, if you want the console to be available only inside the firewall, you need to locate the flow-collector and console on a site inside the firewall.
- Is there a site that processes more traffic than other sites? For example, if you have a frontend component that calls a set of services from other sites, it might make sense to locate the flow collector and console on that site to minimize data traffic.
- Is there a site with more or cheaper resources that you want to use? For example, if you have two sites, A and B, and resources are more expensive on site A, you might want to locate the flow collector and console on site B.
Create a site with the flow collector and console enabled:
skupper init --enable-console --enable-flow-collector
$ skupper init --enable-console --enable-flow-collectorCopy to Clipboard Copied! Toggle word wrap Toggle overflow
9.2. Accessing the Service Interconnect Console
By default, the Service Interconnect Console is protected by credentials available in the skupper-console-users secret.
Procedure
Determine the Service Interconnect Console URL using the
skupperCLI, for example:skupper status Skupper is enabled for namespace "west" in interior mode. It is not connected to any other sites. It has no exposed services. The site console url is: https://skupper-west.apps-crc.testing
$ skupper status

Skupper is enabled for namespace "west" in interior mode. It is not connected to any other sites. It has no exposed services.
The site console url is:  https://skupper-west.apps-crc.testing
Copy to Clipboard Copied! Toggle word wrap Toggle overflow Browse to the Service Interconnect Console URL. The credential prompt depends on how the site was created using
skupper init:-
Using the
--console-auth unsecuredoption, you are not prompted for credentials. -
Using the
--console-auth openshiftoption, you are prompted to enter OpenShift cluster credentials. -
Using the default or
--console-user <user> --console-password <password>options, you are prompted to enter those credentials.
-
Using the
If you created the site using default settings, that is
skupper init, a random password is generated for theadminuser.To retrieve the password the
adminuser for a Kubernetes site:+
kubectl get secret skupper-console-users -o jsonpath={.data.admin} | base64 -d

JNZWzMHtyg
$ kubectl get secret skupper-console-users -o jsonpath={.data.admin} | base64 -d JNZWzMHtygCopy to Clipboard Copied! Toggle word wrap Toggle overflow To retrieve the password the
adminuser for a Podman site:+
cat ~/.local/share/containers/storage/volumes/skupper-console-users/_data/admin

JNZWzMHtyg
$ cat ~/.local/share/containers/storage/volumes/skupper-console-users/_data/admin

JNZWzMHtyg
Copy to Clipboard Copied! Toggle word wrap Toggle overflow
9.3. Exploring the Service Interconnect Console
After exposing a service on the service network, you create an address, that is, a service name and port number associated with a site. There might be many replicas associated with an address. These replicas are shown in the Service Interconnect Console as processes. Not all participants on a service network are services. For example, a frontend deployment might call an exposed service named backend, but that frontend is not part of the service network. In the console, both are shown so that you can view the traffic and these are called components.
The Service Interconnect Console provides an overview of the following:
- Topology
- Addresses
- Sites
- Components
- Processes
The Service Interconnect Console also provides useful networking information about the service network, for example, traffic levels.
- Check the Sites tab. All your sites should be listed. See the Topology tab to view how the sites are linked.
- Check that all the services you exposed are visible in the Components tab.
- Click a component to show the component details and associated processes.
Click on a process to display the process traffic.
NoteThe process detail displays the associated image, host, and addresses. You can also view the clients that are calling the process.
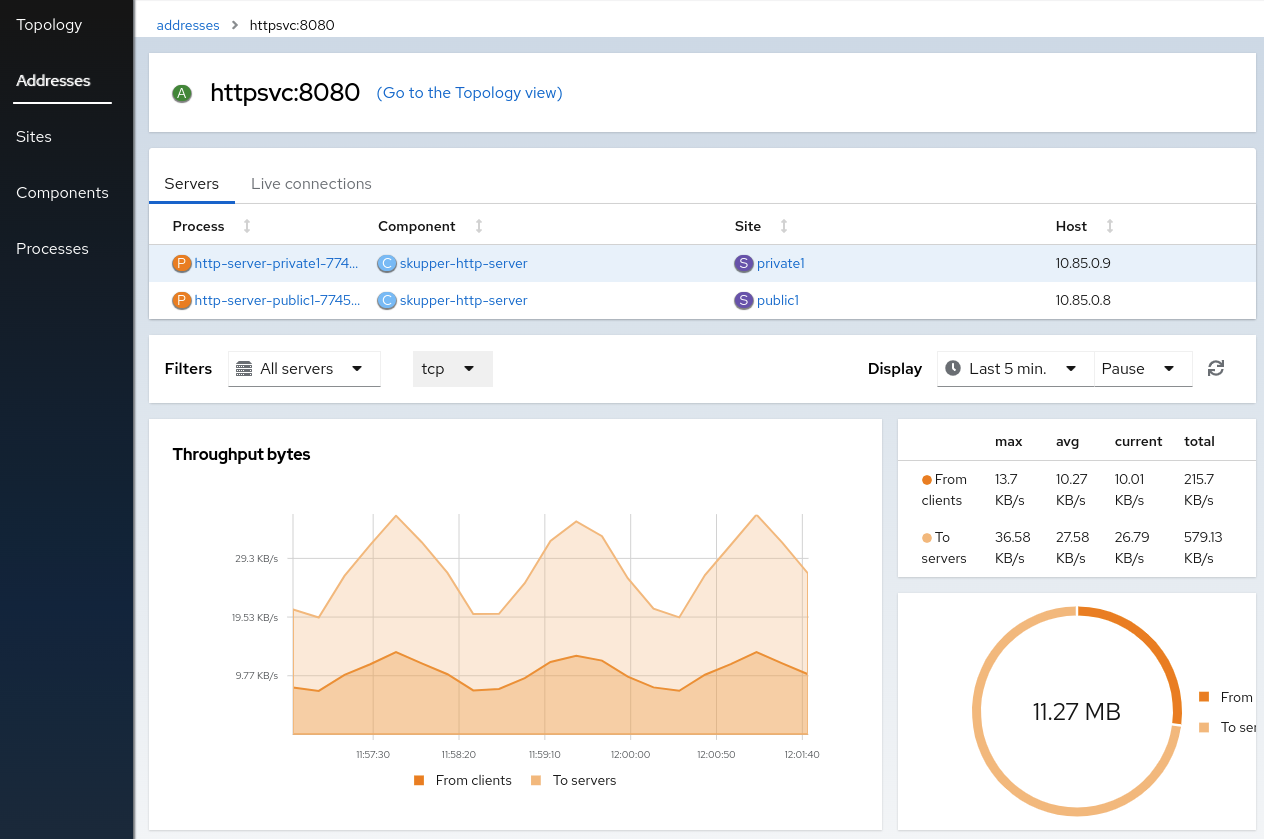
- Click Addresses and choose an address to show the details for that address. This shows the set of servers that are exposed across the service network.
To view information about each window, click the ? icon.