Questo contenuto non è disponibile nella lingua selezionata.
Chapter 8. Reviewing monitoring dashboards
OpenShift Dedicated provides a set of monitoring dashboards that help you understand the state of cluster components and user-defined workloads.
8.1. Monitoring dashboards in the Administrator perspective
Use the Administrator perspective to access dashboards for the core OpenShift Dedicated components, including the following items:
- API performance
- etcd
- Kubernetes compute resources
- Kubernetes network resources
- Prometheus
- USE method dashboards relating to cluster and node performance
- Node performance metrics
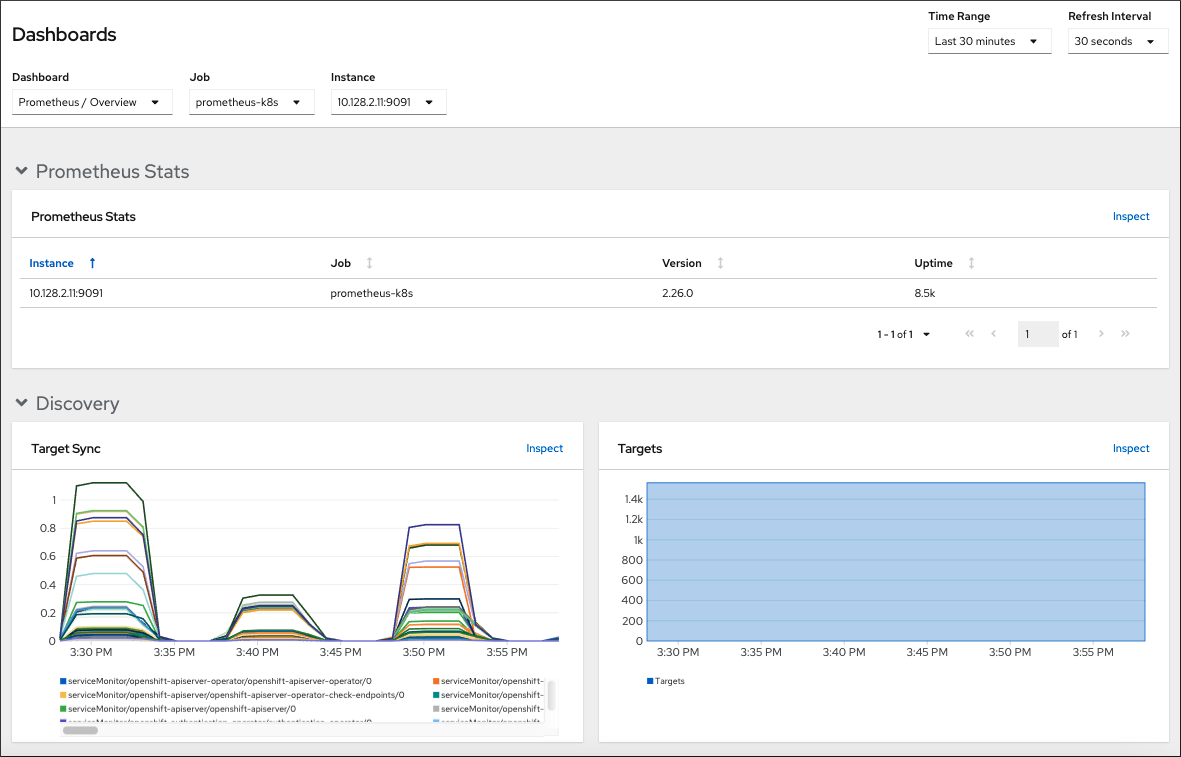
Figure 8.1. Example dashboard in the Administrator perspective
8.2. Monitoring dashboards in the Developer perspective
In the Developer perspective, you can access only the Kubernetes compute resources dashboards:
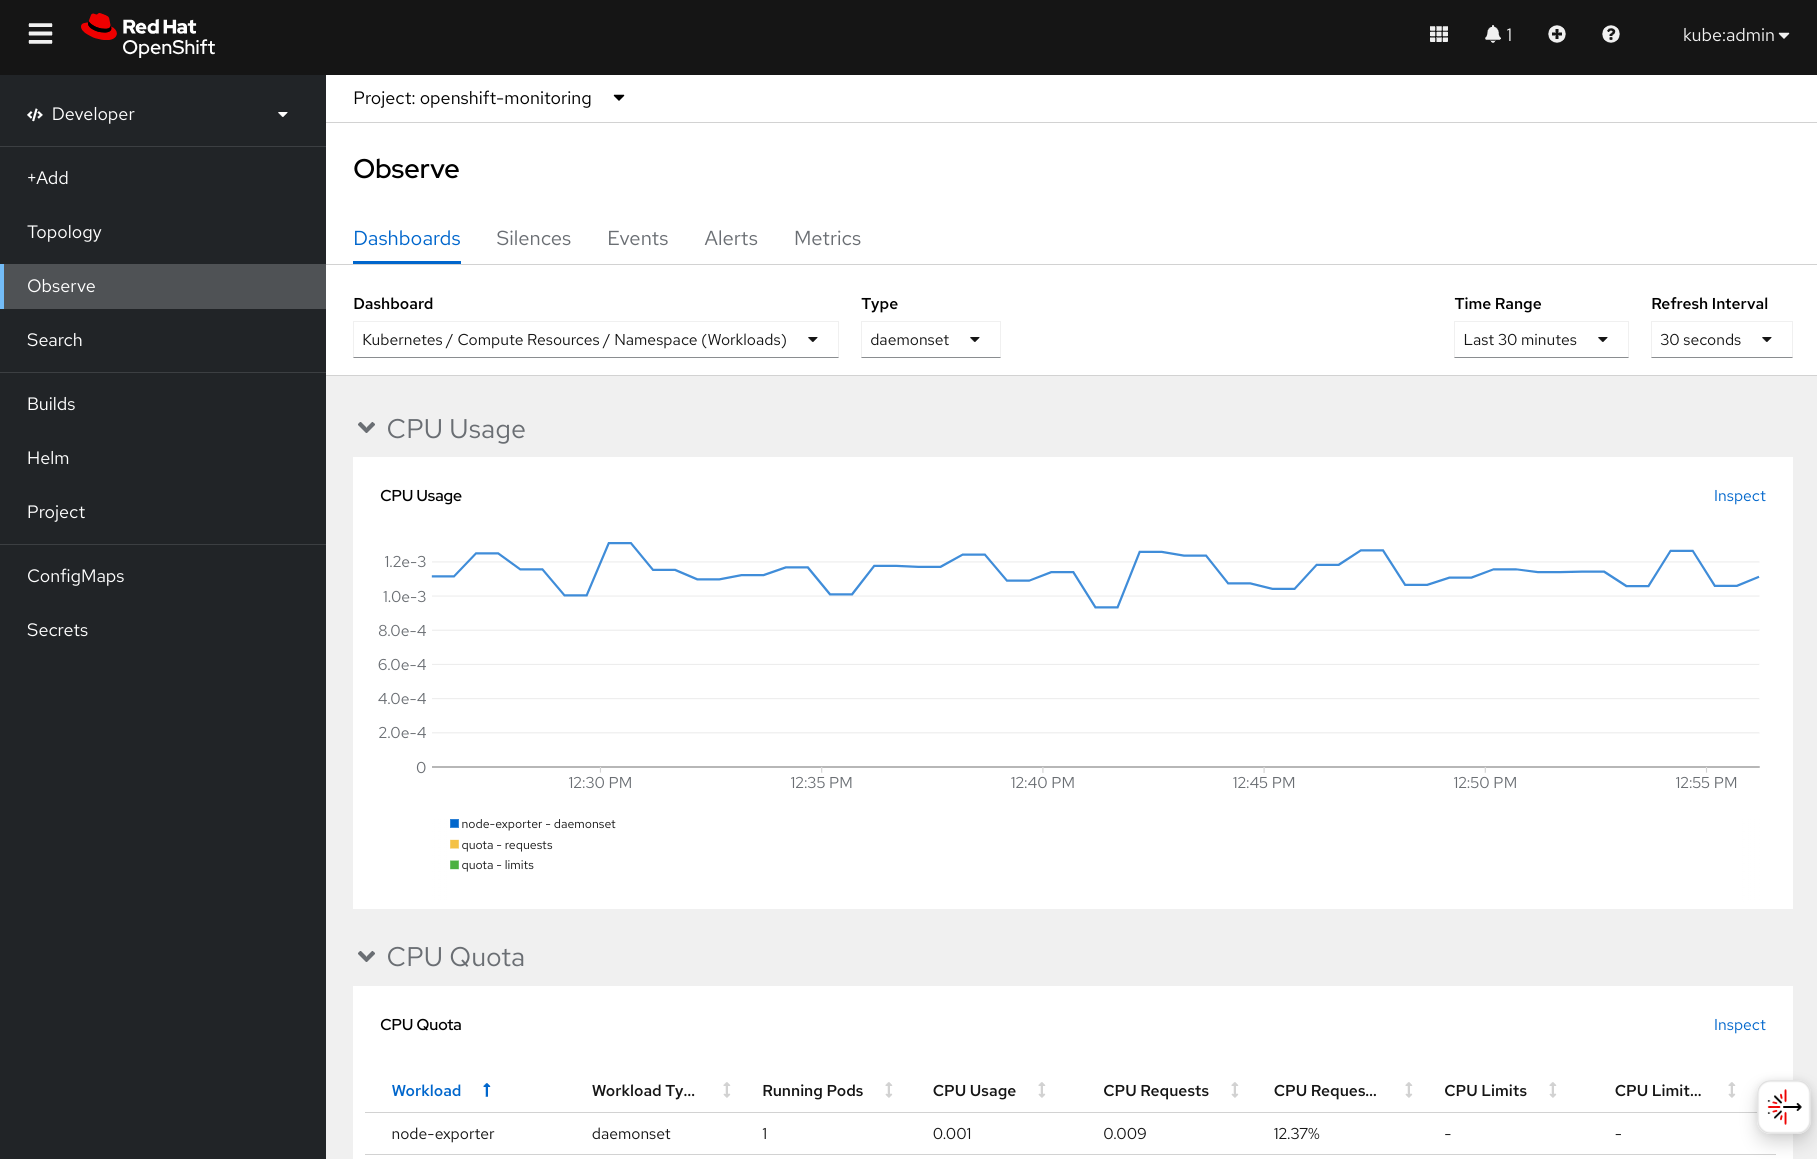
Figure 8.2. Example dashboard in the Developer perspective
8.3. Reviewing monitoring dashboards as a cluster administrator
In the Administrator perspective, you can view dashboards relating to core OpenShift Dedicated cluster components.
Prerequisites
-
You have access to the cluster as a user with the
dedicated-adminrole.
Procedure
-
In the Administrator perspective of the OpenShift Dedicated web console, go to Observe
Dashboards. - Choose a dashboard in the Dashboard list. Some dashboards, such as etcd and Prometheus dashboards, produce additional sub-menus when selected.
Optional: Select a time range for the graphs in the Time Range list.
- Select a pre-defined time period.
Set a custom time range by clicking Custom time range in the Time Range list.
- Input or select the From and To dates and times.
- Click Save to save the custom time range.
- Optional: Select a Refresh Interval.
- Hover over each of the graphs within a dashboard to display detailed information about specific items.
8.4. Reviewing monitoring dashboards as a developer
In the Developer perspective, you can view dashboards relating to a selected project.
In the Developer perspective, you can view dashboards for only one project at a time.
Prerequisites
- You have access to the cluster as a developer or as a user.
- You have view permissions for the project that you are viewing the dashboard for.
Procedure
- In the Developer perspective in the OpenShift Dedicated web console, click Observe and go to the Dashboards tab.
- Select a project from the Project: drop-down list.
Select a dashboard from the Dashboard drop-down list to see the filtered metrics.
NoteAll dashboards produce additional sub-menus when selected, except Kubernetes / Compute Resources / Namespace (Pods).
Optional: Select a time range for the graphs in the Time Range list.
- Select a pre-defined time period.
Set a custom time range by clicking Custom time range in the Time Range list.
- Input or select the From and To dates and times.
- Click Save to save the custom time range.
- Optional: Select a Refresh Interval.
- Hover over each of the graphs within a dashboard to display detailed information about specific items.