Questo contenuto non è disponibile nella lingua selezionata.
Appendix A. Troubleshooting
This section provides the multiple troubleshooting scenarios while using the dashboard.
A.1. Dashboard response is slow
If the dashboard response is slow, clear the browser cache and reload the dashboard.
A.2. Dashboard shows a service is down
Dashboard is only a replica of the cluster. If the service is down, check the service status on the node as dashboard displays information collected via node-exporter running on the node. The issue may be in the cluster, configuration, or network.
A.3. Task failure on Dashboard
While performing any task on the dashboard, if there is any failure, check the respective Ceph daemons. For more information refer to the Troubleshooting Guide
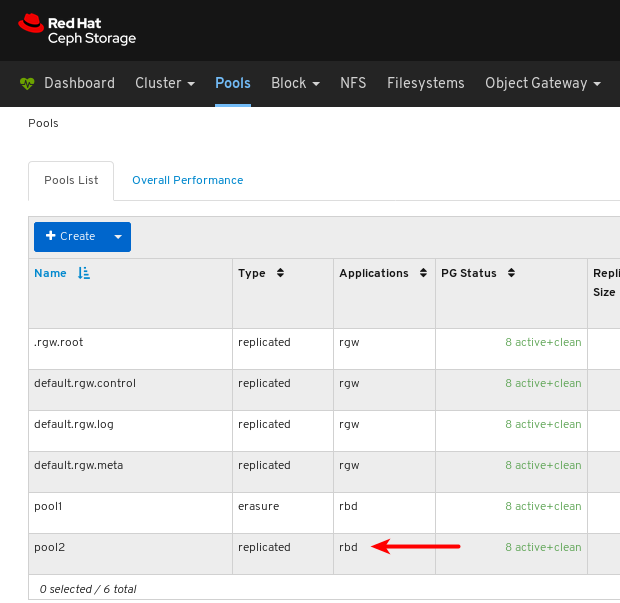
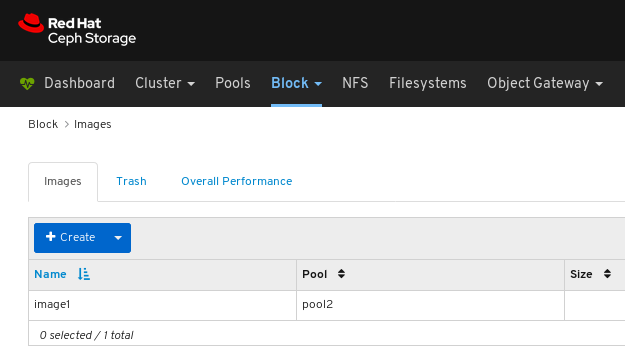
A.4. Images cannot be viewed
An image can only be viewed under Block > Images if the pool it is in has the RBD application enabled on it.
Additional resources
For more information, refer to the Troubleshooting Guide