第13章 Prometheus metrics monitoring in Red Hat Decision Manager
Prometheus is an open-source systems monitoring toolkit that you can use with Red Hat Decision Manager to collect and store metrics related to the execution of business rules, processes, Decision Model and Notation (DMN) models, and other Red Hat Decision Manager assets. You can access the stored metrics through a REST API call to the Decision Server, through the Prometheus expression browser, or using a data-graphing tool such as Grafana.
You can configure Prometheus metrics monitoring for an on-premise Decision Server instance, for Decision Server on Spring Boot, or for a Decision Server deployment on Red Hat OpenShift Container Platform.
For the list of available metrics that Decision Server exposes with Prometheus, download the Red Hat Decision Manager 7.5.1 Source Distribution from the Red Hat Customer Portal and navigate to ~/rhdm-7.5.1-sources/src/droolsjbpm-integration-$VERSION/kie-server-parent/kie-server-services/kie-server-services-prometheus/src/main/java/org/kie/server/services/prometheus.
Red Hat support for Prometheus is limited to the setup and configuration recommendations provided in Red Hat product documentation.
13.1. Configuring Prometheus metrics monitoring for Decision Server
You can configure your Decision Server instances to use Prometheus to collect and store metrics related to your business asset activity in Red Hat Decision Manager. For the list of available metrics that Decision Server exposes with Prometheus, download the Red Hat Decision Manager 7.5.1 Source Distribution from the Red Hat Customer Portal and navigate to ~/rhdm-7.5.1-sources/src/droolsjbpm-integration-$VERSION/kie-server-parent/kie-server-services/kie-server-services-prometheus/src/main/java/org/kie/server/services/prometheus.
Prerequisites
- Decision Server is installed.
-
You have
kie-serveruser role access to Decision Server. - Prometheus is installed. For information about downloading and using Prometheus, see the Prometheus documentation page.
Procedure
-
In your Decision Server instance, set the
org.kie.prometheus.server.ext.disabledsystem property tofalseto enable the Prometheus extension. You can define this property when you start Decision Server or in thestandalone.xmlorstandalone-full.xmlfile of Red Hat Decision Manager distribution. If you are running Red Hat Decision Manager on Spring Boot, add the following dependencies in the
pom.xmlfile of your Maven project and configure the required key in theapplication.propertiessystem property:Spring Boot pom.xml dependencies for Prometheus
<dependency>
  <groupId>org.kie.server</groupId>
  <artifactId>kie-server-services-prometheus</artifactId>
  <version>${rhdm.version}</version>
</dependency>

<dependency>
  <groupId>org.kie.server</groupId>
  <artifactId>kie-server-rest-prometheus</artifactId>
  <version>${rhdm.version}</version>
</dependency>
Spring Boot application.properties key for Red Hat Decision Manager and Prometheus
kieserver.drools.enabled=true
kieserver.dmn.enabled=true
kieserver.prometheus.enabled=true
In the
prometheus.yamlfile of your Prometheus distribution, add the following settings in thescrape_configssection to configure Prometheus to scrape metrics from Decision Server:Scrape configurations in prometheus.yaml file
scrape_configs:
  - job_name: 'kie-server'
    metrics_path: /SERVER_PATH/services/rest/metrics
    basic_auth:
      username: USER_NAME
      password: PASSWORD
    static_configs:
      - targets: ["HOST:PORT"]
Scrape configurations in prometheus.yaml file for Spring Boot (if applicable)
scrape_configs:
  - job_name: 'kie'
    metrics_path: /rest/metrics
    static_configs:
      - targets: ["HOST:PORT"]
Replace the values according to your Decision Server location and settings.
Start the Decision Server instance.
Example start command for Red Hat Decision Manager on Red Hat JBoss EAP
$ cd ~/EAP_HOME/bin
$ ./standalone.sh --c standalone-full.xml
After you start the configured Decision Server instance, Prometheus begins collecting metrics and Decision Server publishes the metrics to the REST API endpoint
http://HOST:PORT/SERVER/services/rest/metrics(or on Spring Boot, tohttp://HOST:PORT/rest/metrics).In a REST client or curl utility, send a REST API request with the following components to verify that Decision Server is publishing the metrics:
For REST client:
-
Authentication: Enter the user name and password of the Decision Server user with the
kie-serverrole. HTTP Headers: Set the following header:
-
Accept:application/json
-
-
HTTP method: Set to
GET. -
URL: Enter the Decision Server REST API base URL and metrics endpoint, such as
http://localhost:8080/kie-server/services/rest/metrics(or on Spring Boot,http://localhost:8080/rest/metrics).
For curl utility:
-
-u: Enter the user name and password of the Decision Server user with thekie-serverrole. -H: Set the following header:-
accept:application/json
-
-
-X: Set toGET. -
URL: Enter the Decision Server REST API base URL and metrics endpoint, such as
http://localhost:8080/kie-server/services/rest/metrics(or on Spring Boot,http://localhost:8080/rest/metrics).
curl -u 'baAdmin:password@1' -H "accept: application/json" -X GET "http://localhost:8080/kie-server/services/rest/metrics"Example server response
# HELP kie_server_container_started_total Kie Server Started Containers
# TYPE kie_server_container_started_total counter
kie_server_container_started_total{container_id="task-assignment-kjar-1.0",} 1.0
# HELP solvers_running Number of solvers currently running
# TYPE solvers_running gauge
solvers_running 0.0
# HELP dmn_evaluate_decision_nanosecond DMN Evaluation Time
# TYPE dmn_evaluate_decision_nanosecond histogram
# HELP solver_duration_seconds Time in seconds it took solver to solve the constraint problem
# TYPE solver_duration_seconds summary
solver_duration_seconds_count{solver_id="100tasks-5employees.xml",} 1.0
solver_duration_seconds_sum{solver_id="100tasks-5employees.xml",} 179.828255925
solver_duration_seconds_count{solver_id="24tasks-8employees.xml",} 1.0
solver_duration_seconds_sum{solver_id="24tasks-8employees.xml",} 179.995759653
# HELP drl_match_fired_nanosecond Drools Firing Time
# TYPE drl_match_fired_nanosecond histogram
# HELP dmn_evaluate_failed_count DMN Evaluation Failed
# TYPE dmn_evaluate_failed_count counter
# HELP kie_server_start_time Kie Server Start Time
# TYPE kie_server_start_time gauge
kie_server_start_time{name="myapp-kieserver",server_id="myapp-kieserver",location="http://myapp-kieserver-demo-monitoring.127.0.0.1.nip.io:80/services/rest/server",version="7.4.0.redhat-20190428",} 1.557221271502E12
# HELP kie_server_container_running_total Kie Server Running Containers
# TYPE kie_server_container_running_total gauge
kie_server_container_running_total{container_id="task-assignment-kjar-1.0",} 1.0
# HELP solver_score_calculation_speed Number of moves per second for a particular solver solving the constraint problem
# TYPE solver_score_calculation_speed summary
solver_score_calculation_speed_count{solver_id="100tasks-5employees.xml",} 1.0
solver_score_calculation_speed_sum{solver_id="100tasks-5employees.xml",} 6997.0
solver_score_calculation_speed_count{solver_id="24tasks-8employees.xml",} 1.0
solver_score_calculation_speed_sum{solver_id="24tasks-8employees.xml",} 19772.0
If the metrics are not available in Decision Server, review and verify the Decision Server and Prometheus configurations described in this section.
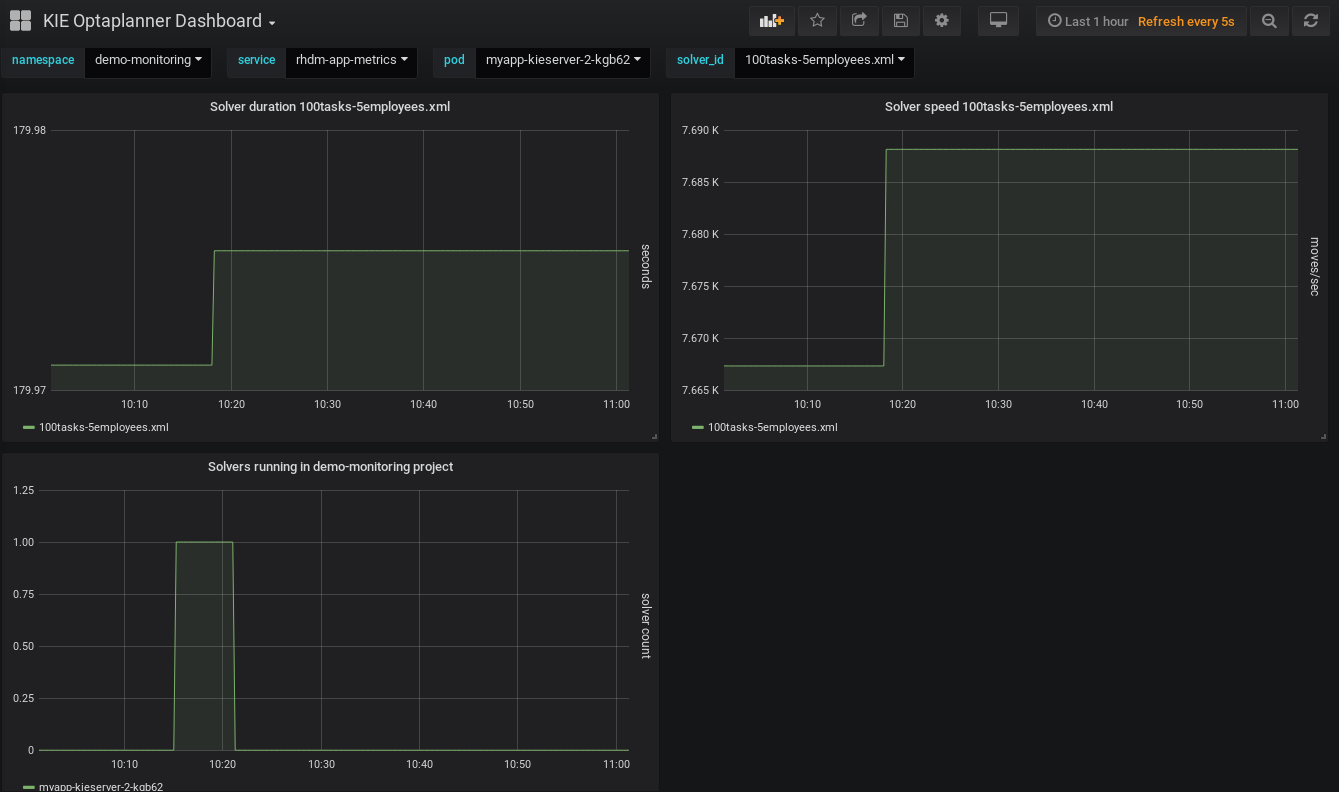
You can also interact with your collected metrics in the Prometheus expression browser at
http://HOST:PORT/graph, or integrate your Prometheus data source with a data-graphing tool such as Grafana:図13.1 Prometheus expression browser with Decision Server metrics
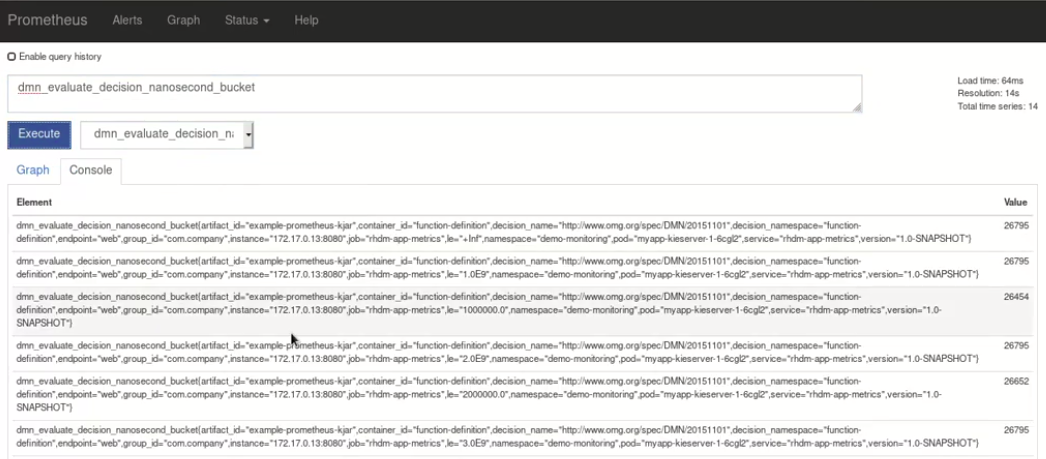
図13.2 Prometheus expression browser with Decision Server target

図13.3 Grafana dashboard with Decision Server metrics for DMN models
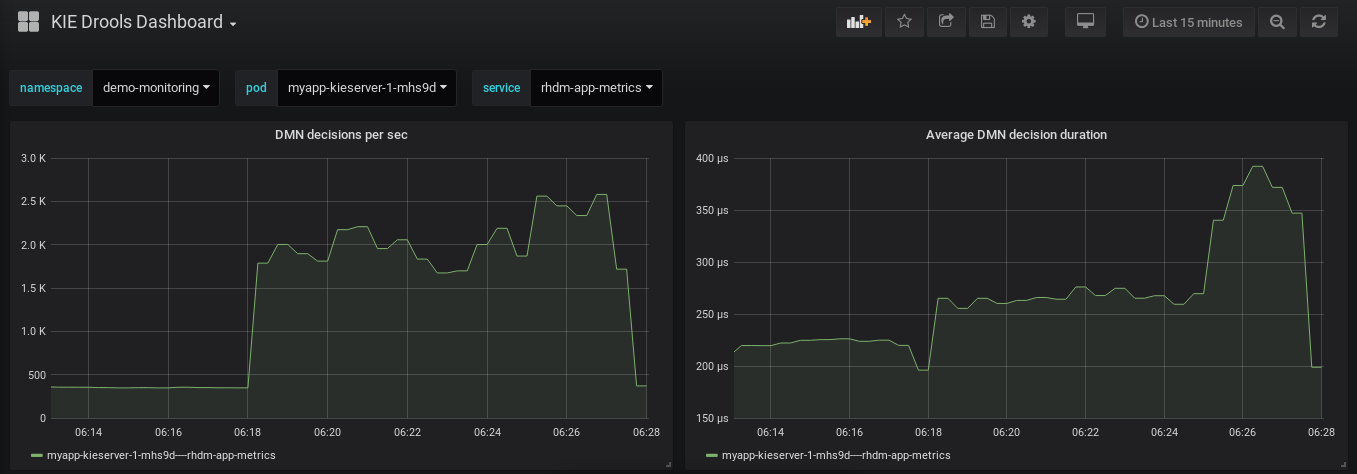
図13.4 Grafana dashboard with Decision Server metrics for solvers
-
Authentication: Enter the user name and password of the Decision Server user with the
Additional resources