第13章 Prometheus metrics monitoring in Red Hat Decision Manager
Prometheus is an open-source systems monitoring toolkit that you can use with Red Hat Decision Manager to collect and store metrics related to the execution of business rules, processes, Decision Model and Notation (DMN) models, and other Red Hat Decision Manager assets. You can access the stored metrics through a REST API call to the KIE Server, through the Prometheus expression browser, or using a data-graphing tool such as Grafana.
You can configure Prometheus metrics monitoring for an on-premise KIE Server instance, for KIE Server on Spring Boot, or for a KIE Server deployment on Red Hat OpenShift Container Platform.
For the list of available metrics that KIE Server exposes with Prometheus, download the Red Hat Decision Manager 7.8.0 Source Distribution from the Red Hat Customer Portal and navigate to ~/rhdm-7.8.0-sources/src/droolsjbpm-integration-$VERSION/kie-server-parent/kie-server-services/kie-server-services-prometheus/src/main/java/org/kie/server/services/prometheus.
Red Hat support for Prometheus is limited to the setup and configuration recommendations provided in Red Hat product documentation.
13.1. Configuring Prometheus metrics monitoring for KIE Server
You can configure your KIE Server instances to use Prometheus to collect and store metrics related to your business asset activity in Red Hat Decision Manager. For the list of available metrics that KIE Server exposes with Prometheus, download the Red Hat Decision Manager 7.8.0 Source Distribution from the Red Hat Customer Portal and navigate to ~/rhdm-7.8.0-sources/src/droolsjbpm-integration-$VERSION/kie-server-parent/kie-server-services/kie-server-services-prometheus/src/main/java/org/kie/server/services/prometheus.
Prerequisites
- KIE Server is installed.
-
You have
kie-serveruser role access to KIE Server. - Prometheus is installed. For information about downloading and using Prometheus, see the Prometheus documentation page.
Procedure
-
In your KIE Server instance, set the
org.kie.prometheus.server.ext.disabledsystem property tofalseto enable the Prometheus extension. You can define this property when you start KIE Server or in thestandalone.xmlorstandalone-full.xmlfile of Red Hat Decision Manager distribution. If you are running Red Hat Decision Manager on Spring Boot, configure the required key in the
application.propertiessystem property:Spring Boot application.properties key for Red Hat Decision Manager and Prometheus
kieserver.drools.enabled=true
kieserver.dmn.enabled=true
kieserver.prometheus.enabled=true
kieserver.drools.enabled=true
kieserver.dmn.enabled=true
kieserver.prometheus.enabled=true
Copy to Clipboard Copied! Toggle word wrap Toggle overflow In the
prometheus.yamlfile of your Prometheus distribution, add the following settings in thescrape_configssection to configure Prometheus to scrape metrics from KIE Server:Scrape configurations in prometheus.yaml file
Copy to Clipboard Copied! Toggle word wrap Toggle overflow Scrape configurations in prometheus.yaml file for Spring Boot (if applicable)
scrape_configs: - job_name: 'kie' metrics_path: /rest/metrics static_configs: - targets: ["HOST:PORT"]scrape_configs: - job_name: 'kie' metrics_path: /rest/metrics static_configs: - targets: ["HOST:PORT"]Copy to Clipboard Copied! Toggle word wrap Toggle overflow Replace the values according to your KIE Server location and settings.
Start the KIE Server instance.
Example start command for Red Hat Decision Manager on Red Hat JBoss EAP
cd ~/EAP_HOME/bin
./standalone.sh --c standalone-full.xml
$ cd ~/EAP_HOME/bin
$ ./standalone.sh --c standalone-full.xml
Copy to Clipboard Copied! Toggle word wrap Toggle overflow After you start the configured KIE Server instance, Prometheus begins collecting metrics and KIE Server publishes the metrics to the REST API endpoint
http://HOST:PORT/SERVER/services/rest/metrics(or on Spring Boot, tohttp://HOST:PORT/rest/metrics).In a REST client or curl utility, send a REST API request with the following components to verify that KIE Server is publishing the metrics:
For REST client:
-
Authentication: Enter the user name and password of the KIE Server user with the
kie-serverrole. HTTP Headers: Set the following header:
-
Accept:application/json
-
-
HTTP method: Set to
GET. -
URL: Enter the KIE Server REST API base URL and metrics endpoint, such as
http://localhost:8080/kie-server/services/rest/metrics(or on Spring Boot,http://localhost:8080/rest/metrics).
For curl utility:
-
-u: Enter the user name and password of the KIE Server user with thekie-serverrole. -H: Set the following header:-
accept:application/json
-
-
-X: Set toGET. -
URL: Enter the KIE Server REST API base URL and metrics endpoint, such as
http://localhost:8080/kie-server/services/rest/metrics(or on Spring Boot,http://localhost:8080/rest/metrics).
Example curl command for Red Hat Decision Manager on Red Hat JBoss EAP
curl -u 'baAdmin:password@1' -X GET "http://localhost:8080/kie-server/services/rest/metrics"
curl -u 'baAdmin:password@1' -X GET "http://localhost:8080/kie-server/services/rest/metrics"Copy to Clipboard Copied! Toggle word wrap Toggle overflow Example curl command for Red Hat Decision Manager on Spring Boot
curl -u 'baAdmin:password@1' -X GET "http://localhost:8080/rest/metrics"
curl -u 'baAdmin:password@1' -X GET "http://localhost:8080/rest/metrics"Copy to Clipboard Copied! Toggle word wrap Toggle overflow Example server response
Copy to Clipboard Copied! Toggle word wrap Toggle overflow If the metrics are not available in KIE Server, review and verify the KIE Server and Prometheus configurations described in this section.
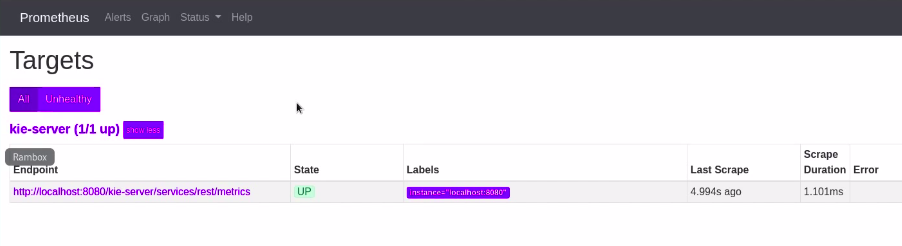
You can also interact with your collected metrics in the Prometheus expression browser at
http://HOST:PORT/graph, or integrate your Prometheus data source with a data-graphing tool such as Grafana:図13.1 Prometheus expression browser with KIE Server metrics
図13.2 Prometheus expression browser with KIE Server target
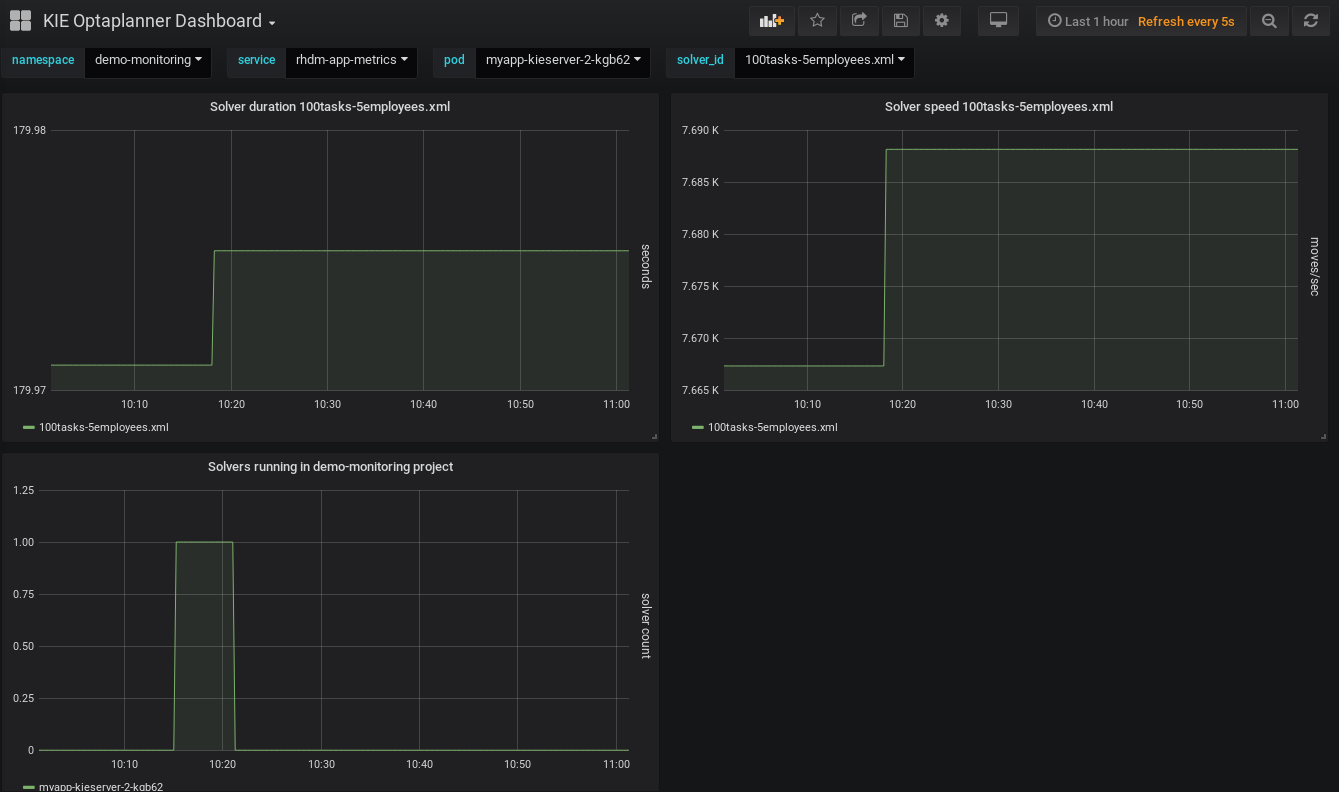
図13.3 Grafana dashboard with KIE Server metrics for DMN models
図13.4 Grafana dashboard with KIE Server metrics for solvers
-
Authentication: Enter the user name and password of the KIE Server user with the


Additional resources