このコンテンツは選択した言語では利用できません。
Chapter 14. Accessing Prometheus
For this release, Prometheus is only supported for Fuse on OpenShift. For documentation about Prometheus on OpenShift Container Platform, go to: https://access.redhat.com/documentation/en-us/openshift_container_platform/3.10/html-single/configuring_clusters/#openshift-prometheus
Prometheus on OpenShift is a Technology Preview feature only. Technology Preview features are not supported with Red Hat production service level agreements (SLAs), might not be functionally complete, and Red Hat does not recommend to use them for production. These features provide early access to upcoming product features, enabling customers to test functionality and provide feedback during the development process.
For more information on Red Hat Technology Preview features support scope, see https://access.redhat.com/support/offerings/techpreview/.
You can use Prometheus to monitor and store Fuse on OpenShift data by exposing an endpoint with your Fuse application’s data to Prometheus format. Prometheus stores the data so that you can use a graphical tool, such as Grafana, to visualize and run queries on the data.
You can use Prometheus to monitor Fuse applications on an installed and running single-node OpenShift cluster such as Minishift or the Red Hat Container Development Kit. A single-node OpenShift cluster provides you with access to a cloud environment that is similar to a production environment.
For information on installing and developing with Red Hat Fuse on OpenShift, see the Fuse on OpenShift Guide.
14.1. Setting up Prometheus to access Fuse applications on Minishift
Follow these steps to add Prometheus and Grafana to your Fuse on OpenShift project:
At the command line, follow these steps:
Start Minishift with the following options:
MINISHIFT_ENABLE_EXPERIMENTAL=y minishift start --ocp-tag v3.10.14 --extra-clusterup-flags "--enable=*,service-catalog"
MINISHIFT_ENABLE_EXPERIMENTAL=y minishift start --ocp-tag v3.10.14 --extra-clusterup-flags "--enable=*,service-catalog"Copy to Clipboard Copied! Toggle word wrap Toggle overflow At the prompt, login as the system admin user:
oc login -u system:admin
oc login -u system:adminCopy to Clipboard Copied! Toggle word wrap Toggle overflow Download and install the Ansible Service Broker:
curl https://raw.githubusercontent.com/openshift/ansible-service-broker/release-1.2/apb/install.yaml | oc create -f -
curl https://raw.githubusercontent.com/openshift/ansible-service-broker/release-1.2/apb/install.yaml | oc create -f -Copy to Clipboard Copied! Toggle word wrap Toggle overflow Get a list of the installed projects:
oc get projects -w
oc get projects -wCopy to Clipboard Copied! Toggle word wrap Toggle overflow This command returns a constantly updating list of projects:
Copy to Clipboard Copied! Toggle word wrap Toggle overflow Monitor this list to see when the automation-broker is active. It can take some time (approximately two minutes) for
automation-broker-apbto install the automation broker:automation-broker Active
automation-broker ActiveCopy to Clipboard Copied! Toggle word wrap Toggle overflow -
When the list of projects indicates that the automation-broker is active, press
CTRL + Cto cancel theoc get projects -wcommand. Run the following command:
oc export cm/broker-config -n automation-broker | sed 's/sandbox_role: .*/sandbox_role: \"admin\"/' | oc replace -f - cm/broker-config -n automation-broker
oc export cm/broker-config -n automation-broker | sed 's/sandbox_role: .*/sandbox_role: \"admin\"/' | oc replace -f - cm/broker-config -n automation-brokerCopy to Clipboard Copied! Toggle word wrap Toggle overflow The command returns this message:
configmap "broker-config" replaced
configmap "broker-config" replacedCopy to Clipboard Copied! Toggle word wrap Toggle overflow It then takes some time to retrieve the Ansible Playbook catalog. (Now is a good time for you to take a coffee or tea break.)
NoteYou can use the following command to monitor the status of the automation-broker:
oc get pods -n automation-broker -w
oc get pods -n automation-broker -wCopy to Clipboard Copied! Toggle word wrap Toggle overflow Wait several minutes and then run this command:
oc rollout latest dc/automation-broker -n automation-broker
oc rollout latest dc/automation-broker -n automation-brokerCopy to Clipboard Copied! Toggle word wrap Toggle overflow If the following message is returned, you must wait longer and then rerun the oc rollout command:
Error from server (NotFound): deploymentconfigs.apps.openshift.io "automation-broker" not found
Error from server (NotFound): deploymentconfigs.apps.openshift.io "automation-broker" not foundCopy to Clipboard Copied! Toggle word wrap Toggle overflow When the following message is returned by the
oc rolloutcommand, the command was successful and you can move to the next step:error: #1 is already in progress (Running).
error: #1 is already in progress (Running).Copy to Clipboard Copied! Toggle word wrap Toggle overflow Open the OpenShift web console:
minishift console
minishift consoleCopy to Clipboard Copied! Toggle word wrap Toggle overflow Your web browser opens:
Follow these steps in the OpenShift web console:
Log into the web console with your developer credentials (for example, developer/developer).
NoteIf you are already logged into the web console, clear the web browser cache so that you can find the Prometheus (APB) item in the next step.
In the catalog search field, type Prometheus, and then select the Prometheus (APB) item:

The Prometheus (APB) wizard opens:
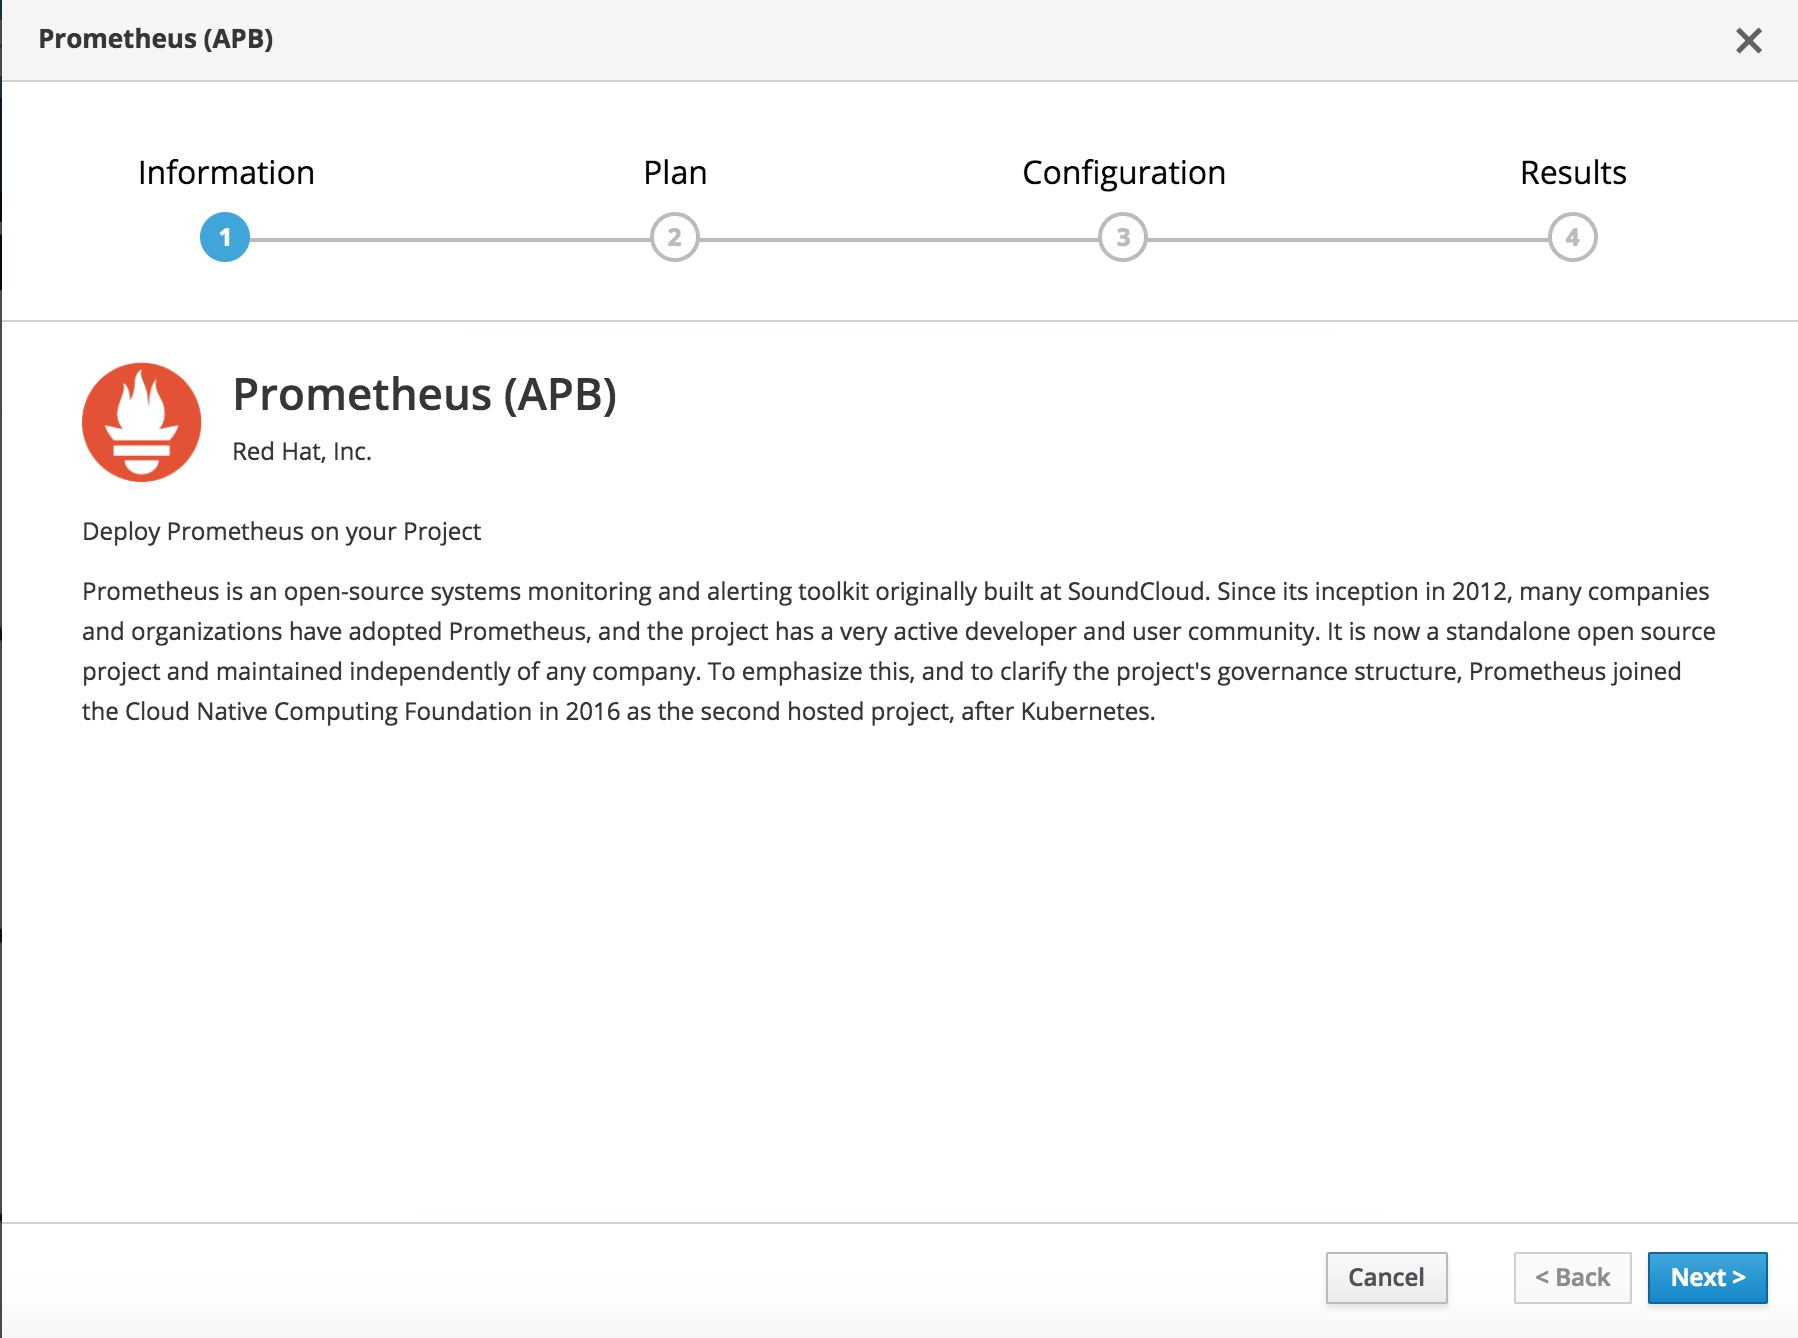
Click Next.
Page 2 of the wizard opens:
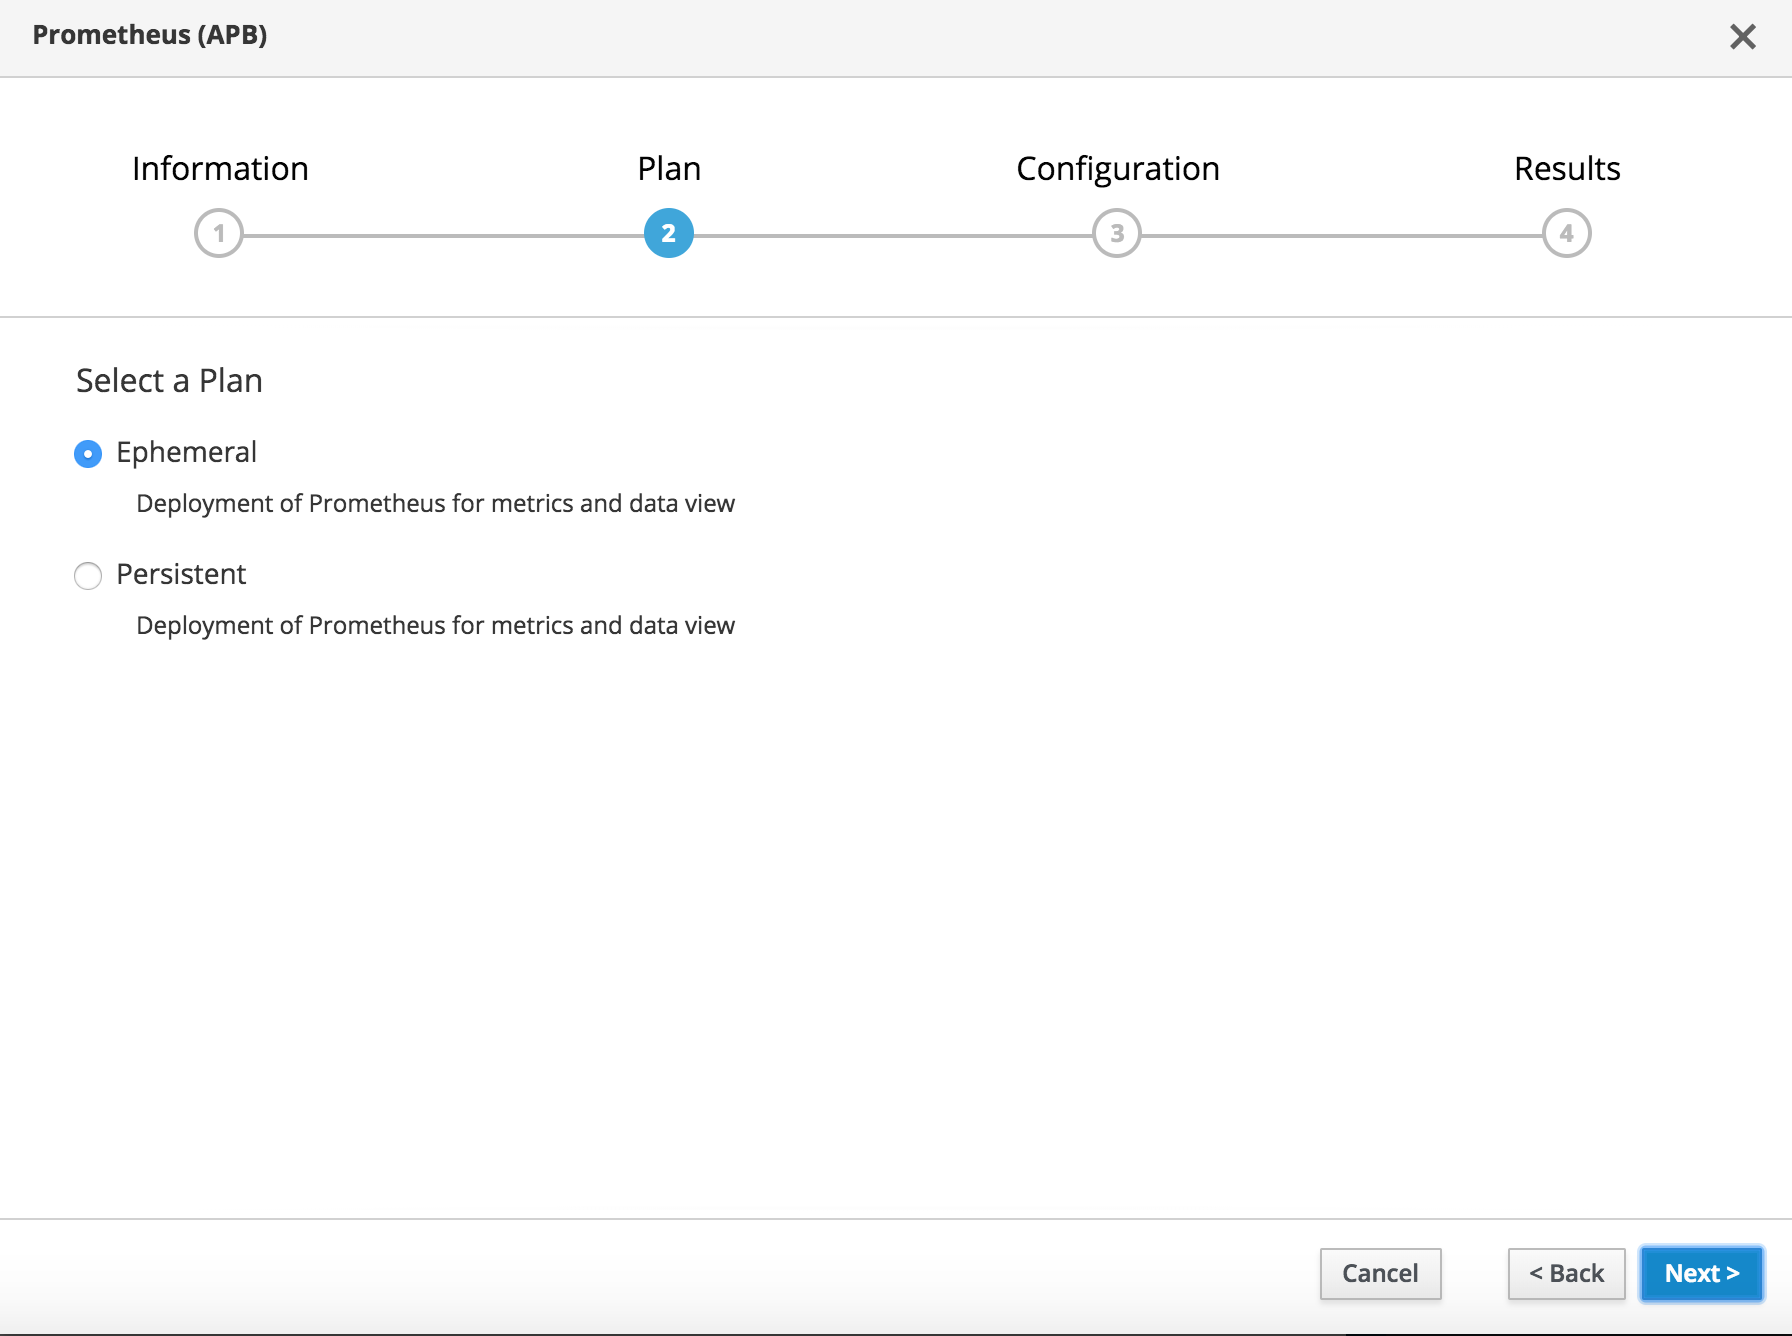
- Select Ephemeral or Persistent. If you select Ephemeral, OpenShift stores the Prometheus metrics and data only for the duration of the current session. If you select Persistent, OpenShift writes the Prometheus metrics and data to disk and stores it until the Minishift VM is deleted.
Click Next.
Page 3 of the wizard opens:
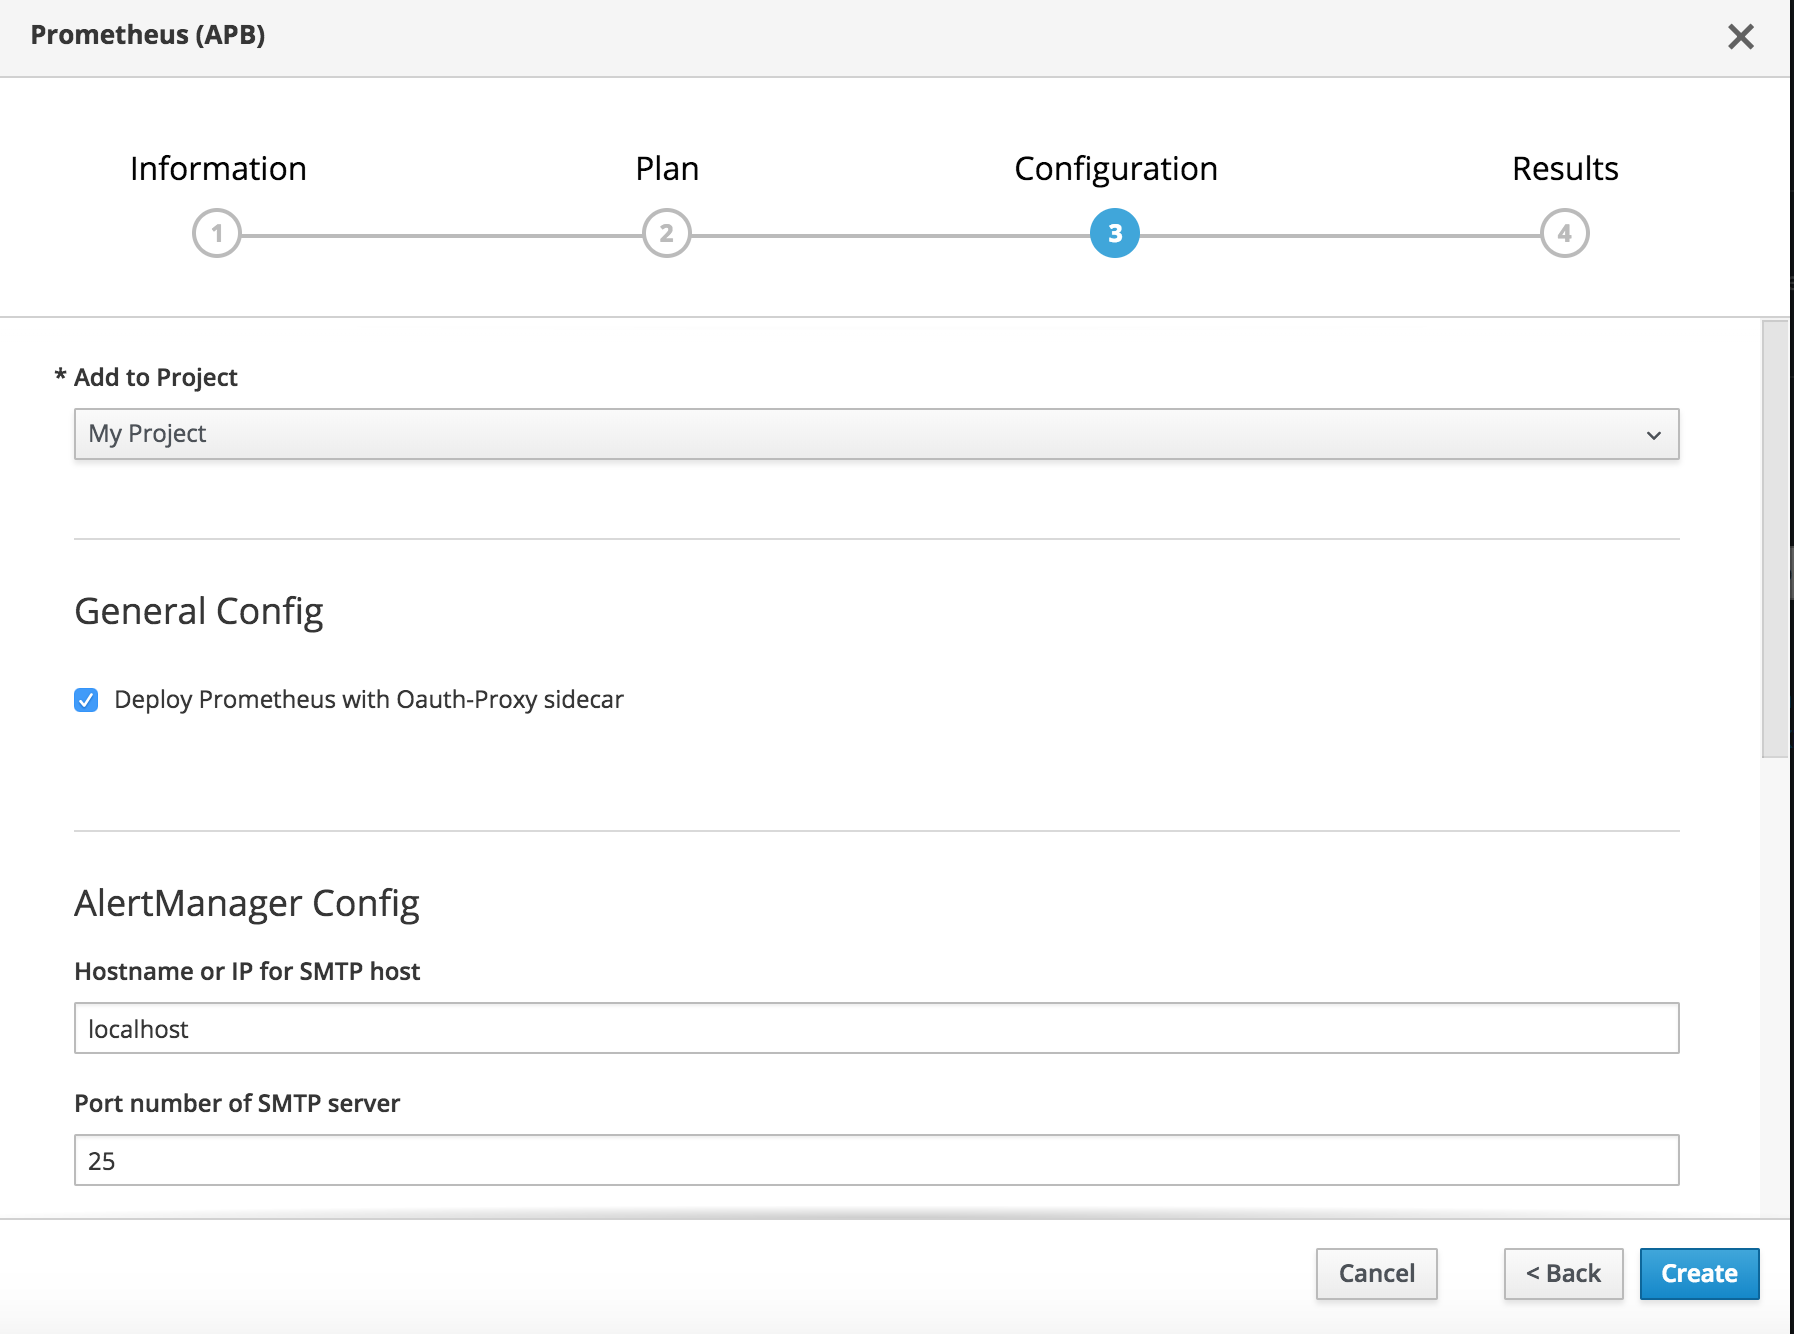
- Specify the project that contains the Fuse application.
- If you want to require OpenShift login to access the Prometheus and Grafana dashboards, check the Deploy Prometheus with Oauth-Proxy sidecar option.
Scroll down to see the Grafana config section and then check the Deploy Grafana server with Prometheus as datasource option.
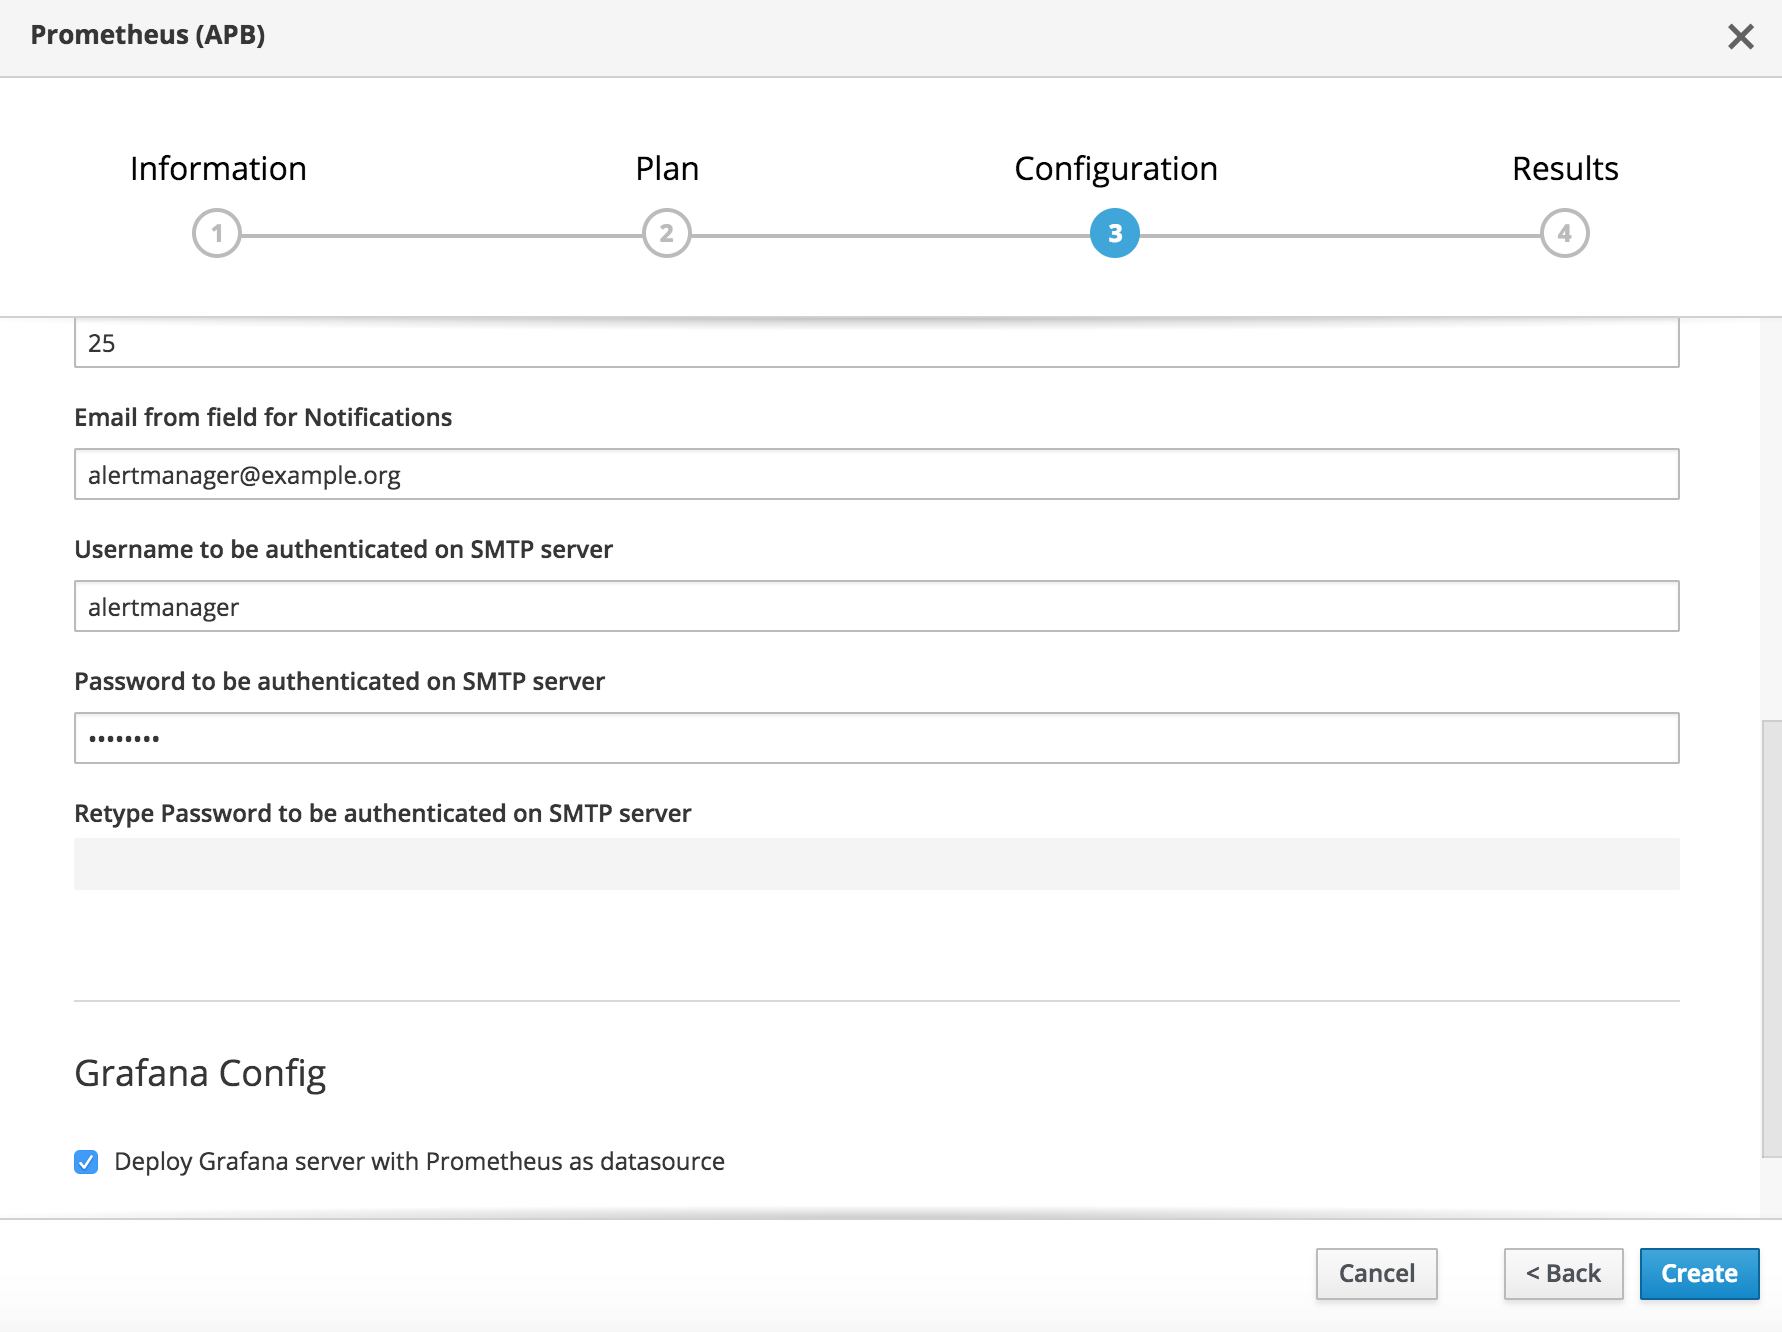
Click Create.
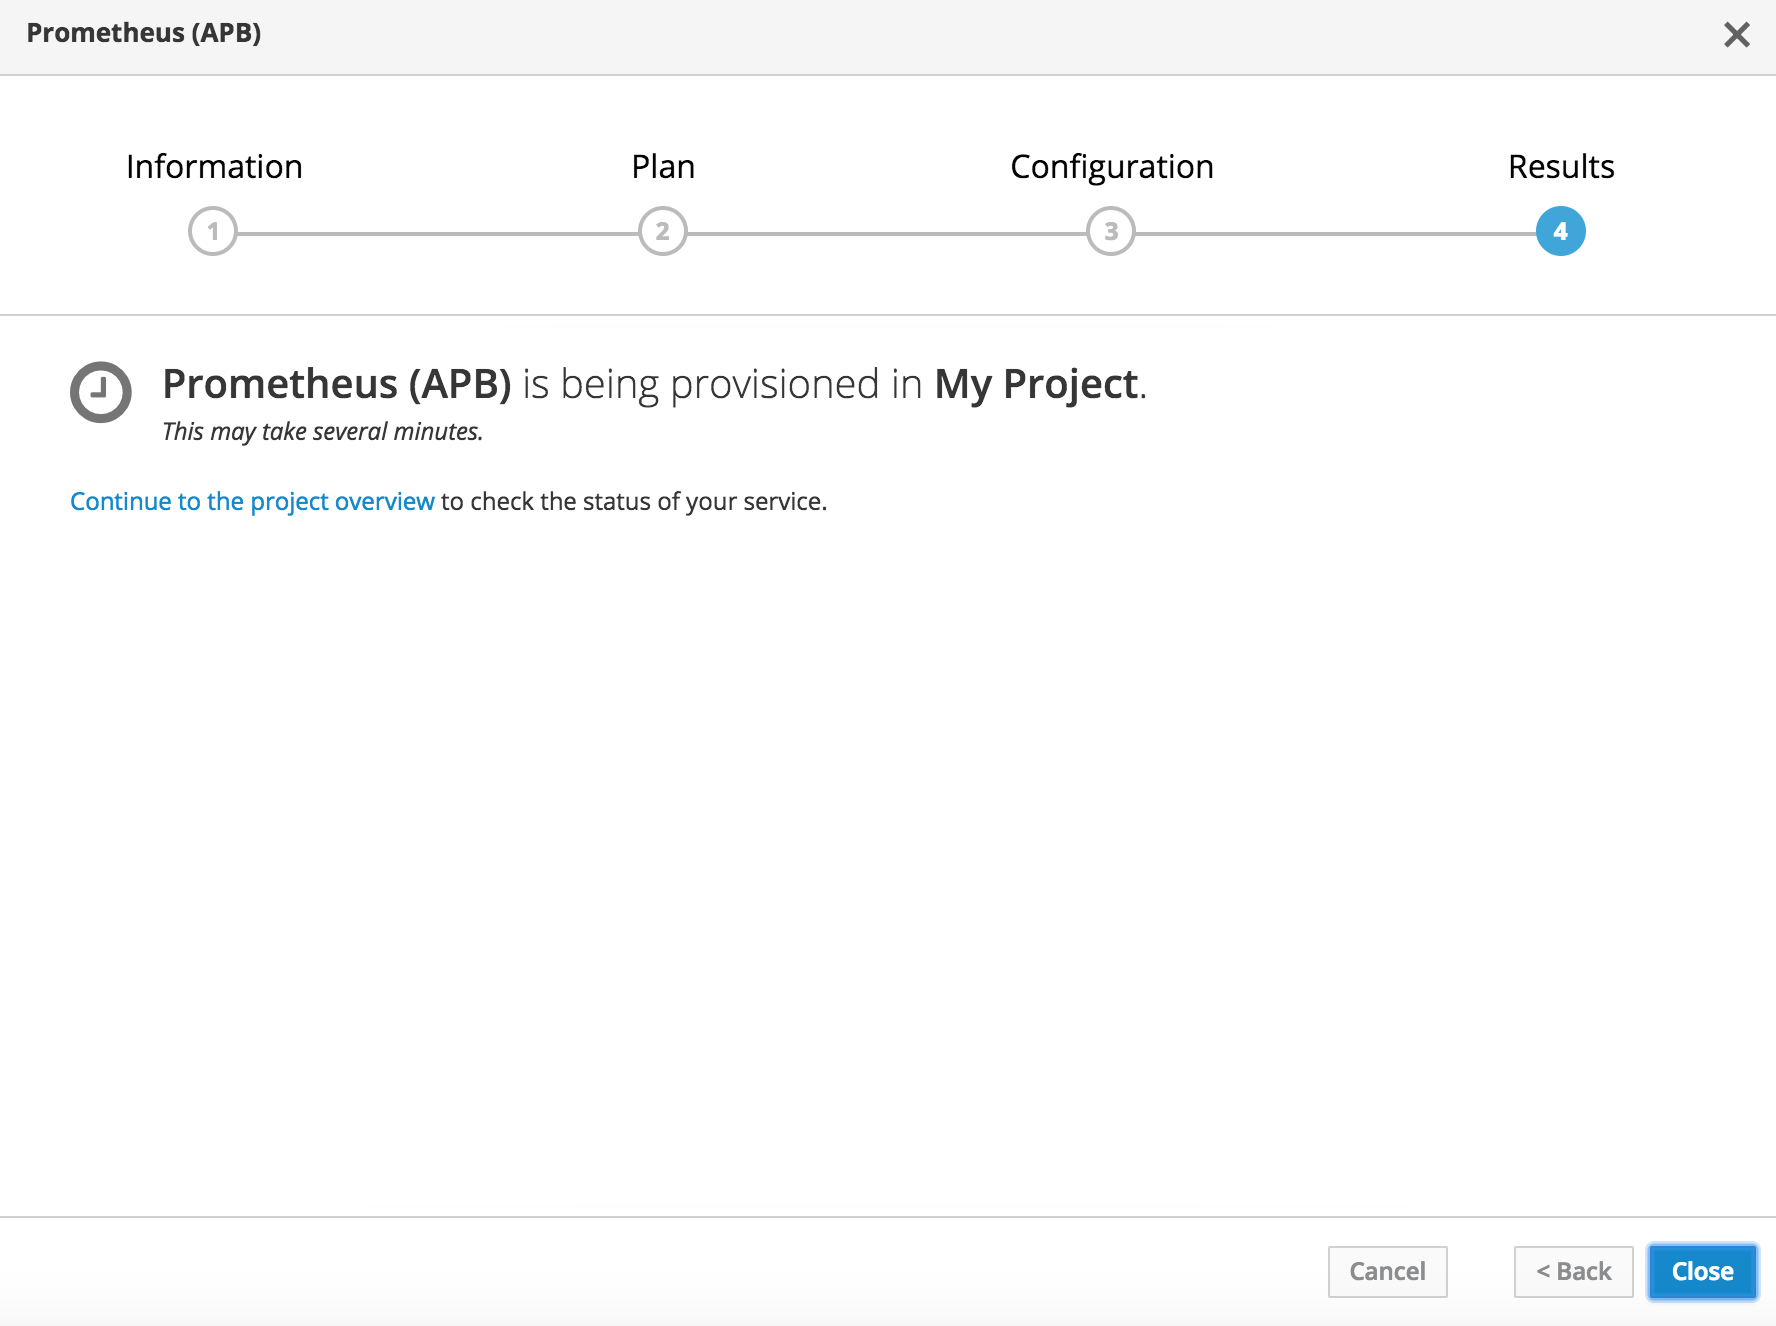
- Click the Continue to the project overview link.
Wait until OpenShift provisions the Prometheus (APB) service.

To open the Prometheus dashboard:
When the Prometheus application is ready (as shown in the following screen capture), click the provided URL (for example,
https://prometheus-proxy-myproject.192.168.64.27.nip.io):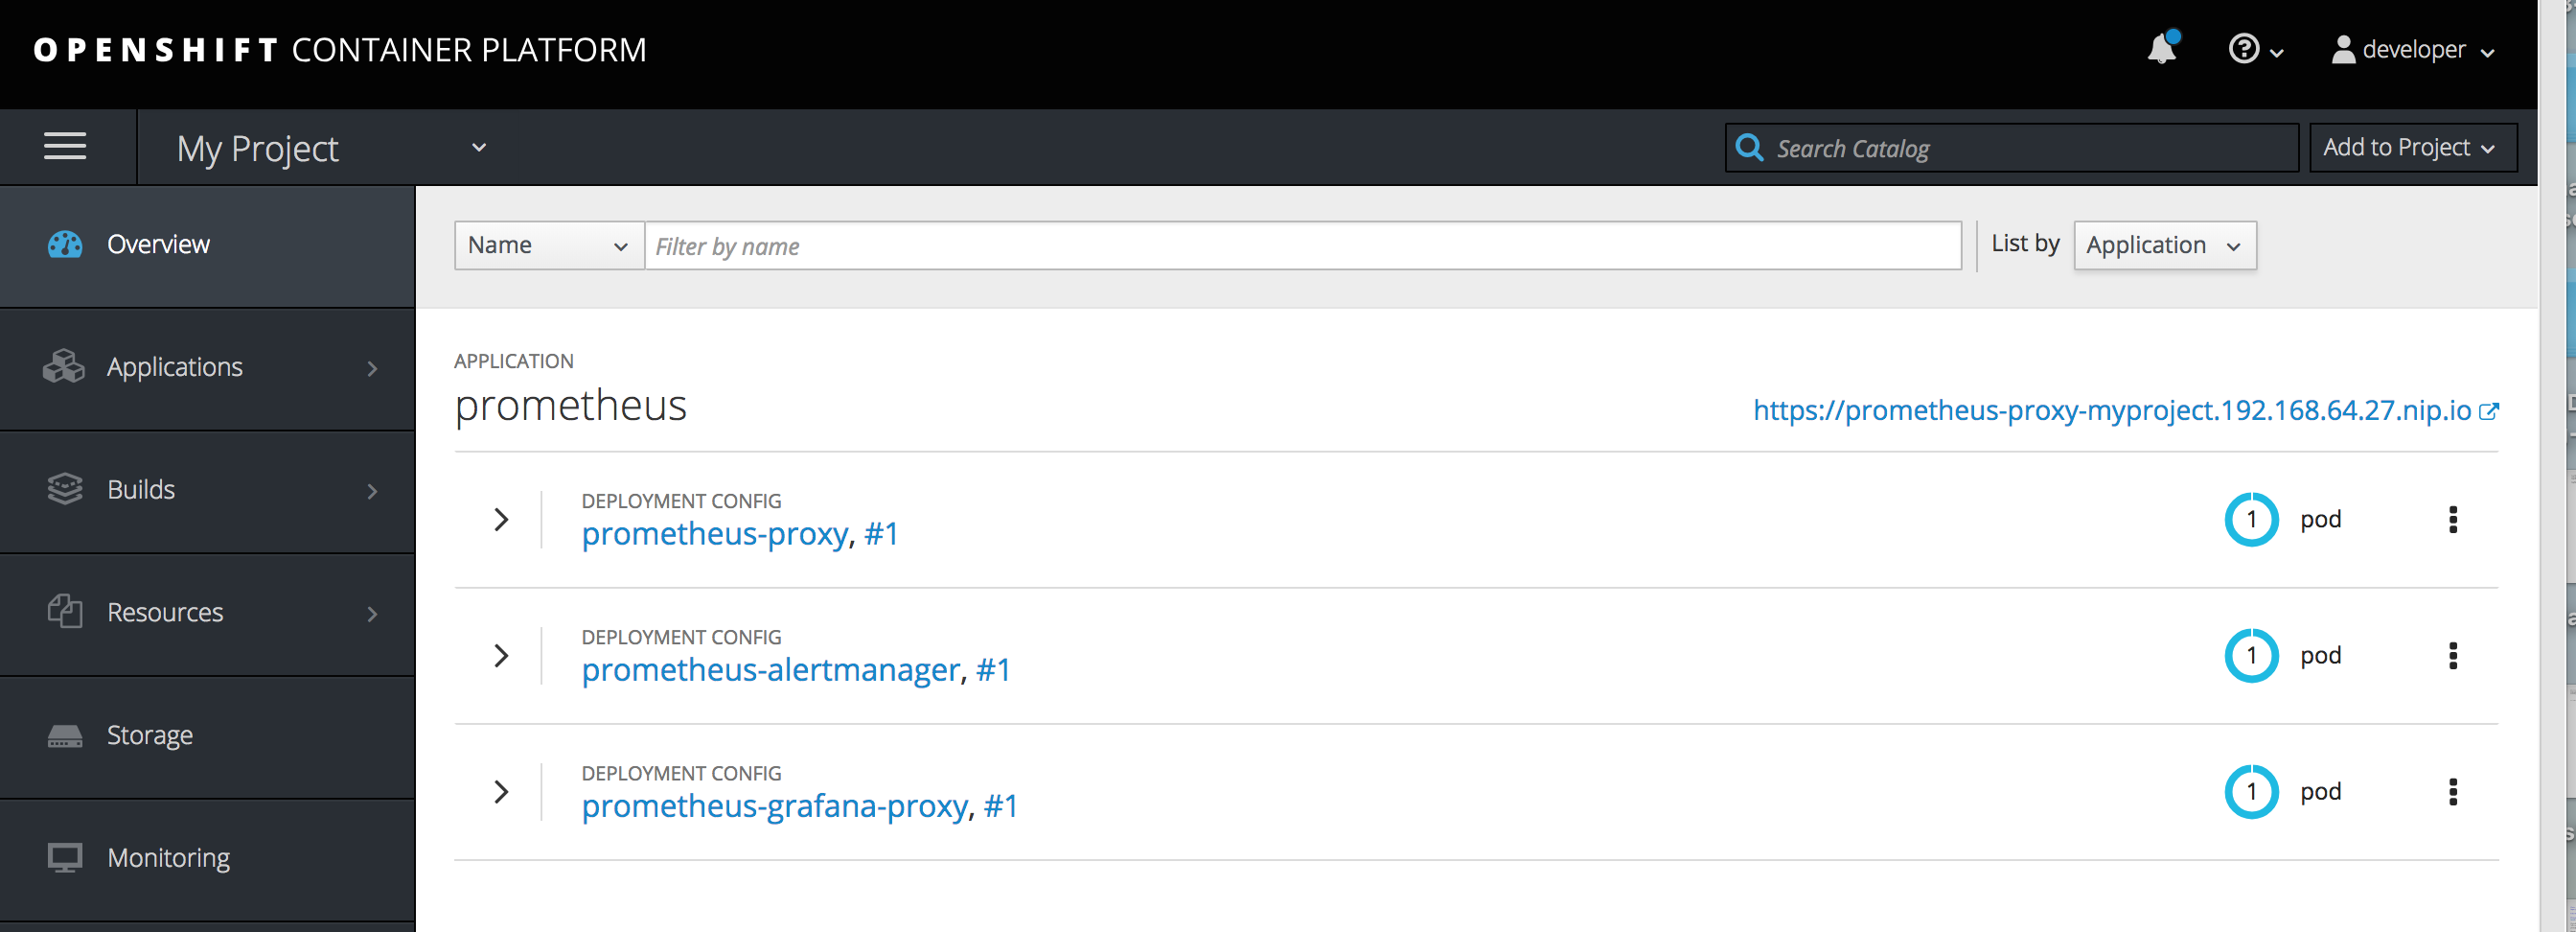
- If you selected the Deploy Prometheus with Oauth-Proxy sidecar option, you must login using your OpenShift user name and password (for example, developer/developer).
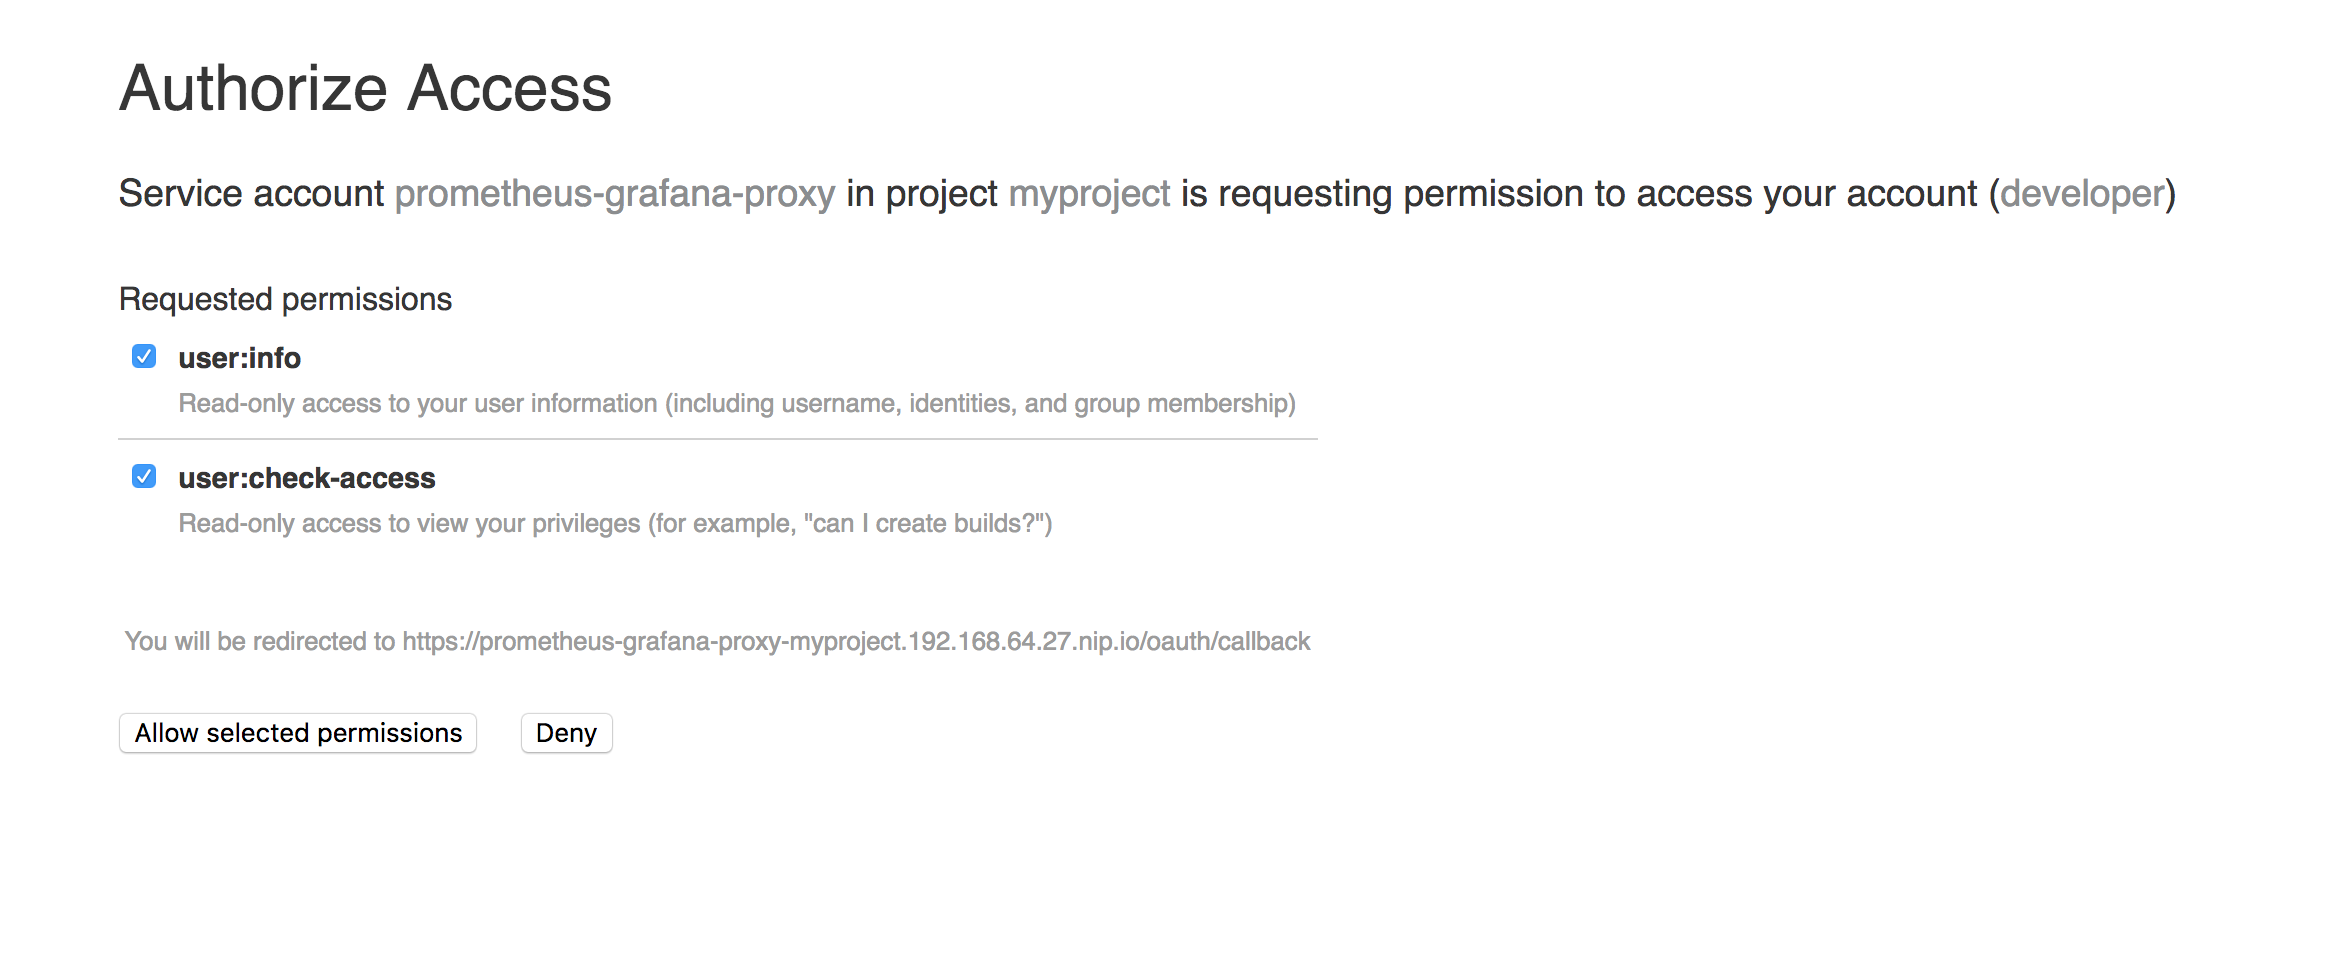
In the Authorize Access page, leave the user:info and user:check-access options checked and click Allow selected permissions.
The Prometheus dashboard opens.
To open the Grafana dashboard:
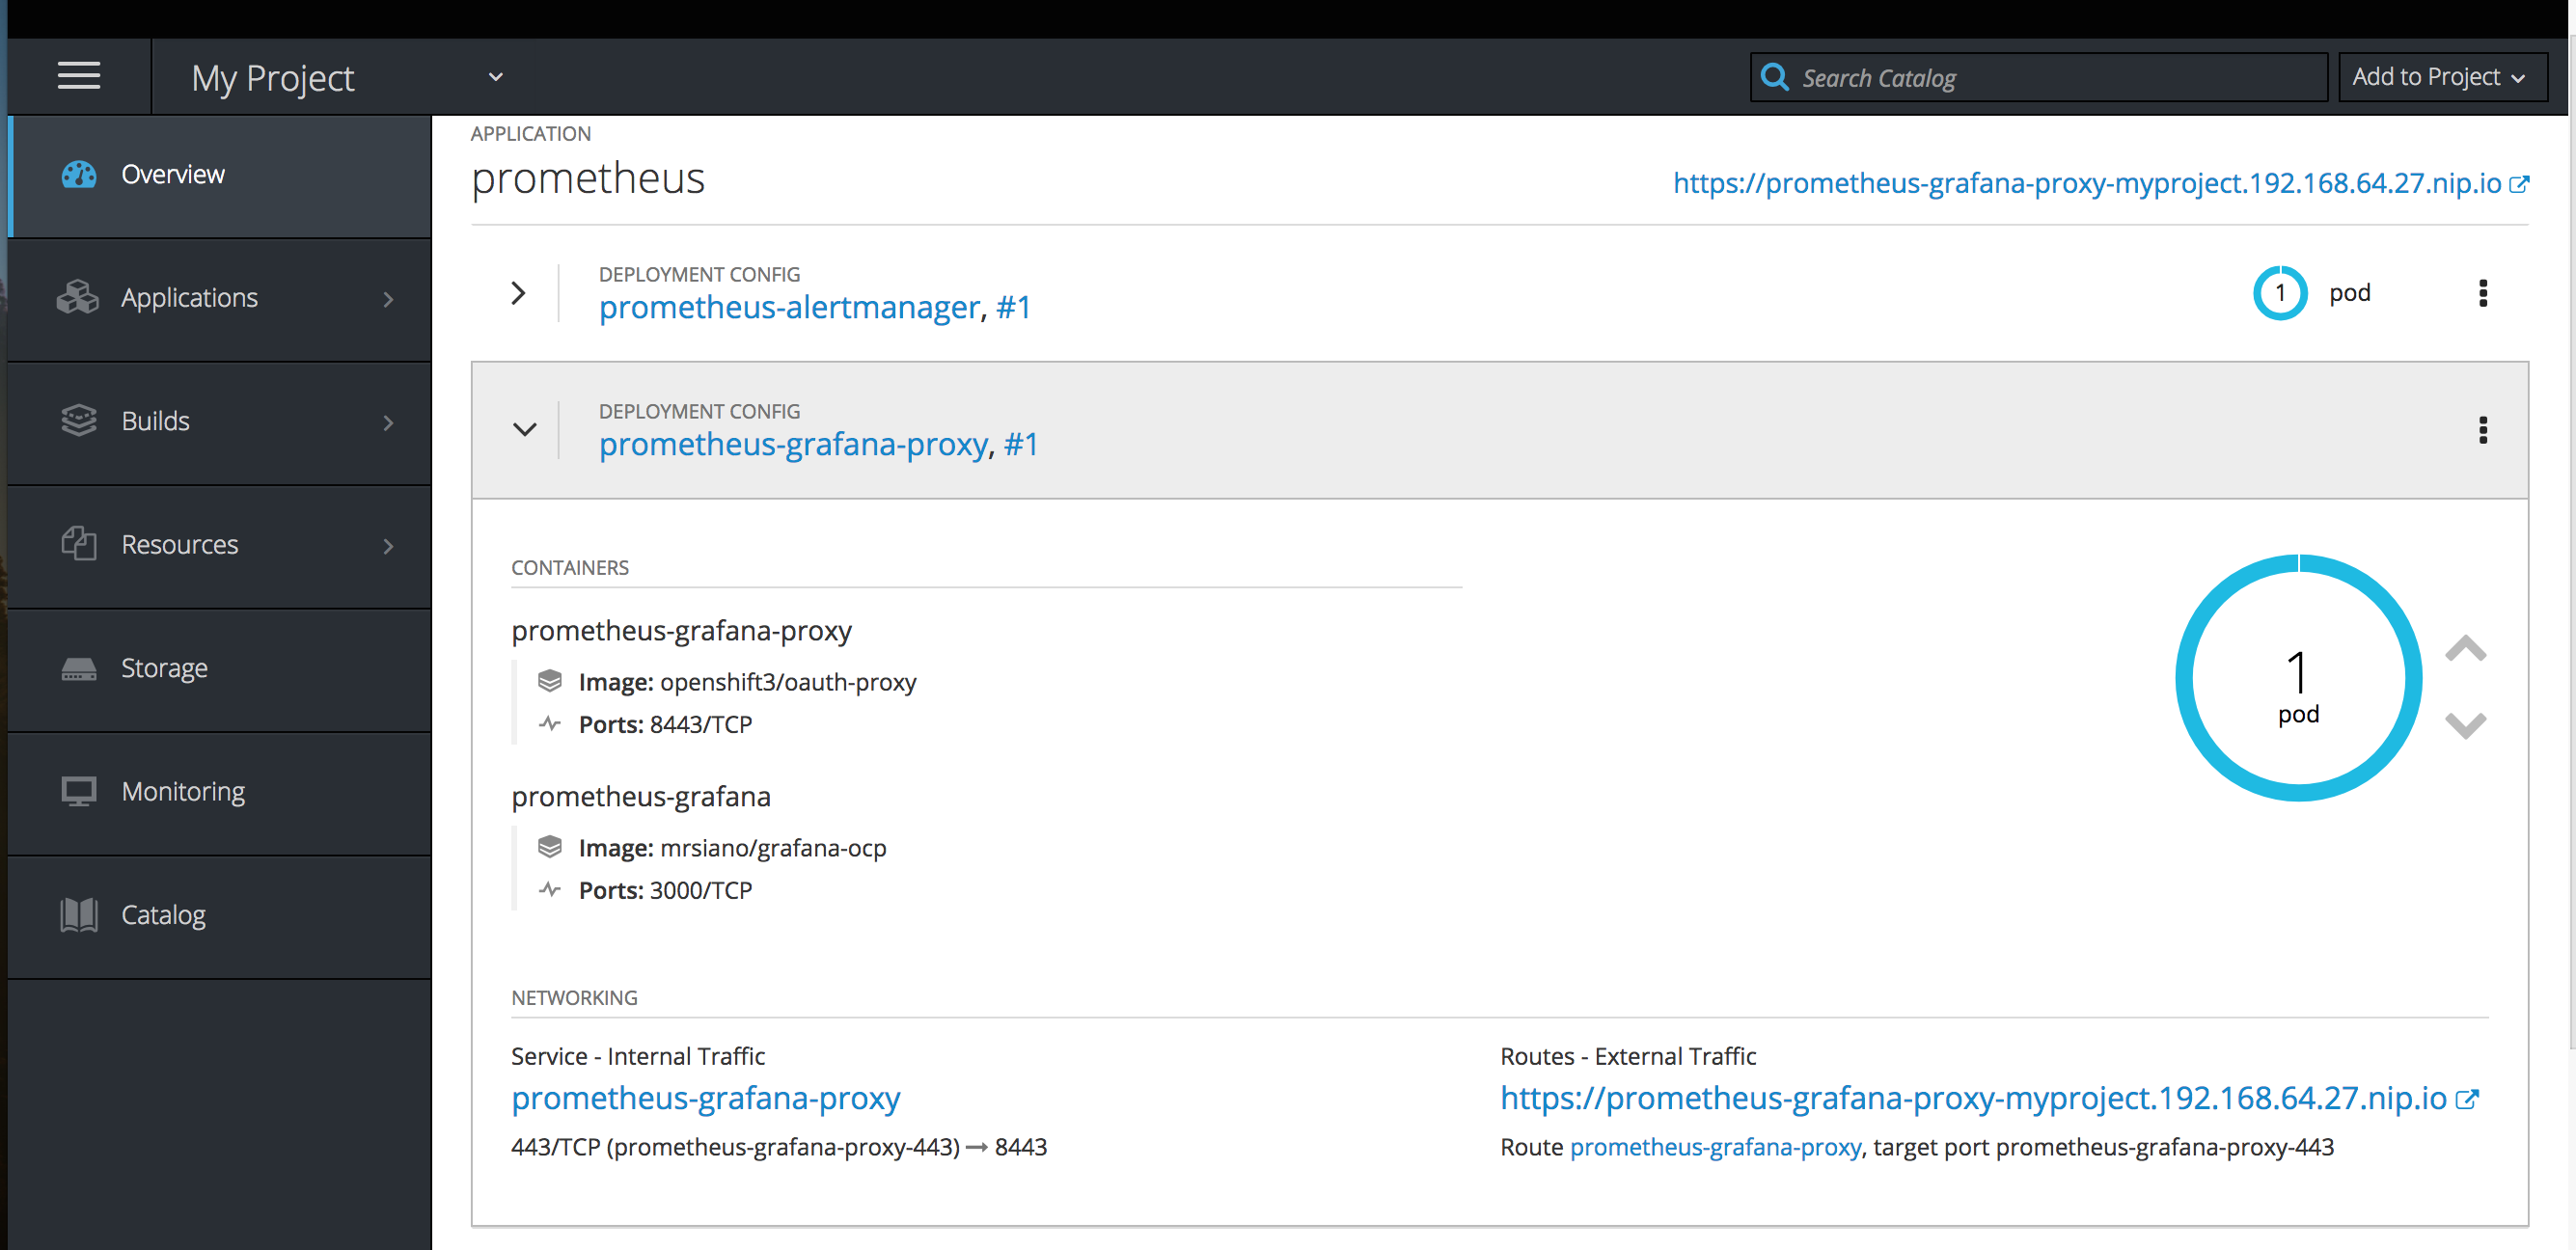
In the project Overview page of the OpenShift console, expand the prometheus-grafana-proxy configuration:
-
Click the provided URL (for example,
https://prometheus-grafana-proxy-myproject.192.168.64.27.nip.io/`) - If you selected the Deploy Prometheus with Oauth-Proxy sidecar option, you must login using your OpenShift user name and password (for example, developer/developer).
In the Authorize Access page, leave the user:info and user:check-access options checked and click Allow selected permissions.
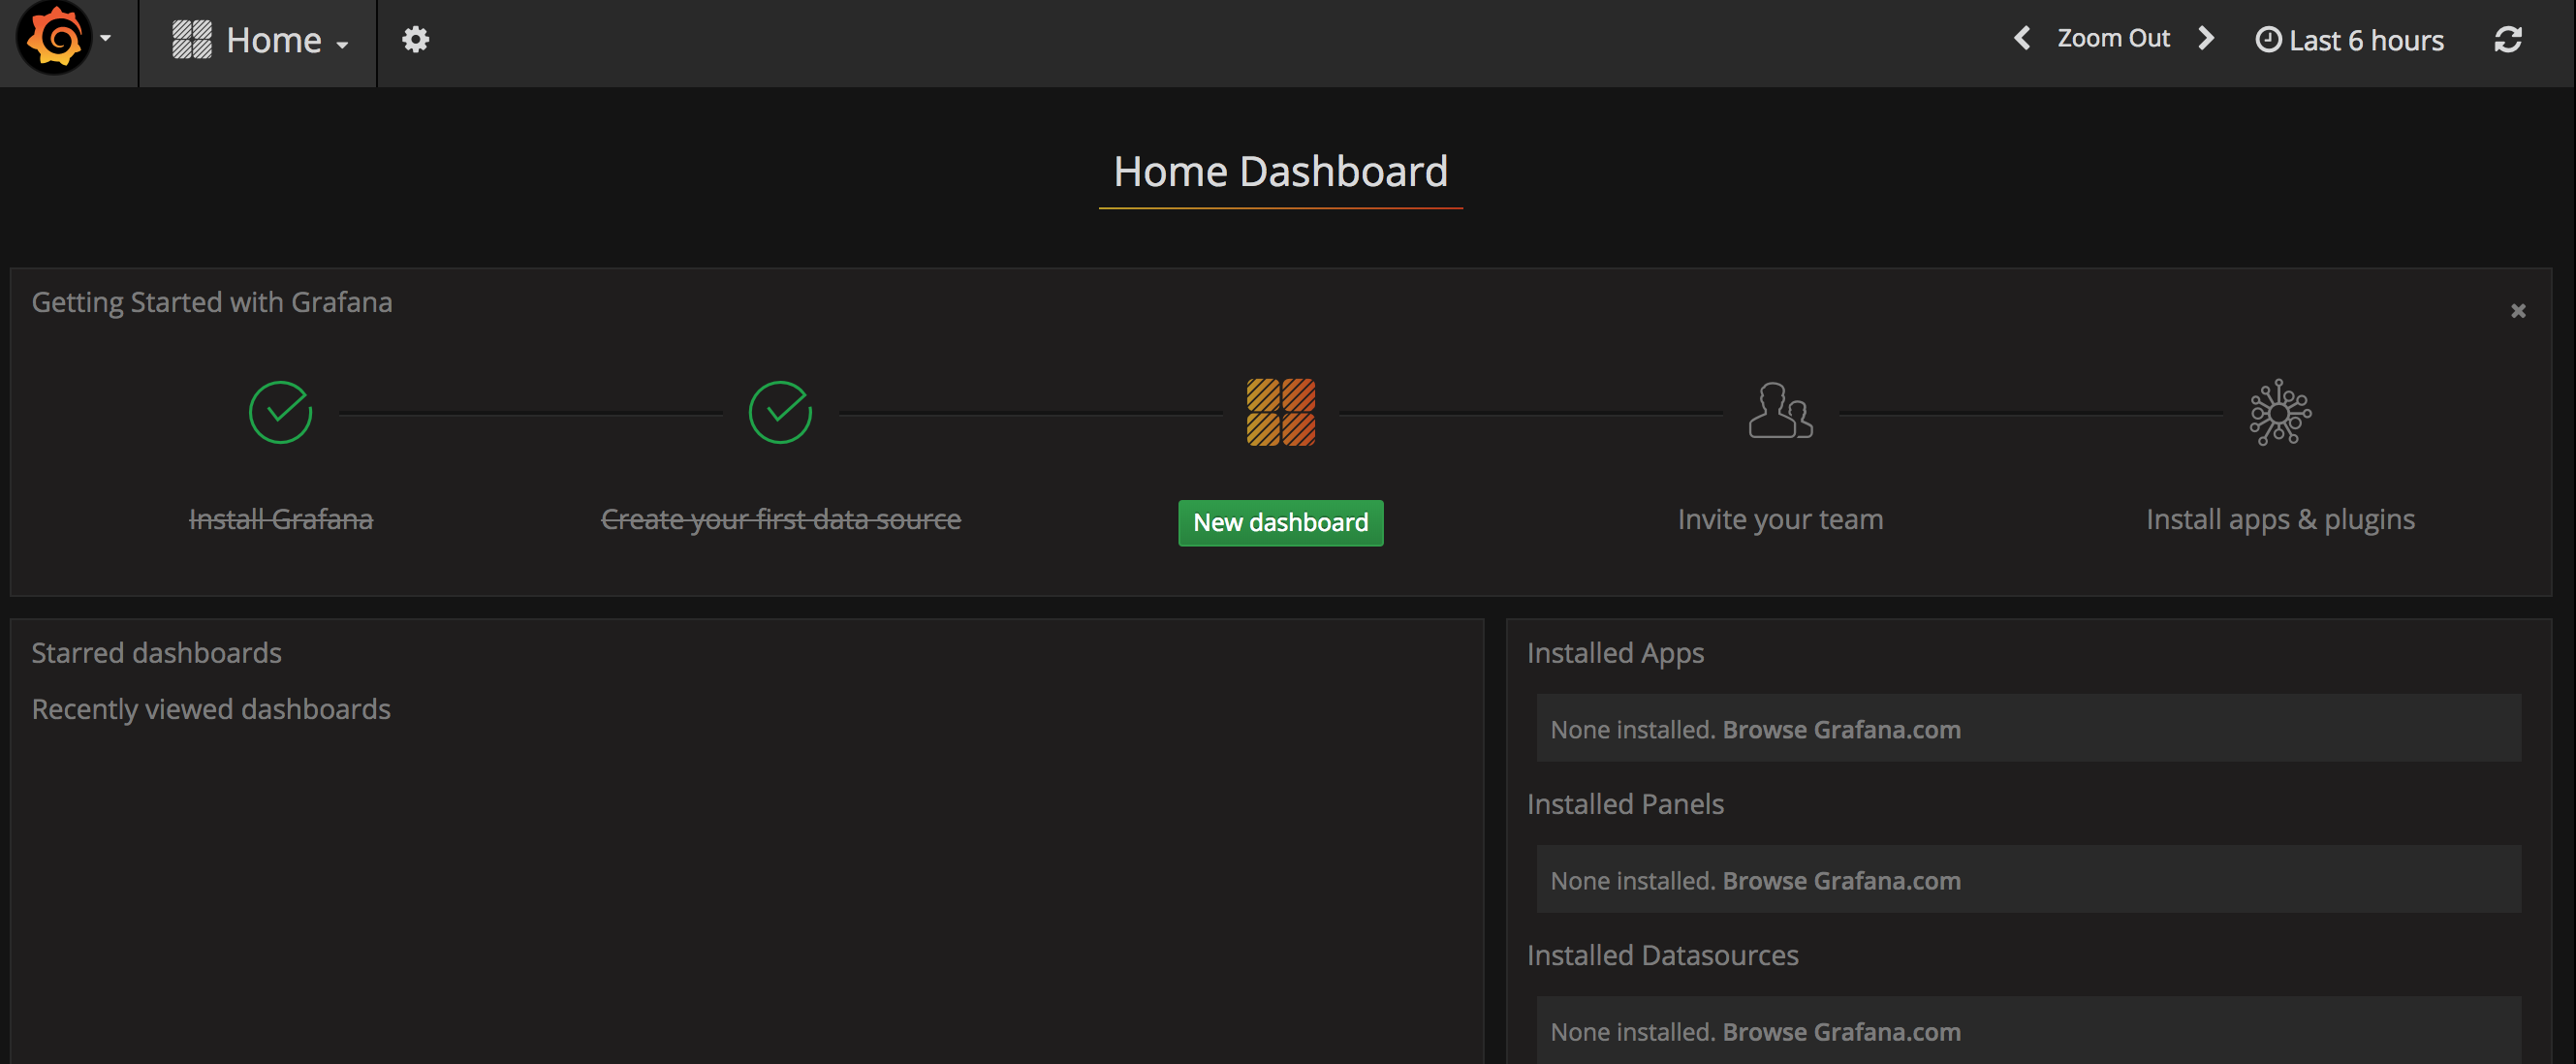
The Grafana Home Dashboard appears:
For information about getting started with Prometheus and Grafana, go to: https://prometheus.io/docs/prometheus/latest/getting_started/
14.2. Configuring Prometheus
You can set the following environment variables in OpenShift in order to configure your application’s Prometheus agent:
| Environment Variable | Description | Default |
|---|---|---|
|
| The host address to bind. |
|
|
| If set, disables the activation of Prometheus (echoes an empty value). | Prometheus is enabled. |
|
| The Port to use. |
|
|
| Uses the file (including path) as the Prometheus configuration file. | The /opt/prometheus/prometheus-config.yml file with Camel metrics |
|
| Additional options to append to the JMX exporter configuration. | Not applicable. |
14.3. Controlling the metrics that Prometheus monitors and collects
By default, Prometheus uses a configuration file ( https://raw.githubusercontent.com/jboss-fuse/application-templates/master/prometheus/prometheus-config.yml) that includes all possible metrics exposed by Camel.
If you have custom metrics within your application that you want Prometheus to monitor and collect (for example, the number of orders that your application processes), you can use your own configuration file. Note that the metrics that you can identify are limited to those supplied in JMX.
To use a custom configuration file to expose JMX beans that are not covered by the default configuration, follow these steps:
Create a custom Prometheus configuration file. You can use the contents of the default file (
prometheus-config.ymlhttps://raw.githubusercontent.com/jboss-fuse/application-templates/master/prometheus/prometheus-config.yml) as a guide for the format.You can use any name for the custom configuration file, for example:
my-prometheus-config.yml-
Add your prometheus configuration file (for example,
my-prometheus-config.yml) to your application’ssrc/main/fabric8-includesdirectory. Create a
src/main/fabric8/deployment.xmlfile within your application and add an entry for the AB_JMX_EXPORTER_CONFIG environment variable with its value set to your configuration file. For example:Copy to Clipboard Copied! Toggle word wrap Toggle overflow This environment variable applies to your application at the pod level.
- Rebuild and deploy your application.
14.4. Generating alerts
For an example of using Prometheus for OpenShift to generate alerts, see the Red Hat Cloud Forms Monitoring, Alerts, and Reporting guide: