이 콘텐츠는 선택한 언어로 제공되지 않습니다.
6.10. Monitoring —
If you click the Monitoring tab on the top navigation bar, the Monitoring category and links appear. These pages, which require Monitoring entitlements, enable you to view the results of probes you have set to run against Monitoring-entitled systems and manage the configuration of your monitoring infrastructure.
Initiate monitoring of a system through the Probes tab of the System Details page. Refer to Section 6.4.2.9, “System Details” for a description of the tab. See Appendix C, Probes for the complete list of available probes.
6.10.1. Probe Status —
링크 복사링크가 클립보드에 복사되었습니다!
As shown in Figure 6.21, “Probe Status”,the Probe Status page is shown by default when you click Monitoring in the top navigation bar.
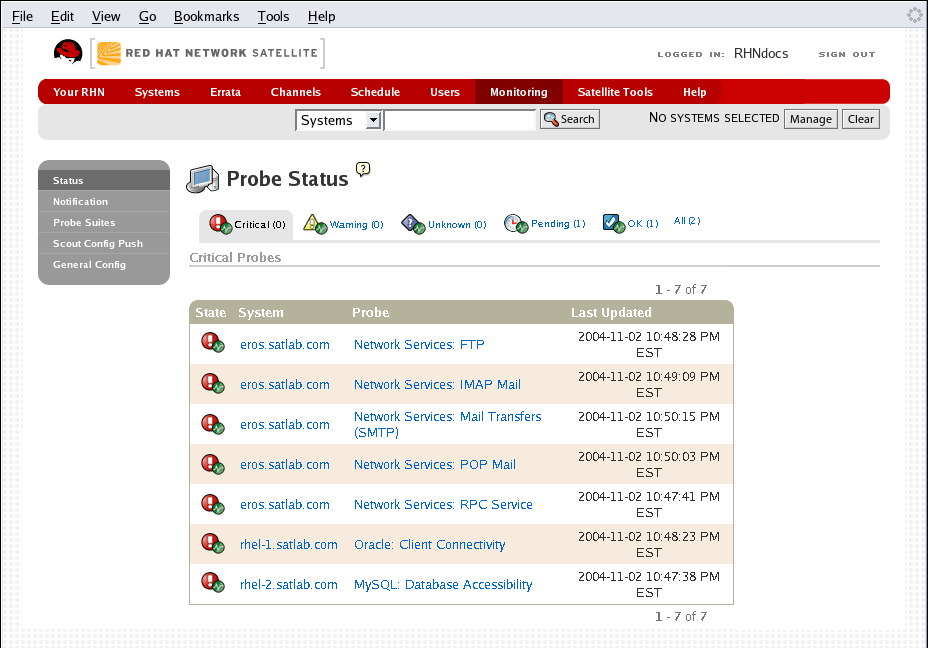
Figure 6.21. Probe Status
The Probe Status page displays the summary count of probes in the various states and provides a simple interface to find problematic probes quickly. Please note that the probe totals in the tabs at the top of the page may not match the numbers of probes displayed in the tables below. The counts at the top include probes for all systems in your organization, while the tables display probes on only those systems to which you have access through the System Group Administrator role. Also, the probe counts displayed here may be out of sync by as much as one minute.
The following list describes each state and identifies the icons associated with them:
 — Critical - The probe has crossed a CRITICAL threshold.
 — Warning - The probe has crossed a WARNING threshold.
 — Unknown - The probe is not able to accurately report metric or state data.
 — Pending - The probe has been scheduled but has not yet run or is unable to run.
 — OK - The probe is running successfully.
The Probe Status page contains tabs for each of the possible states, as well as one that lists all probes. Each table contains columns indicating probe state, the monitored system, the probes used, and the date and time the status was last updated.
In these tables, clicking the name of the system takes you to the Probes tab of the System Details page. Clicking the name of the probe takes you to its Current State page. From there, you may edit the probe, delete it, and generate reports based upon its results.
Monitoring data and probe status information that was previously availble only through the web interface of the Satellite can now be exported as a CSV file. Click on the Download CSV links throughout the Monitoring pages to download CSV files of relevent information. The exported data may include, but is not limited to:
- Probe status
- All probes in a given state (OK, WARN, UNKNOWN, CRITICAL, PENDING)
- A Probe Event history
6.10.1.1. Probe Status ⇒ Critical —
링크 복사링크가 클립보드에 복사되었습니다!
The probes that have crossed their CRITICAL thresholds or reached a critical status by some other means. For instance, some probes become critical (rather than unknown) when exceeding their timeout period.
6.10.1.2. Probe Status ⇒ Warning —
링크 복사링크가 클립보드에 복사되었습니다!
The probes that have crossed their WARNING thresholds.
6.10.1.3. Probe Status ⇒ Unknown —
링크 복사링크가 클립보드에 복사되었습니다!
The probes that cannot collect the metrics needed to determine probe state. Most but not all probes enter an unknown state when exceeding their timeout period. This may mean that the timeout period should be increased, or the connection cannot be established to the monitored system.
It is also possible the probes' configuration parameters are not correct and their data cannot be found. Finally, this state may indicate that a software error has occurred.
6.10.1.4. Probe Status ⇒ Pending —
링크 복사링크가 클립보드에 복사되었습니다!
The probes whose data have not been received by RHN. This state is expected for a probe that has just been scheduled but has not yet run. If all probes go into a pending state, your monitoring infrastructure may be failing.
6.10.1.5. Probe Status ⇒ OK —
링크 복사링크가 클립보드에 복사되었습니다!
The probes that have run successfully without exception. This is the state desired for all probes.
6.10.1.6. Probe Status ⇒ All —
링크 복사링크가 클립보드에 복사되었습니다!
All probes scheduled on systems in your account, listed in alphabetical order by the name of system.
6.10.1.7. Current State —
링크 복사링크가 클립보드에 복사되었습니다!
Identifies the selected probe's status and when it last ran, while providing the ability to generate a report on the probe. Although this page is integral to monitoring, it is found under the Probes tab within the System Details page since its configuration is specific to the system being monitored.
To view a report of the probe's results, choose a relevant duration using the date fields and decide whether you would like to see metric data, the state change history or both. To obtain metric data, select the metric(s) on which you wish to see a report, and decide (using the checkboxes) whether the results should be shown in a graph, an event log, or both. Then click at the bottom of the page. If no data exist for the probe's metrics, you are presented with the following message:
NO DATA SELECTED TIME PERIOD AND METRIC.