Este conteúdo não está disponível no idioma selecionado.
Chapter 8. Troubleshooting problems by using log files
Log files contain messages about the system, including the kernel, services, and applications running on it. These contain information that helps troubleshoot issues or monitor system functions. The logging system in Red Hat Enterprise Linux is based on the built-in syslog protocol. Particular programs use this system to record events and organize them into log files, which are useful when auditing the operating system and troubleshooting various problems.
8.1. Services handling syslog messages
The following two services handle syslog messages:
-
The
systemd-journalddaemon -
The
Rsyslogservice
The systemd-journald daemon collects messages from various sources and forwards them to Rsyslog for further processing. The systemd-journald daemon collects messages from the following sources:
- Kernel
- Early stages of the boot process
- Standard and error output of daemons as they start up and run
-
Syslog
The Rsyslog service sorts the syslog messages by type and priority and writes them to the files in the /var/log directory. The /var/log directory persistently stores the log messages.
8.2. Subdirectories storing syslog messages
The following subdirectories under the /var/log directory store syslog messages.
-
/var/log/messages- allsyslogmessages except the following -
/var/log/secure- security and authentication-related messages and errors -
/var/log/maillog- mail server-related messages and errors -
/var/log/cron- log files related to periodically executed tasks -
/var/log/boot.log- log files related to system startup
8.3. Viewing logs using the command line
The Journal is a component of systemd that helps to view and manage log files. It addresses problems connected with traditional logging, closely integrated with the rest of the system, and supports various logging technologies and access management for the log files.
You can use the journalctl command to view messages in the system journal using the command line, for example:
$ journalctl -b | grep kvm
May 15 11:31:41 localhost.localdomain kernel: kvm-clock: Using msrs 4b564d01 and 4b564d00
May 15 11:31:41 localhost.localdomain kernel: kvm-clock: cpu 0, msr 76401001, primary cpu clock
...| Command | Description |
|---|---|
|
| Shows all collected journal entries. |
|
|
Shows logs related to a specific file. For example, the |
|
| Shows logs for the current boot. |
|
| Shows kernel logs for the current boot. |
| Command | Description |
|---|---|
|
|
Filters log to show entries matching the |
|
|
Combines matches. For example, this command shows logs for |
|
|
The plus sign (+) separator combines two expressions in a logical OR. For example, this command shows all messages from the |
|
|
This command shows all entries matching either expression, referring to the same field. Here, this command shows logs matching a systemd-unit |
| Command | Description |
|---|---|
|
| Shows a tabular list of boot numbers, their IDs, and the timestamps of the first and last message pertaining to the boot. You can use the ID in the next command to view detailed information. |
|
| Shows information about the specified boot ID. |
8.4. Reviewing logs in the web console
Learn how to access, review and filter logs in the RHEL web console.
8.4.1. Reviewing logs in the web console
The RHEL 9 web console Logs section is a UI for the journalctl utility. You can access system logs in the web console interface.
Prerequisites
You have installed the RHEL 9 web console.
For instructions, see Installing and enabling the web console.
Procedure
Log in to the RHEL 9 web console.
For details, see Logging in to the web console.
Click Logs.
- Open log entry details by clicking on your selected log entry in the list.
You can use the button to pause new log entries from appearing. Once you resume new log entries, the web console will load all log entries that were reported after you used the button.
You can filter the logs by time, priority or identifier. For more information, see Filtering logs in the web console.
8.4.2. Filtering logs in the web console
You can filter log entries in the web console.
Prerequisites
You have installed the RHEL 9 web console.
For instructions, see Installing and enabling the web console.
Procedure
Log in to the RHEL 9 web console.
For details, see Logging in to the web console.
- Click Logs.
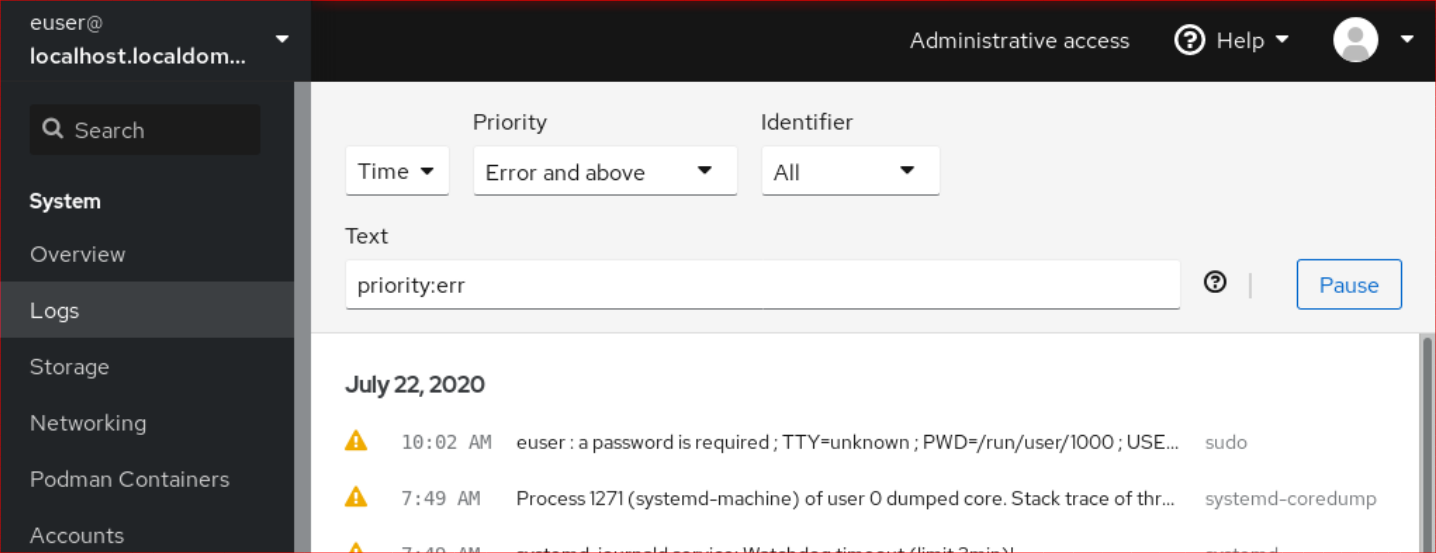
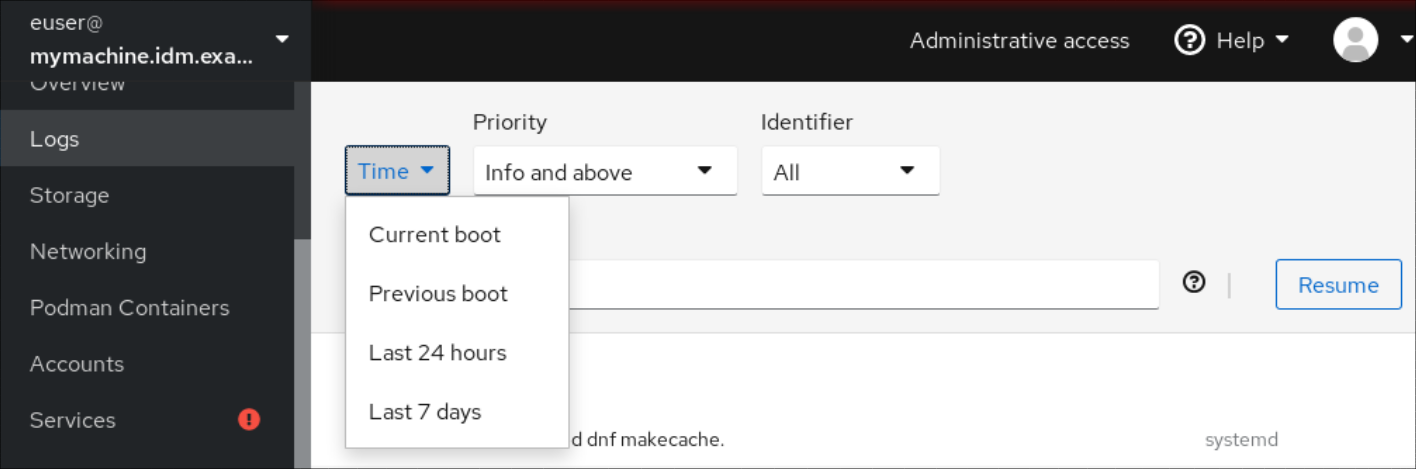
By default, web console shows the latest log entries. To filter by a specific time range, click the Time drop-down menu and choose a preferred option.
Error and above severity logs list is shown by default. To filter by different priority, click the Error and above drop-down menu and choose a preferred priority.

By default, web console shows logs for all identifiers. To filter logs for a particular identifier, click the All drop-down menu and select an identifier.

- To open a log entry, click on a selected log.
8.4.3. Text search options for filtering logs in the web console
The text search option functionality provides a big variety of options for filtering logs. If you decide to filter logs by using the text search, you can use the predefined options that are defined in the three drop-down menus, or you can type the whole search yourself.
Drop-down menus
There are three drop-down menus that you can use to specify the main parameters of your search:
- Time: This drop-down menu contains predefined searches for different time ranges of your search.
-
Priority: This drop-down menu provides options for different priority levels. It corresponds to the
journalctl --priorityoption. The default priority value is Error and above. It is set every time you do not specify any other priority. -
Identifier: In this drop-down menu, you can select an identifier that you want to filter. Corresponds to the
journalctl --identifieroption.
Quantifiers
There are six quantifiers that you can use to specify your search. They are covered in the Options for filtering logs table.
Log fields
If you want to search for a specific log field, it is possible to specify the field together with its content.
Free-form text search in logs messages
You can filter any text string of your choice in the logs messages. The string can also be in the form of a regular expressions.
Advanced logs filtering I
Filter all log messages identified by 'systemd' that happened since October 22, 2020 midnight and journal field 'JOB_TYPE' is either 'start' or 'restart.
-
Type
identifier:systemd since:2020-10-22 JOB_TYPE=start,restartto search field. Check the results.

Advanced logs filtering II
Filter all log messages that come from 'cockpit.service' systemd unit that happened in the boot before last and the message body contains either "error" or "fail".
-
Type
service:cockpit boot:-1 error|failto the search field. Check the results.

8.4.4. Using a text search box to filter logs in the web console
You can filter logs according to different parameters by using the text search box in the web console. The search combines usage of the filtering drop-down menus, quantifiers, log fields, and free-form string search.
Prerequisites
You have installed the RHEL 9 web console.
For instructions, see Installing and enabling the web console.
Procedure
Log in to the RHEL web console.
For details, see Logging in to the web console.
- Click Logs.
Use the drop-down menus to specify the three main quantifiers - time range, priority, and identifier(s) - you want to filter.
The Priority quantifier always has to have a value. If you do not specify it, it automatically filters the Error and above priority. Notice that the options you set reflect in the text search box.
Specify the log field you want to filter.
You can add several log fields.
- You can use a free-form string to search for anything else. The search box also accepts regular expressions.
8.4.5. Options for logs filtering
There are several journalctl options, which you can use for filtering logs in the web console, that may be useful. Some of these are already covered as part of the drop-down menus in the web console interface.
| Option name | Usage | Notes |
|---|---|---|
|
| Filter output by message priorities. Takes a single numeric or textual log level. The log levels are the usual syslog log levels. If a single log level is specified, all messages with this log level or a lower (therefore more important) log level are shown. | Covered in the Priority drop-down menu. |
|
| Show messages for the specified syslog identifier SYSLOG_IDENTIFIER. Can be specified multiple times. | Covered in the Identifier drop-down menu. |
|
| Shows only the most recent journal entries, and continuously prints new entries as they are appended to the journal. | Not covered in a drop-down. |
|
|
Show messages for the specified |
Is not covered in a drop-down. Corresponds to the |
|
| Show messages from a specific boot. A positive integer will look up the boots starting from the beginning of the journal, and an equal-or-less-than zero integer will look up boots starting from the end of the journal. Therefore, 1 means the first boot found in the journal in chronological order, 2 the second and so on; while -0 is the last boot, -1 the boot before last, and so on. | Covered only as Current boot or Previous boot in the Time drop-down menu. Other options need to be written manually. |
|
| Start showing entries on or newer than the specified date, or on or older than the specified date, respectively. Date specifications should be of the format "2012-10-30 18:17:16". If the time part is omitted, "00:00:00" is assumed. If only the seconds component is omitted, ":00" is assumed. If the date component is omitted, the current day is assumed. Alternatively the strings "yesterday", "today", "tomorrow" are understood, which refer to 00:00:00 of the day before the current day, the current day, or the day after the current day, respectively. "now" refers to the current time. Finally, relative times may be specified, prefixed with "-" or "+", referring to times before or after the current time, respectively. | Not covered in a drop-down. |
8.5. Additional resources
-
journalctl(1)man page on your system - Configuring a remote logging solution