此内容没有您所选择的语言版本。
Chapter 9. Monitoring JBoss EAP 6 Resources
9.1. Runtime Information and JBoss ON Monitoring
复制链接链接已复制到粘贴板!
Metrics are a live-stream of information about how a resource or group of resources are performing. Metrics are vital signs, like the heart rate, blood pressure, and oxygen levels for a hospital patient. For resources, those vital statistics are elements like availability, page hits for database caches, or active connections for datasources or web applications. Those metrics show resource health, observed at a specific moment.
The JBoss EAP 6 console shows that current and immediate snapshot of information for a handful of critical metrics for a few critical resources, like datasources, transactions, and web applications.
This changing information is displayed in the Runtime tab of the EAP 6 console.
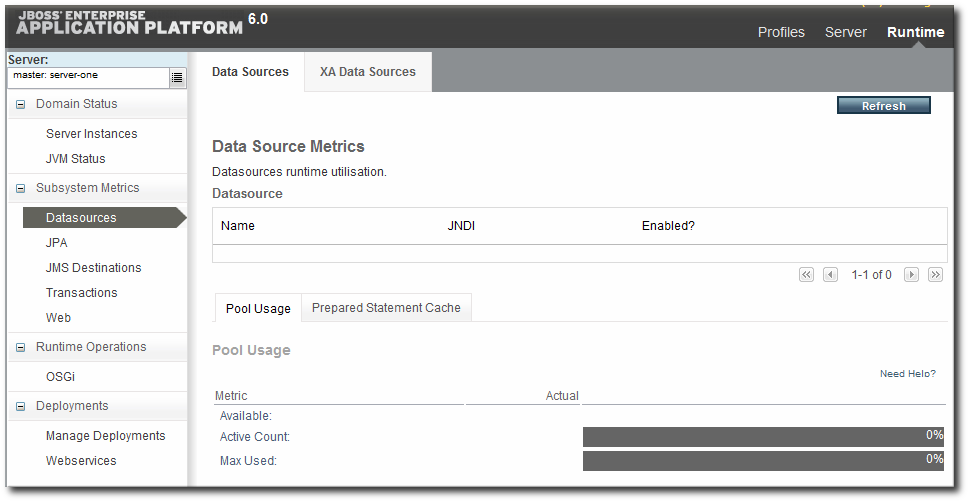
Figure 9.1. EAP 6 Runtime Metrics
Runtime information shows the health for that exact moment in time.
Looking at the runtime information over time gives a much better perspective of how a resource is performing, generally. Every resource in JBoss ON has areas to view and configure monitoring and to configure alerting based on that monitoring.
JBoss ON automatically processes runtime metrics in a few different ways, to help administrators process performance data:
- Time-based monitoring graphs for each metric
- Operating parameters, or baselines calculated on the real performance of the resource
- Availability uptime percentages, recovery times, and mean down time
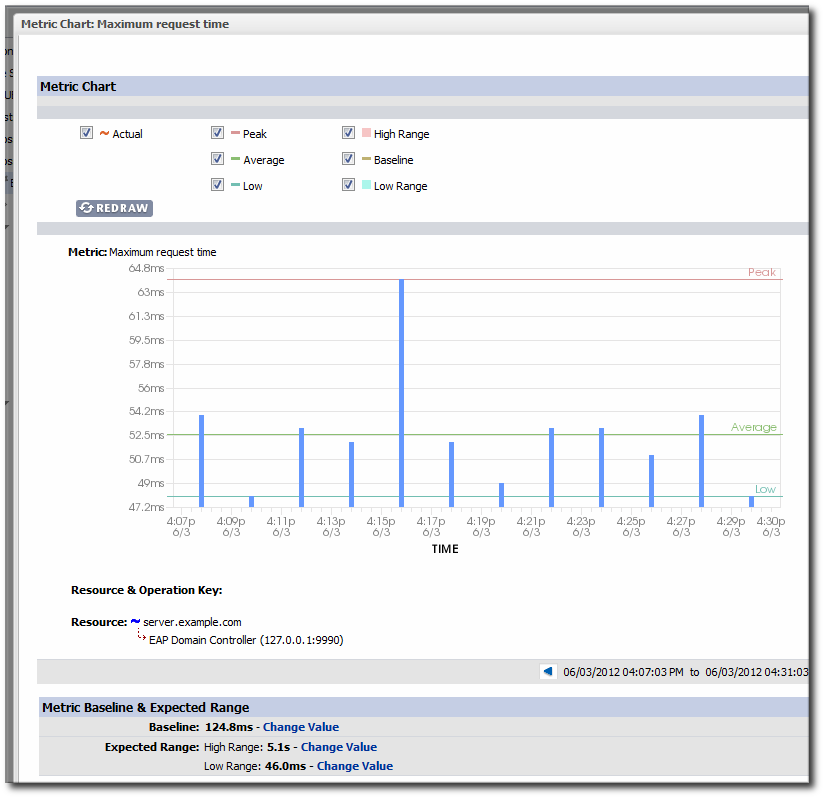
Figure 9.2. JBoss ON Baselines for a Single Metric
JBoss ON also exposes more monitoring data for individual resources through its GUI:
- More metrics are available for resources. At a minimum, every resource has availability monitoring. Some resources — like datasources and managed servers — have dozens more metrics that can be enabled for routine monitoring.
- Response time monitoring can be configured for specific URLs and pages for web applications. This allows administrators to track usability and customer experience for web applications along with internal metrics like connection counts.
- Event log monitoring can filter important messages from different error logs. This allows JBoss ON to respond (through alerts) to issues that may not have crossed a performance threshold yet, and it also makes it possible for administrators to correlate log events with observed performance metrics.