此内容没有您所选择的语言版本。
24.4. Dashboard View
The Dashboard view is split into 3 tabs namely:
- Caches
- Clusters.
- Status Events
24.4.1. Cache Containers View
复制链接链接已复制到粘贴板!
The first default view after logging in is the Cache Container list. A Cache Container is the primary mechanism for treating a cache instance and is used as a starting point for using a cache itself.
Cache centric view presents the list of configured caches. It is used for viewing and adding caches to clusters, adding and adjusting new cache configurations, adding and configuring endpoints and other cache related administrative tasks.
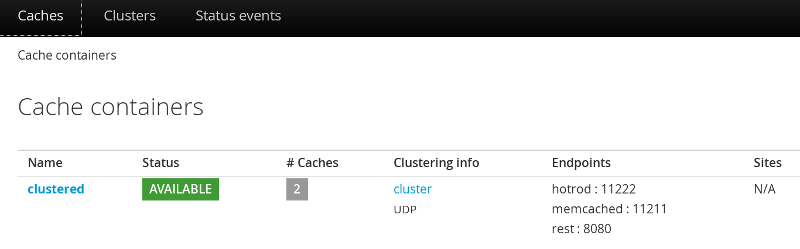
Figure 24.2. Cache Containers View
In this instance, there is one cache container with the name with two caches deployed on the cluster group with UDP transport and three Endpoints attached to it. There are no remote sites configured for this cache container.
24.4.2. Clusters View
复制链接链接已复制到粘贴板!
The Cluster tab presents the summary of the clusters along with the current status, number of hosts and number of nodes.
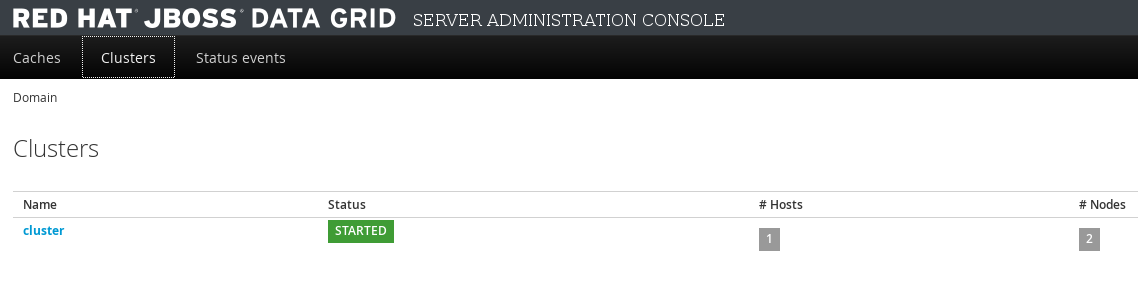
Figure 24.3. Clusters View
24.4.3. Status Events View
复制链接链接已复制到粘贴板!
The JBoss Data Grid Administration Console displays the cluster wide events such as local rebalancing, cluster start and stop, cluster-split and cluster-merge events in a consolidated section. To view the detailed status events, navigate to the Status Events tab from the Dashboard.
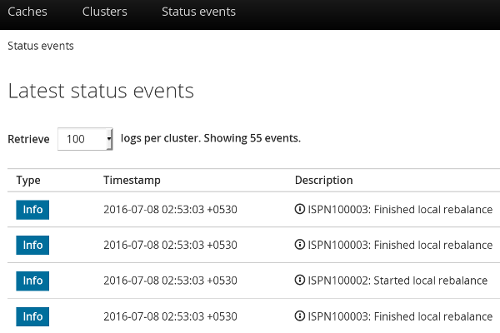
Figure 24.4. Status Events View
The status events are displayed with the associated timestamp and the event description.