此内容没有您所选择的语言版本。
3.3. The Management Console
3.3.1. Management Console
3.3.2. Log in to the Management Console
Prerequisites
- JBoss EAP 6 must be running.
- You must have already created a user with permissions to access the Console.
- Launch your web browser and go to this address: http://localhost:9990/console/App.html
Note
Port 9990 is predefined as the Management Console socket binding. - Enter your username and password to log in to the Management Console.

Figure 3.1. Log in screen for the Management Console
Once logged in, you are redirected to the following address and the Management Console landing page appears: http://localhost:9990/console/App.html#home
3.3.3. Change the Language of the Management Console
Supported Languages
- German (de)
- Simplified Chinese (zh-Hans)
- Brazilian Portuguese (pt-BR)
- French (fr)
- Spanish (es)
- Japanese (ja)
Procedure 3.1. Change the Language of the Web-based Management Console
Log into the Management Console.
Log into the web-based Management Console.Open the Settings dialog.
Near the bottom right of the screen is a Settings label. Click it to open the settings for the Management Console.Select the desired language.
Select the desired language from the Locale selection box. Select Save. A confirmation box informs you that you need to reload the application. Click Confirm. The system refreshes your web browser automatically to use the new locale.
3.3.4. Analytics in JBoss EAP Console
Google Analytics is a free web analytics service which provides comprehensive usage statistics on a website. It provides vital data regarding a site's visitors, including their visits, page views, pages per visit and average time spent on site. Google Analytics provides more visibility around a website's presence and its visitors.
JBoss EAP 6 provides users the option to enable or disable Google Analytics in the management console. The Google Analytics feature aims to help Red Hat EAP team understand how the customers are using the console and which parts of the console matter the most to the customers. This information will in-turn help the team adapt the console design, features and content to the immediate needs of the customers.
Note
3.3.5. Enable Google Analytics in JBoss EAP Console
- Log in to the Management Console
- Click on the Management Console
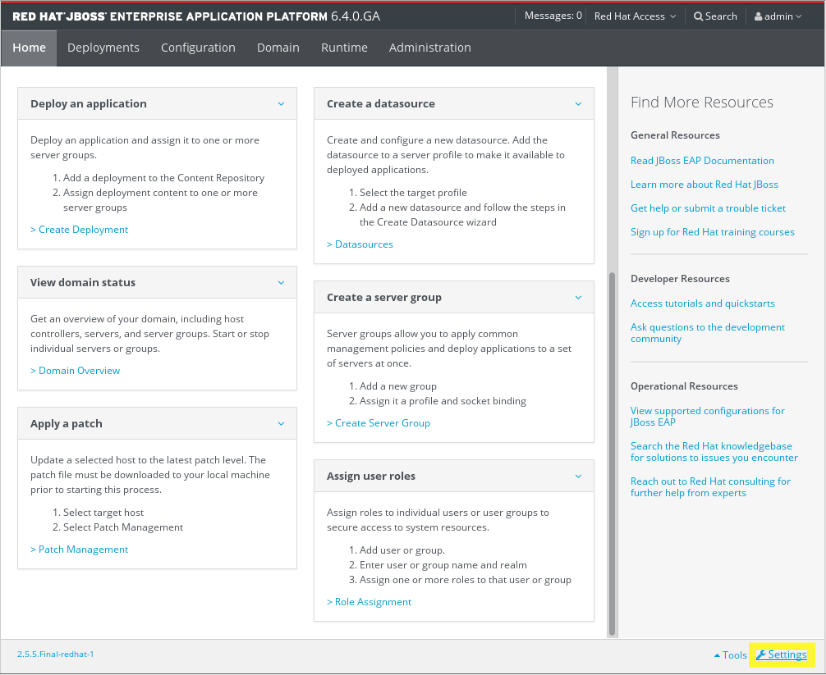
Figure 3.2. Log in screen of the Management Console
- Select checkbox on the
Settingsdialog and click button. Confirm the application reload to activate the new settings.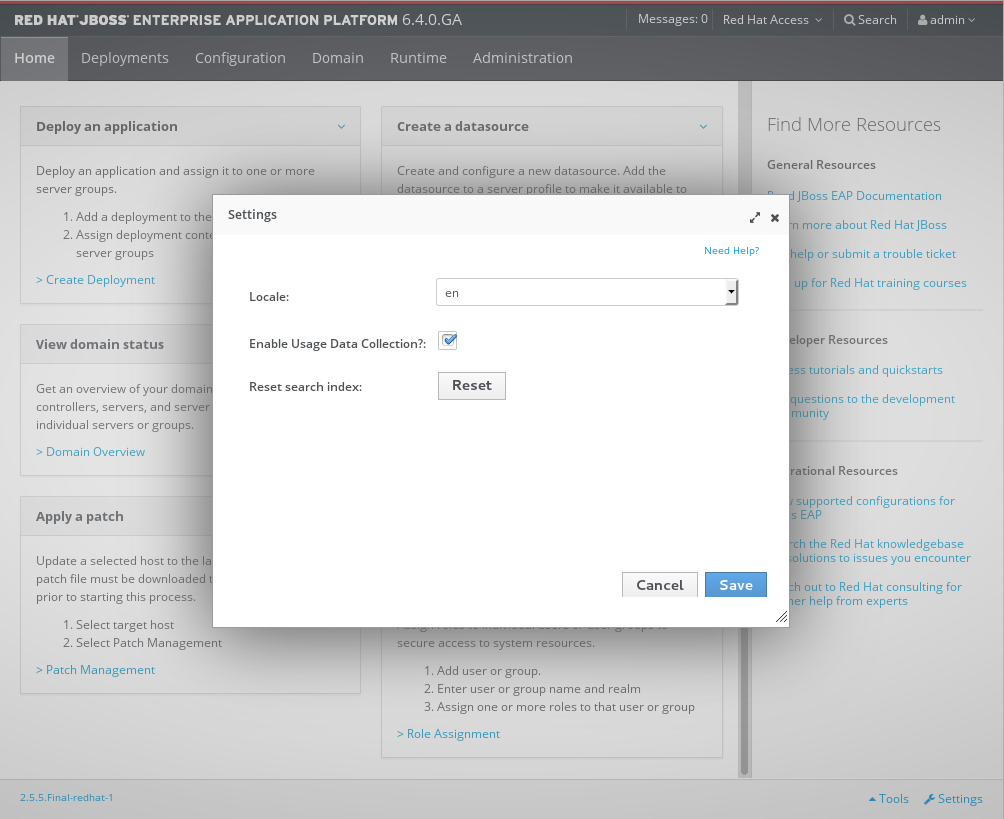
Figure 3.3. Settings dialog (Enable Usage Data Collection)
3.3.6. Disable Google Analytics in JBoss EAP Console
- Log in to the Management Console
- Click on the Management Console
Figure 3.4. Log in screen of the Management Console
- Uncheck the option on the
Settingsdialog to remove the selection. Click button. Confirm the application reload to activate the new settings.
Figure 3.5. Settings dialog (Disable Usage Data Collection)
3.3.7. Configure a Server Using the Management Console
Prerequisites
Procedure 3.2. Configure the Server
- Select the Domain tab from the top of the console. Available server instances will be displayed in a table.
- Click Server Configurations.The Server Configurations panel for the relevant host appears.
- Select the server instance from the Available Server Configurations table.
- Click above the details of the chosen server.
- Make changes to the configuration attributes.
- Click to finish.
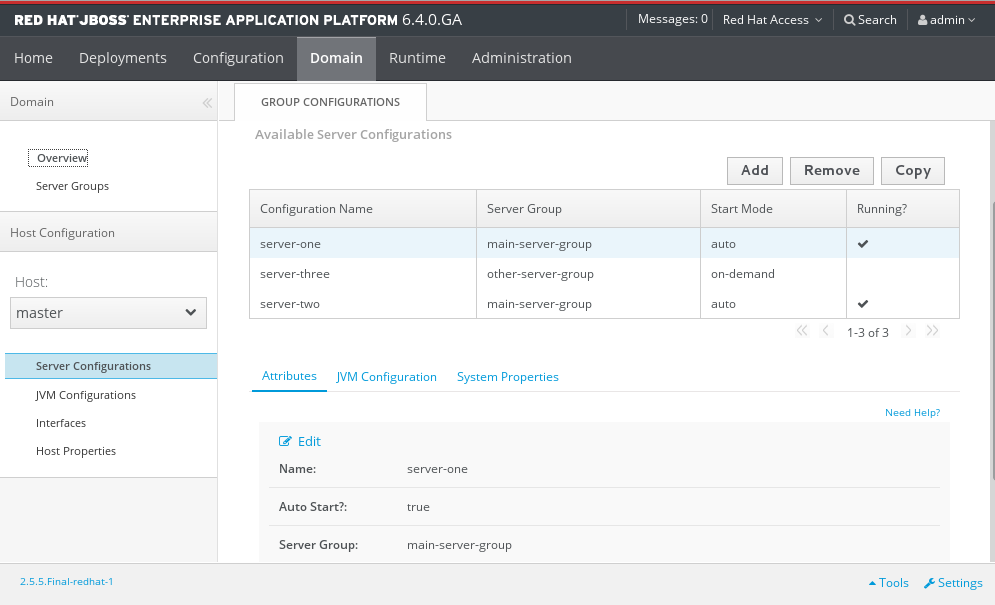
Figure 3.6. Server configuration
The server configuration is changed, and will take effect next time the server restarts.
3.3.8. Add a Deployment in the Management Console
Prerequisites
- Select the Deployments tab at the top of the console.
- Select on the Content Repository tab. A Create Deployment dialog box appears.
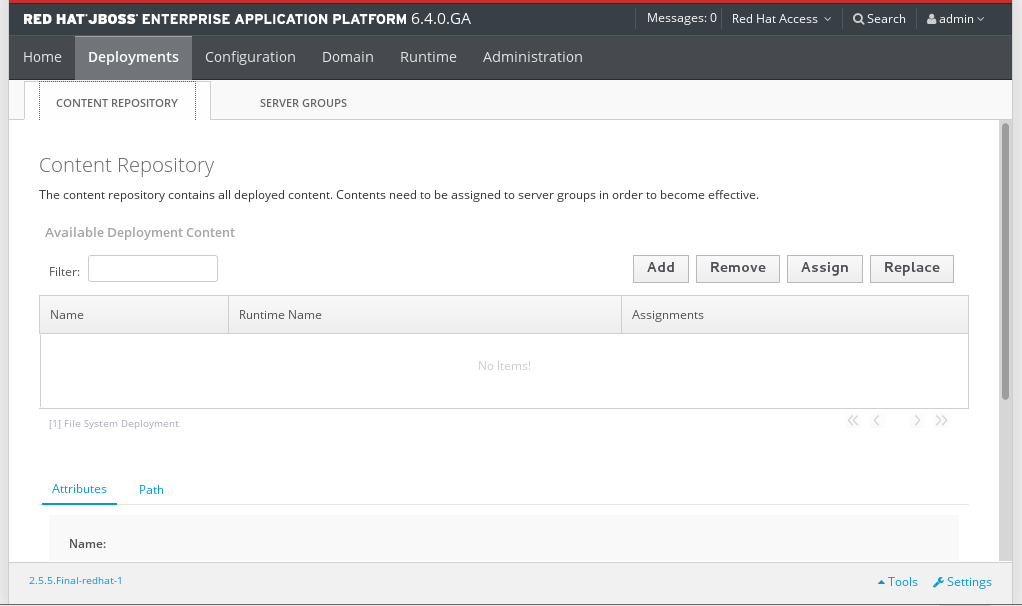
Figure 3.7. Manage standalone deployments
- In the dialog box, click . Browse to the file you want to deploy, select it and upload it. Click to proceed.
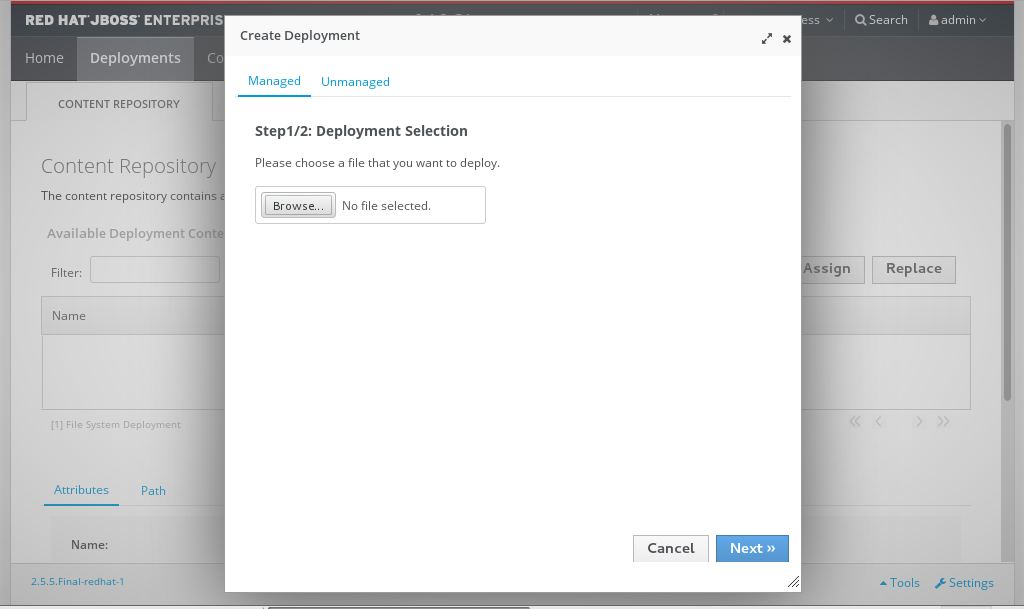
Figure 3.8. Deployment selection
- Verify the deployment name and runtime name that appear in the Create Deployments dialog box. Click to upload the file once the names are verified.
The selected content is uploaded to the server and is now ready for deployment.
3.3.9. Create a New Server in the Management Console
Prerequisites
Procedure 3.3. Create a New Server Configuration
Navigate to the Server Configurations page in the Management Console
Select the Domain tab from the top of the console.
Figure 3.9. Server Configuration
- Click Server Configurations in the left menu.
Create a new configuration
- Select the button above the Available Server Configurations table.
- Enter the basic server settings in the Create Server Configuration dialog.
- Select the button to save the new Server Configuration.
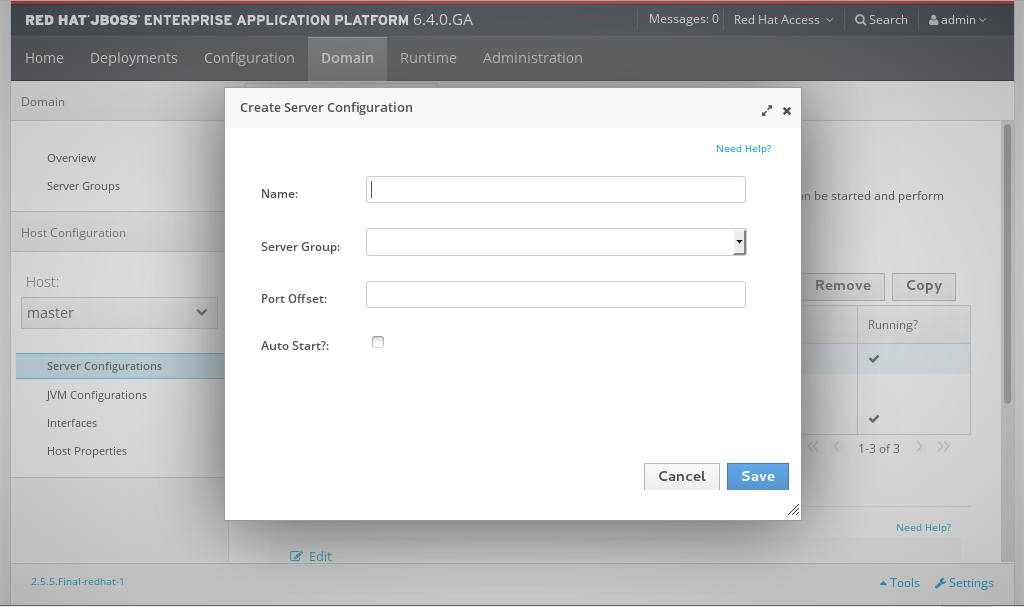
Figure 3.10. Create a new configuration
Procedure 3.4. Edit the Logging Levels
Navigate to the Logging panel in the Management Console
- If you are working with a managed domain, select the Configuration tab at the top of the console, then select the relevant profile from the drop-down list on the left of the console.
- For either a managed domain or a standalone server, expand the menu from the list on the left of the console and click the Logging entry.
- Click on the Log Categories tab in the top of the console.
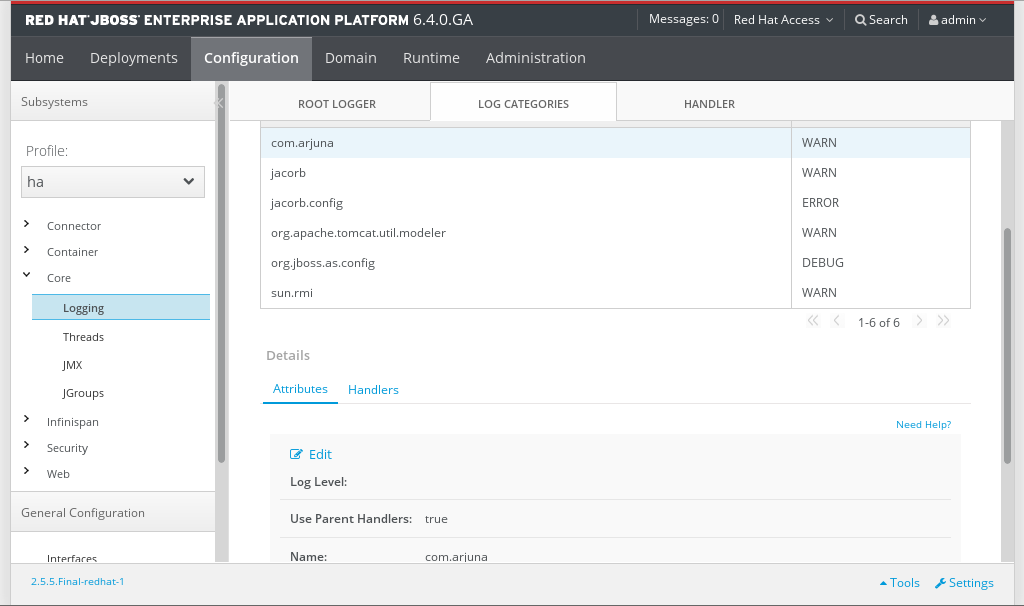
Figure 3.11. Logging panel
Edit logger details
Edit the details for any of the entries in the Log Categories table.- Select an entry in the Log Categories table, then click in the Details section below.
- Set the log level for the category with the Log Level drop-down box. Click the button when done.
The log levels for the relevant categories are now updated.
Prerequisites
Procedure 3.5. Configure and Add a new Server Group
Navigate to the Server Groups view
Select the Domain tab from the top of the console.- Select Server Groups in the left hand column.
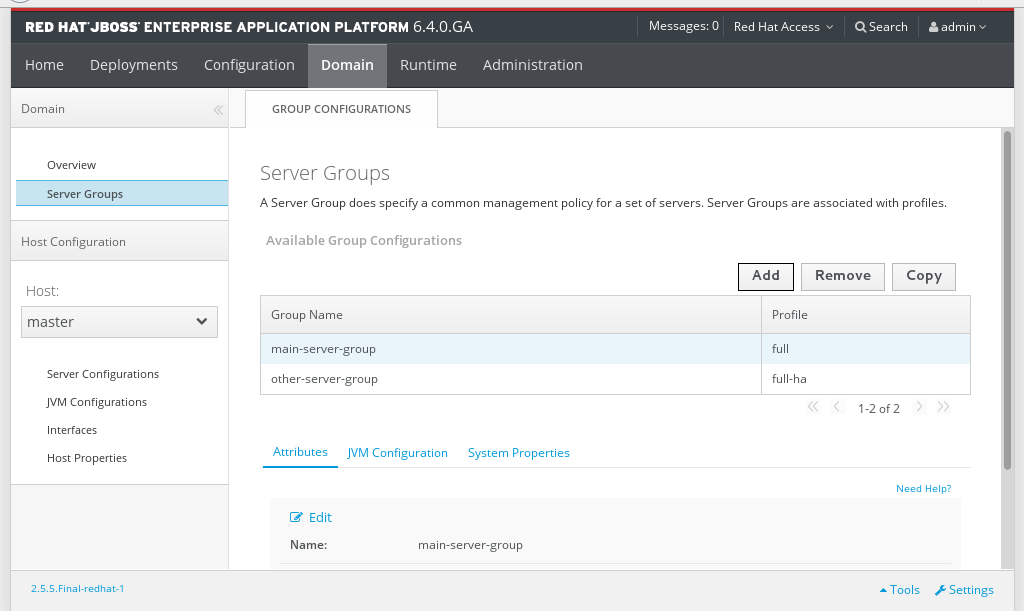
Figure 3.12. The Server Groups view
Add a server group
Click the button to add a new server group.Configure the server group
- Enter a name for the server group.
- Select the profile for the server group.
- Select the socket binding for the server group.
- Click the Save button to save your new group.
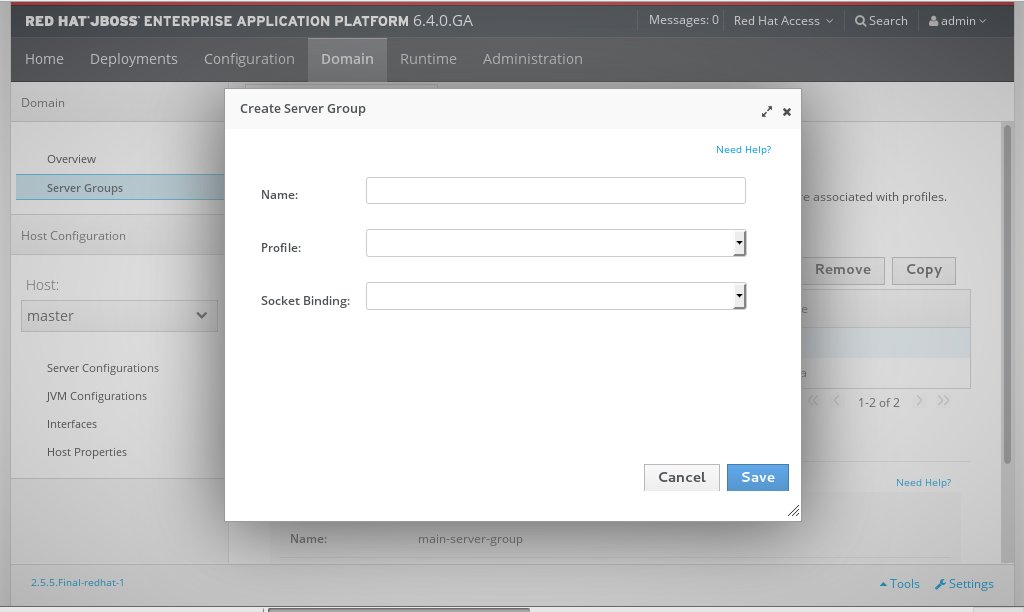
Figure 3.13. The Create Server Group dialog
The new server group is visible in the Management Console.
3.3.12. Viewing Logs in the Management Console
jboss.server.log.dir directory. The JBoss EAP 6 Log Viewer also respects user RBAC role assignments, so a user logged in to the Management Console can only view logs that they are authorized to access.
Prerequisites
Procedure 3.6. View JBoss EAP 6 Logs in the Management Console
- Select the tab from the top of the Management Console.
- If you are using a Managed Domain, use the button on the left menu to select the JBoss EAP 6 server that you want to view the logs of.
- Expand the menu on the left, and select .
- Select a log file from the list, and click the button.You can also click to download the log file to your local machine.
Note
The Management Console Log Viewer displays a confirmation if you attempt to open a log file that is larger than 15MB.The Management Console Log Viewer is not intended to be a text editor replacement for viewing very large log files (>100MB). Opening very large log files in the Management Console Log Viewer could crash your web browser, so you should always download large log files separately and open them in a text editor. - The selected log will open as a new tab within the Management Console. You can open multiple log files in other tabs by returning to the LOG FILES tab and repeating the previous step.
- Search Customer Portal
- Open Case
- Modify Case
Note