此内容没有您所选择的语言版本。
17.4. Suspect Metrics Report
As described in Section 19.1.4, “Baselines and Out-of-Bounds Metrics”, once metrics have been collected a few times, JBoss ON begins calculating a normal operating range for that specific resource and that specific metric. This creates a range based on the lowest and highest values.
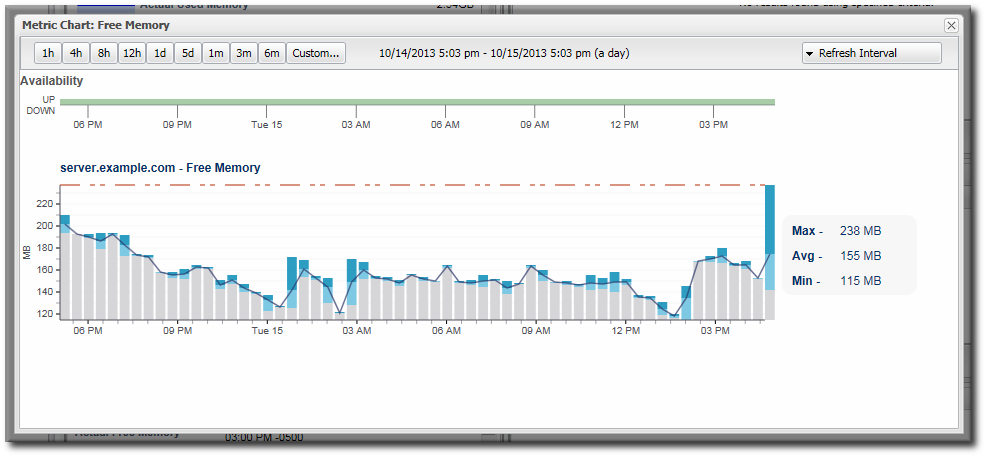
If a metric data point comes in that is outside that normal range, higher or lower, that is a suspect metric. It could be a fault of the metric collection or it could indicate a resource problem.
Each individual resource has a portlet on its Summary tab which lists suspect, or out-of-bounds, metrics.
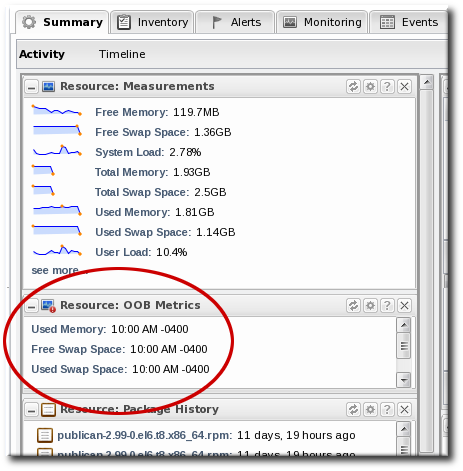
Figure 17.7. Out of Bounds Portlet
All resources, across the inventory, which have a suspect metric are listed in the Suspect Metrics report with the metric, its normal range, its suspect reading, and the factor or percentage of how far outside the metric is from normal readings.
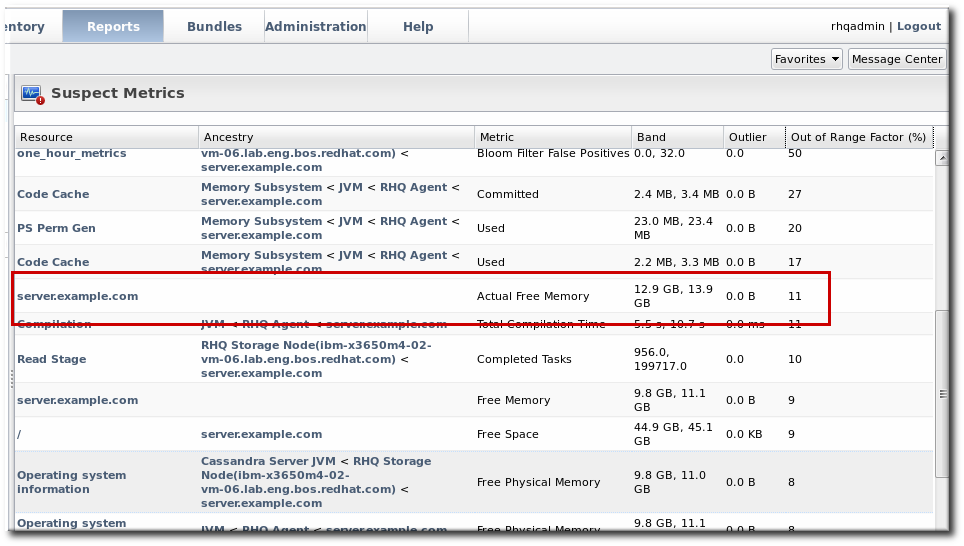
Figure 17.8. Suspect Metrics Reports
Note
Reports can be exported to CSV, which can be used for office systems or further data manipulation.
To export a report, simply click the button. The report will automatically be downloaded as
suspectMetrics.csv.