此内容没有您所选择的语言版本。
17.2. Summary Timelines
The Timeline subtab in the Summary tab shows a line chart of all of the activity for the resource (with the exception of metrics collection, which is all under the Monitoring tab and charts). The Timeline aggregates all configuration changes, inventory changes, drift, events, content and bundle changes, operations, and alerts. Clicking any given point opens up the details for that specific action.
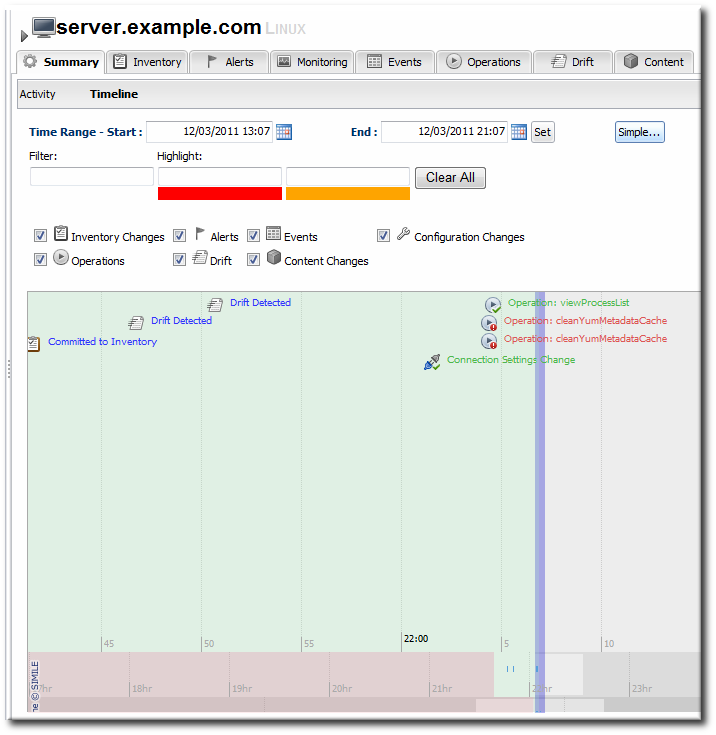
Figure 17.3. Summary Timeline
Because all information is on a single timeline, it becomes must easier to correlate incidents and events and to get a better understanding of the overall activity on that resource.