此内容没有您所选择的语言版本。
21.4. Configuring EJB Call-Time Metrics
EJB method call-time measurements are not collected by default.
- Click the Inventory tab in the top menu.
- Select the Services menu table on the left, and then navigate to the EJB resource.
 NoteIt is probably easier to search for the session bean by name, if you know it.
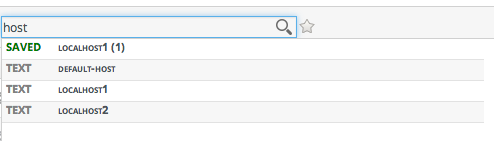
- Click the Monitoring tab on the EJB resource entry.
- Click the Schedules subtab.
- Select the Method Execution Time metric. This metric is the calltime type.

- Click the Enable at the bottom of the list.