此内容没有您所选择的语言版本。
2.3. Global Utilization
The Global Utilization section shows the system utilization of the CPU, Memory and Storage.
Figure 2.3. Global Utilization
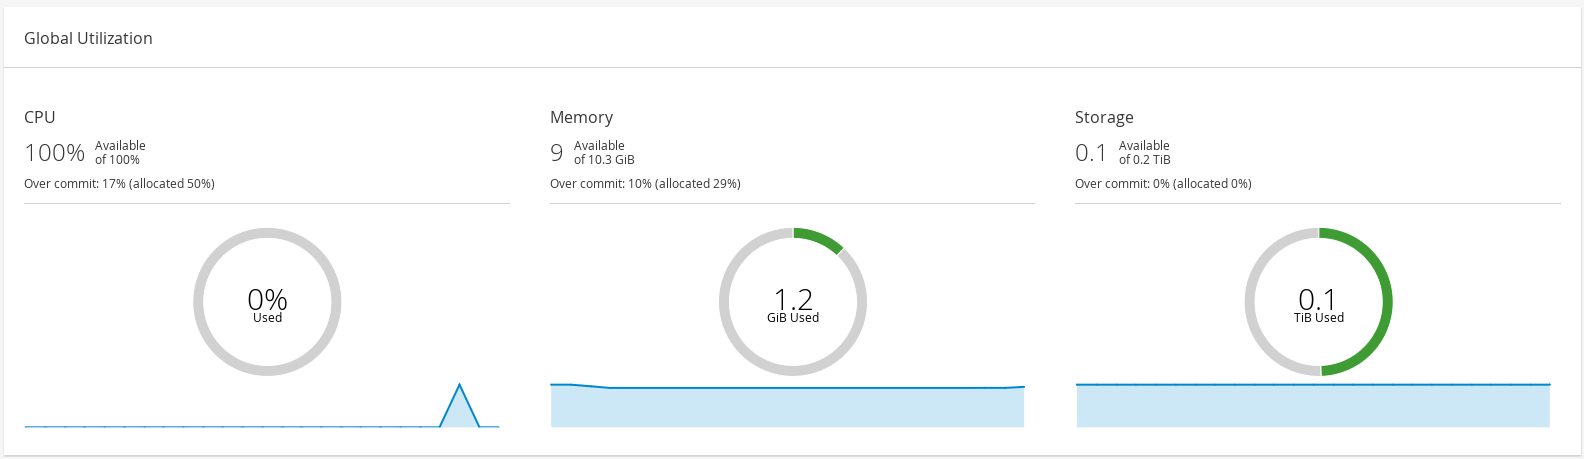
- The top section shows the percentage of the available CPU, memory or storage and the over commit ratio. For example, the over commit ratio for the CPU is calculated by dividing the number of virtual cores by the number of physical cores that are available for the running virtual machines based on the latest data in Data Warehouse.
- The donut displays the usage in percentage for the CPU, memory or storage and shows the average usage for all hosts based on the average usage in the last 5 minutes. Hovering over a section of the donut will display the value of the selected section.
- The line graph at the bottom displays the trend in the last 24 hours. Each data point shows the average usage for a specific hour. Hovering over a point on the graph displays the time and the percentage used for the CPU graph and the amount of usage for the memory and storage graphs.
2.3.1. Top Utilized Resources
复制链接链接已复制到粘贴板!
Figure 2.4. Top Utilized Resources (Memory)
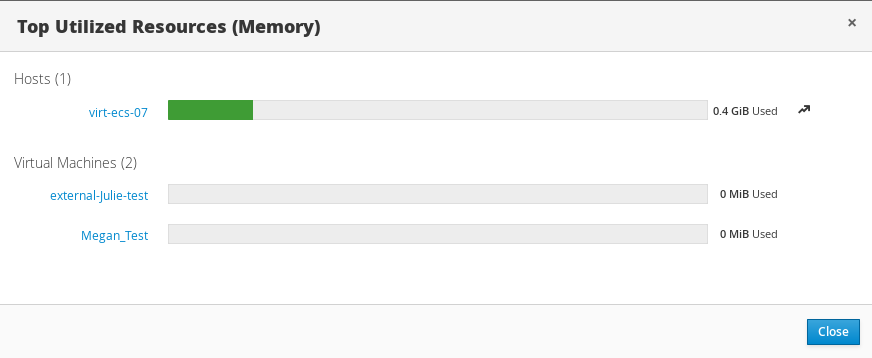
Clicking the donut in the global utilization section of the Dashboard will display a list of the top utilized resources for the CPU, memory or storage. For CPU and memory the pop-up shows a list of the ten hosts and virtual machines with the highest usage. For storage the pop-up shows a list of the top ten utilized storage domains and virtual machines. The arrow to the right of the usage bar shows the trend of usage for that resource in the last minute.