5.2. 仪表板 UI 插件
Cluster Observability Operator 只是一个技术预览功能。技术预览功能不受红帽产品服务等级协议(SLA)支持,且功能可能并不完整。红帽不推荐在生产环境中使用它们。这些技术预览功能可以使用户提早试用新的功能,并有机会在开发阶段提供反馈意见。
有关红帽技术预览功能支持范围的更多信息,请参阅技术预览功能支持范围。
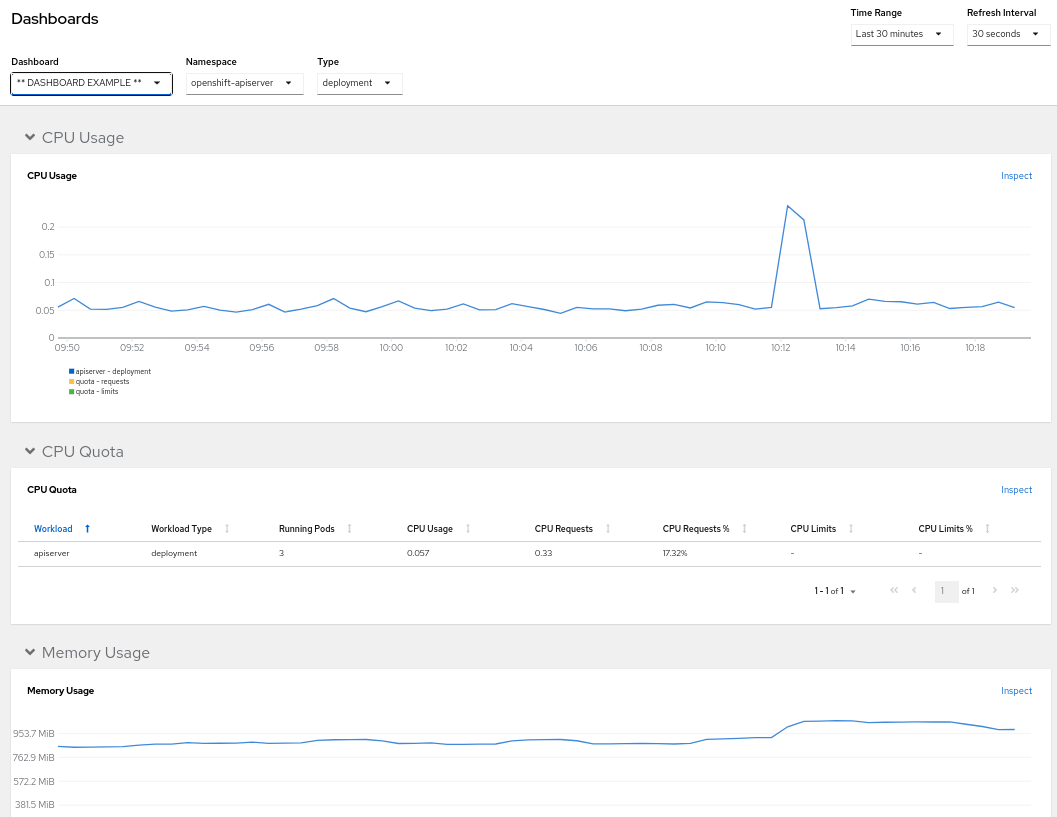
仪表板 UI 插件支持 OpenShift Web 控制台中的增强仪表板,位于 Observe
该插件从 openshift-config-managed 命名空间中的 ConfigMap 资源搜索数据源,其标签为 console.openshift.io/dashboard-datasource: 'true'。
5.2.1. 安装 Cluster Observability Operator 仪表板 UI 插件
先决条件
-
您可以使用具有
cluster-admin集群角色的用户身份访问集群。 - 已登陆到 OpenShift Container Platform Web 控制台。
- 已安装 Cluster Observability Operator。
流程
-
在 OpenShift Container Platform web 控制台中,点 Operators
Installed Operators 并选择 Cluster Observability Operator。 - 选择 UI Plugin 选项卡(在选项卡列表的最右侧),然后按 Create UIPlugin。
选择 YAML 视图,输入以下内容,然后按 Create :
apiVersion: observability.openshift.io/v1alpha1
kind: UIPlugin
metadata:
  name: dashboards
spec:
  type: Dashboards
5.2.2. 配置仪表板
仪表板 UI 插件从 openshift-config-managed 命名空间中的 ConfigMap 资源搜索数据源,其标签为 console.openshift.io/dashboard-datasource: 'true'。ConfigMap 资源必须定义数据源类型和可获取数据的 in-cluster 服务。
以下部分中的示例取自 https://github.com/openshift/console-dashboards-plugin。
先决条件
-
您可以使用具有
cluster-admin集群角色的用户身份访问集群。 - 已登陆到 OpenShift Container Platform Web 控制台。
- 已安装 Cluster Observability Operator。
- 已安装仪表板 UI 插件。
流程
在
openshift-config-managed命名空间中创建ConfigMap资源,标签为console.openshift.io/dashboard-datasource: 'true'。以下示例来自 prometheus-datasource-example.yamlapiVersion: v1 kind: ConfigMap metadata: name: cluster-prometheus-proxy namespace: openshift-config-managed labels: console.openshift.io/dashboard-datasource: "true" data: "dashboard-datasource.yaml": |- kind: "Datasource" metadata: name: "cluster-prometheus-proxy" project: "openshift-config-managed" spec: plugin: kind: "prometheus" spec: direct_url: "https://prometheus-k8s.openshift-monitoring.svc.cluster.local:9091"配置连接到数据源的自定义仪表板。示例仪表板的 YAML 位于 prometheus-dashboard-example.yaml 中。以下摘录显示了该文件的演示目的:
例 5.1. 从示例仪表板中提取(从 prometheus-dashboard-example.yaml 获得)
apiVersion: v1
kind: ConfigMap
metadata:
  name: dashboard-example
  namespace: openshift-config-managed
  labels:
    console.openshift.io/dashboard: "true"
data:
  k8s-resources-workloads-namespace.json: |-
    {
        "annotations": {
            "list": [

            ]
        },
        "editable": true,
        "gnetId": null,
        "graphTooltip": 0,
        "hideControls": false,
        "links": [

        ],
        "refresh": "10s",
        "rows": [
            {
                "collapse": false,
                "height": "250px",
                "panels": [
                    {
                        "aliasColors": {

                        },
                        "bars": false,
                        "dashLength": 10,
                        "dashes": false,
                        "datasource": {
                            "name": "cluster-prometheus-proxy",
                            "type": "prometheus"
                        },
                        "fill": 10,
                        "id": 1,
                        "interval": "1m",
                        "legend": {
                            "alignAsTable": true,
                            "avg": false,
                            "current": false,
                            "max": false,
                            "min": false,
                            "rightSide": true,
                            "show": true,
                            "total": false,
                            "values": false
                        },
                        "lines": true,
                        "linewidth": 0,
                        "links": [

                        ],
                        "nullPointMode": "null as zero",
                        "percentage": false,
                        "pointradius": 5,
                        "points": false,
                        "renderer": "flot",
                        "seriesOverrides": [
                            {
                                "alias": "quota - requests",
                                "color": "#F2495C",
                                "dashes": true,
                                "fill": 0,
                                "hiddenSeries": true,
                                "hideTooltip": true,
                                "legend": true,
                                "linewidth": 2,
                                "stack": false
                            },
                            {
                                "alias": "quota - limits",
                                "color": "#FF9830",
                                "dashes": true,
                                "fill": 0,
                                "hiddenSeries": true,
                                "hideTooltip": true,
                                "legend": true,
                                "linewidth": 2,
                                "stack": false
                            }
                        ],
                        "spaceLength": 10,
                        "span": 12,
                        "stack": false,
                        "steppedLine": false,
                        "targets": [
                            {
                                "expr": "sum(  node_namespace_pod_container:container_cpu_usage_seconds_total:sum_irate{cluster=\"$cluster\", namespace=\"$namespace\"}* on(namespace,pod)  group_left(workload, workload_type) namespace_workload_pod:kube_pod_owner:relabel{cluster=\"$cluster\", namespace=\"$namespace\", workload_type=\"$type\"}) by (workload, workload_type)",
                                "format": "time_series",
                                "intervalFactor": 2,
                                "legendFormat": "{{workload}} - {{workload_type}}",
                                "legendLink": null,
                                "step": 10
                            },
                            {
                                "expr": "scalar(kube_resourcequota{cluster=\"$cluster\", namespace=\"$namespace\", type=\"hard\",resource=\"requests.cpu\"})",
                                "format": "time_series",
                                "intervalFactor": 2,
                                "legendFormat": "quota - requests",
                                "legendLink": null,
                                "step": 10
                            },
                            {
                                "expr": "scalar(kube_resourcequota{cluster=\"$cluster\", namespace=\"$namespace\", type=\"hard\",resource=\"limits.cpu\"})",
                                "format": "time_series",
                                "intervalFactor": 2,
                                "legendFormat": "quota - limits",
                                "legendLink": null,
                                "step": 10
                            }
                        ],
                        "thresholds": [

                        ],
                        "timeFrom": null,
                        "timeShift": null,
                        "title": "CPU Usage",
                        "tooltip": {
                            "shared": false,
                            "sort": 2,
                            "value_type": "individual"
                        },
                        "type": "graph",
                        "xaxis": {
                            "buckets": null,
                            "mode": "time",
                            "name": null,
                            "show": true,
                            "values": [

                            ]
                        },
...
点 Observe
Dashboards,自定义仪表板会基于 prometheus-dashboard-example.yaml中的配置,标题为 ** DASHBOARD EXAMPLE **。
您可以在 UI 中为仪表板设置命名空间、时间范围和刷新间隔。
5.2.3. 其他资源
- 请参阅如何在 console-dashboards-plugin GitHub 存储库中添加新数据源。