1.4. Examining cluster metrics
OpenShift Container Platform 4.5 provides a web interface to Prometheus, which enables you to run Prometheus Query Language (PromQL) queries and examine the metrics visualized on a plot. This functionality provides an extensive overview of the cluster state and enables you to troubleshoot problems.
The Metrics UI queries not only cluster metrics, but metrics of all namespaces.
1.4.1. Contents of the Metrics UI
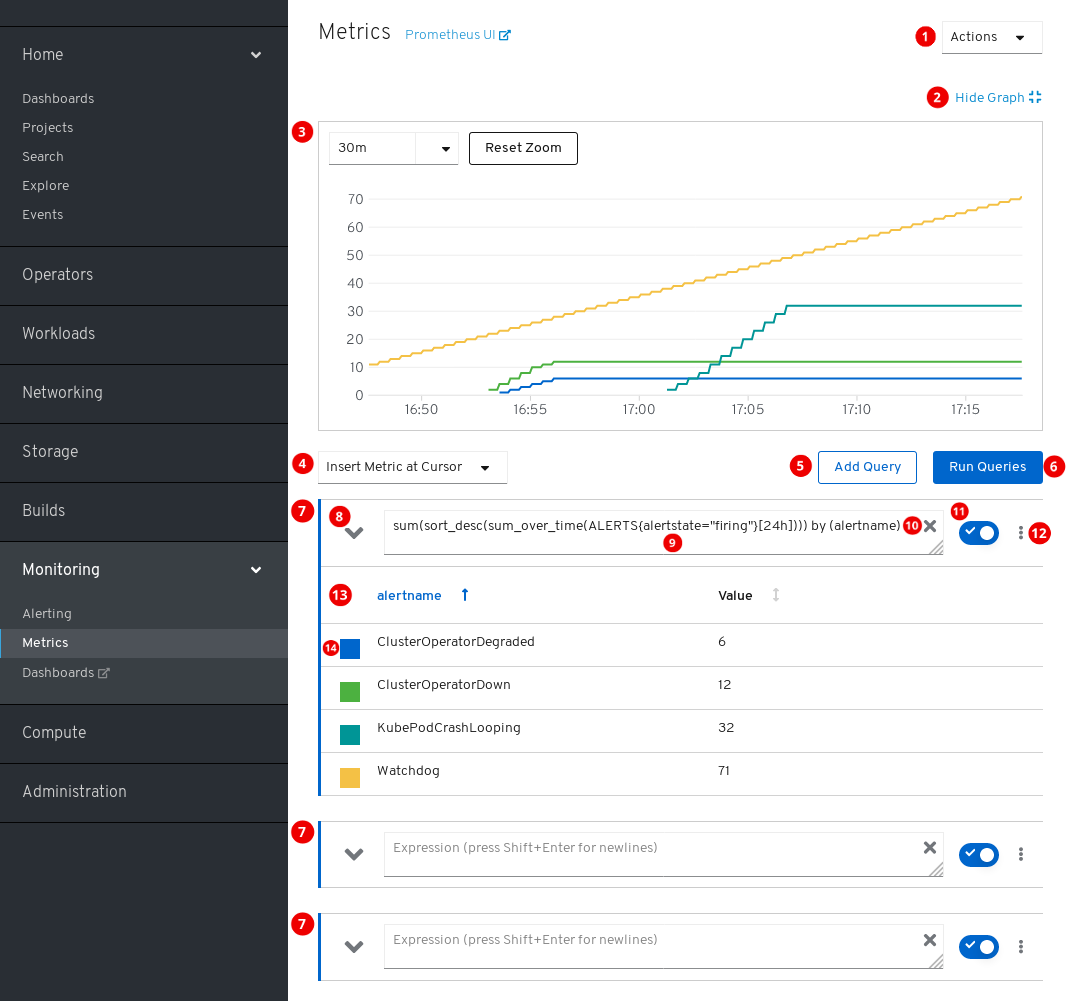
This section shows and explains the contents of the Metrics UI, a web interface to Prometheus.
The Metrics page is accessible by clicking Monitoring

Actions.
- Add query.
- Expand or collapse all query tables.
- Delete all queries.
- Hide the plot.
- The interactive plot.
- The catalog of available metrics.
- Add query.
- Run queries.
- Query forms.
- Expand or collapse the form.
- The query.
- Clear query.
- Enable or disable query.
Actions for a specific query.
- Enable or disable query.
- Show or hide all series of the query from the plot.
- Delete query.
- The metrics table for a query.
- Color assigned to the graph of the metric. Clicking the square shows or hides the metric’s graph.
Additionally, there is a link to the old Prometheus interface next to the title of the page.
1.4.2. Running metrics queries
You begin working with metrics by entering one or several Prometheus Query Language (PromQL) queries.
Procedure
-
Open the OpenShift Container Platform web console and navigate to the Monitoring
Metrics page. In the query field, enter your PromQL query.
- To show all available metrics and PromQL functions, click Insert Metric at Cursor.
- For multiple queries, click Add Query.
-
For deleting queries, click
 for the query, then select Delete query.
- For keeping but not running a query, click the Disable query button.
Once you finish creating queries, click the Run Queries button. The metrics from the queries are visualized on the plot. If a query is invalid, the UI shows an error message.
注意Queries that operate on large amounts of data might timeout or overload the browser when drawing timeseries graphs. To avoid this, hide the graph and calibrate your query using only the metrics table. Then, after finding a feasible query, enable the plot to draw the graphs.
- Optional: The page URL now contains the queries you ran. To use this set of queries again in the future, save this URL.
Additional resources
1.4.3. Exploring the visualized metrics
After running the queries, the metrics are displayed on the interactive plot. The X axis of the plot represents time. The Y axis represents the metrics values. Each metric is shown as a colored graph. You can manipulate the plot and explore the metrics.
Procedure
Initially, all metrics from all enabled queries are shown on the plot. You can select which metrics are shown.
-
To hide all metrics from a query, click
 for the query and click Hide all series.
- To hide a specific metric, go to the query table and click the colored square near the metric name.
-
To hide all metrics from a query, click
To zoom into the plot and change the shown time range, do one of the following:
- Visually select the time range by clicking and dragging on the plot horizontally.
- Use the menu in the left upper corner to select the time range.
To reset the time range, click Reset Zoom.
- To display outputs of all queries at a specific point in time, hold the mouse cursor on the plot at that point. The query outputs will appear in a pop-up box.
- For more detailed information about metrics of a specific query, expand the table of that query using the drop-down button. Every metric is shown with its current value.
- To hide the plot, click Hide Graph.
1.4.4. Non-administrator access to metrics
As a developer, one can enable user workload monitoring for an application or service in a project. As an administrator, you use the same feature to enable monitoring for infrastructure workloads. In that case, a developer or administrator of that project can examine the exposed metrics using the Developer Perspective in the web console.
Examining metrics using the Developer Perspective is a Technology Preview feature only. Technology Preview features are not supported with Red Hat production service level agreements (SLAs) and might not be functionally complete. Red Hat does not recommend using them in production. These features provide early access to upcoming product features, enabling customers to test functionality and provide feedback during the development process.
For more information about the support scope of Red Hat Technology Preview features, see https://access.redhat.com/support/offerings/techpreview/.
Additional resources
See the documentation on monitoring your own services. It includes details on accessing non-cluster metrics as a developer or a privileged user.