10.3. 使用 Web 控制台监控本地系统的性能
Red Hat Enterprise Linux Web 控制台使用 Utilization Saturation and Errors (USE) 方法进行故障排除。新的性能指标页面带有最新数据,您可以对数据进行组织化的历史视图。
在 Metrics and history 页面中,您可以查看事件、错误和资源使用率和饱和度的图形表示。
先决条件
- Web 控制台已安装并可以访问。详情请参阅安装 Web 控制台。
cockpit-pcp软件包(启用收集性能指标)已安装:从 Web 控制台界面安装软件包:
- 使用管理权限登录到 web 控制台。详情请参阅 Web 控制台的日志记录。
- 在 Overview 页面中,单击 View metrics and history。
- 点 按钮。
- 在安装软件对话框窗口中,点安装。
要从命令行界面安装软件包,请使用:
# dnf install cockpit-pcp
启用 Performance Co-Pilot (PCP)服务:
# systemctl enable --now pmlogger.service pmproxy.service
流程
- 登录到 web 控制台。详情请参阅 Web 控制台的日志记录。
- 点 Overview。
在 Usage 部分中,点 View metrics and history。
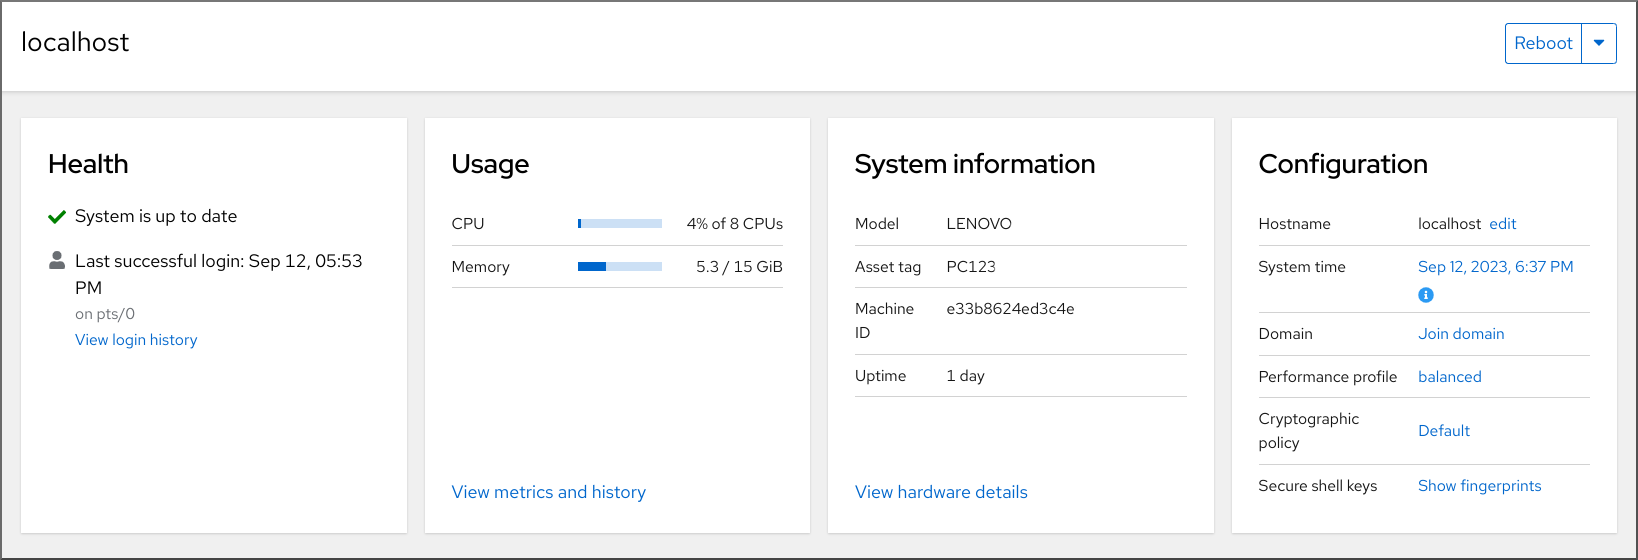
Metrics and history 部分打开:
-
当前系统配置和使用情况:
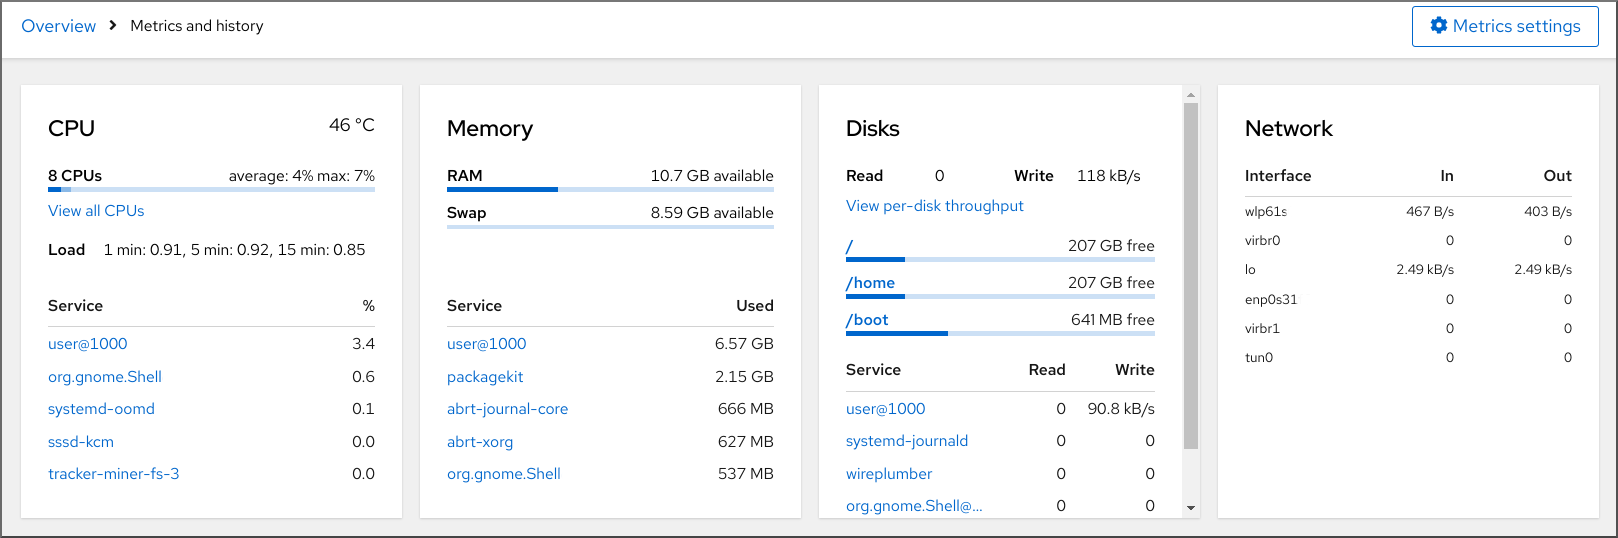
-
用户指定的时间间隔后,图形形式的性能指标:
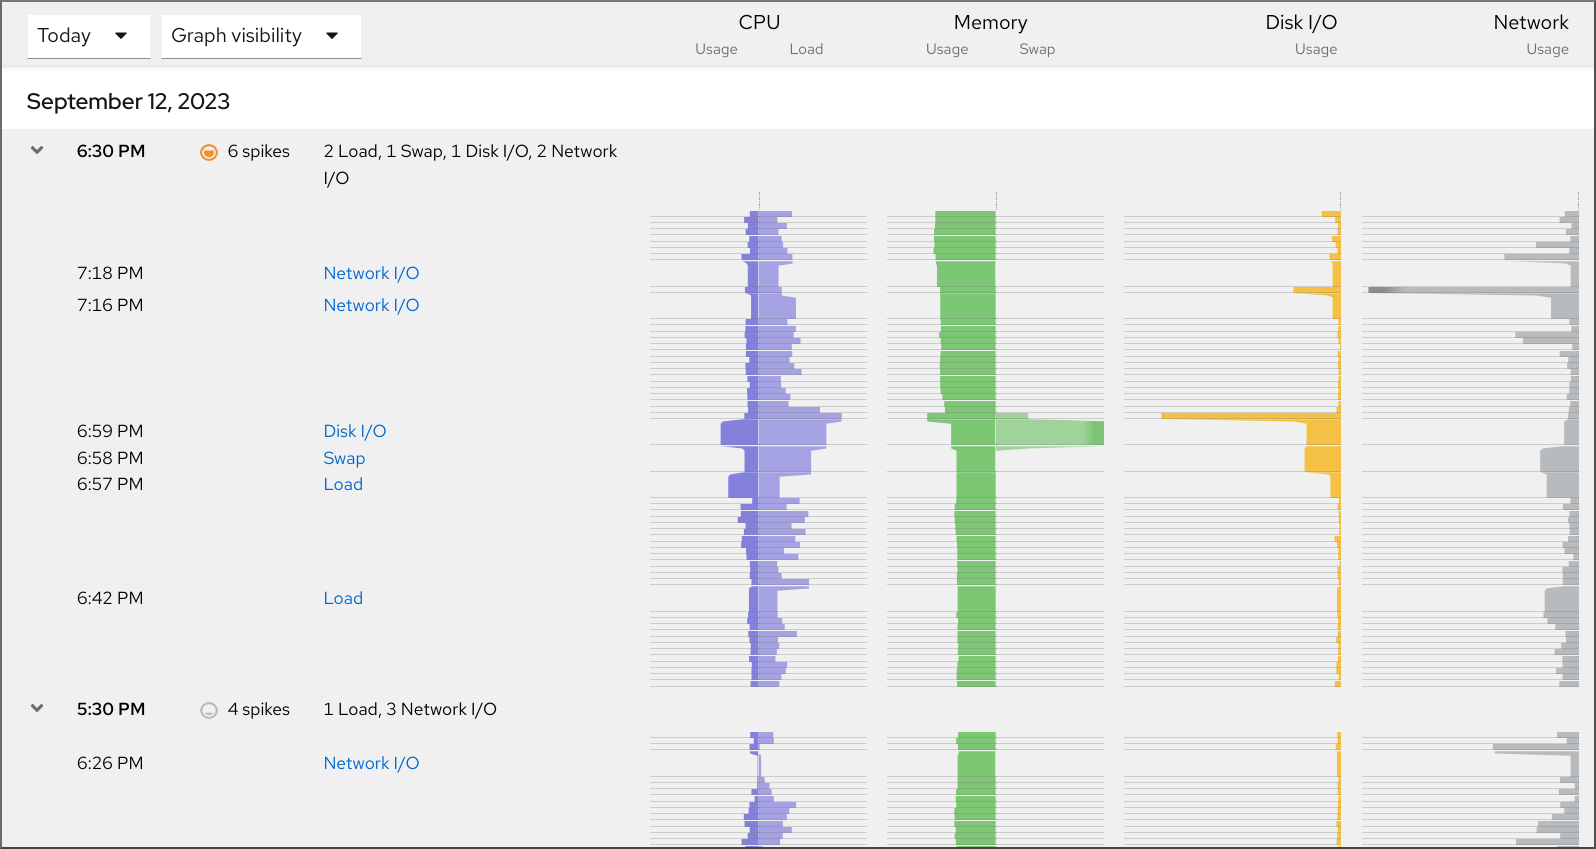
-
当前系统配置和使用情况: