Dieser Inhalt ist in der von Ihnen ausgewählten Sprache nicht verfügbar.
Chapter 9. Centralized Logging
When we think about logging, the first thought that comes to mind for most is its ability to troubleshoot a particular issue. As technology continues to evolve and the enormous amounts of data that many applications capture, logs play a vital role in not only capturing data but to allow for operational intelligence methods to be applied.
Ansible Automation Platform provides a logging feature that allows for the capability to send detailed logs to several kinds of third party external log aggregation services. Services connected to this data feed serve as a useful means in gaining insight into automation controller usage or technical trends. The data can be used to analyze events in the infrastructure, monitor for anomalies, and correlate events from one service with events in another.
The types of data that are most useful to automation controller are job fact data, job events/job runs, activity stream data, and log messages. The data is sent in JSON format over a HTTP connection using minimal service-specific tweaks engineered in a custom handler or via an imported library.
The logging feature within Ansible Automation Platform is currently set up to easily work with Splunk, Logstash, Loggly, Sumologic and provides an other option if you’d like to use a different third party external log aggregation service.
For the purposes of this reference environment, the focus is on using Splunk Enterprise 8.2.2 to setup centralized logging across both our Ansible Automation Platform sites.
Installation of Splunk Enterprise is out of scope for this reference architecture. For details, visit: How to install Splunk Enterprise
9.1. Setting up the Splunk HTTP Event Collector (HEC)
The HTTP Event Collector is an endpoint that lets developers send application events directly to the Splunk platform via HTTP or HTTPS using a token-based authentication model.
In order to use HEC, the first step is to enable HEC within our Splunk deployment.
As a Splunk admin,
- Log into your Splunk dashboard.
-
Click on Settings
Data Inputs HTTP Event Collector. - Click on Global Settings in the upper right corner.
- Select Enabled (default) in the All Tokens toggle options.
-
Choose a Default Source Type for all HEC tokens, e.g.
_json - Checkmark the Enable SSL if your Splunk deployment uses HTTPS.
- Set a dedicated port for HTTP input via the HTTP Port Number. Defaults to 8088.
- Click Save.
Figure 9.1. Global Settings

Ensure that port 8088 (or the assigned port) is open on your Splunk deployment.
With HEC enabled in our Splunk deployment, generate an HEC token that is going to be used for automation controller authentication with Splunk.
While there are different methods on how to configure your token for receiving data over HTTP, the following are the configuration settings used for this reference environment.
For more information on HEC visit: HTTP Event Collector
-
Click Settings
Add Data. - Select Monitor at the bottom of the page.
- Click HTTP Event Collector.
- Enter your token name in the Name field, e.g. AAP
- Change Source Type to Select and enter _json in the dropdown.
- Within Index, create an Index labeled ansible.
Add the newly created Index into the selected items box.
Click Review at the top right corner.
- Click Submit.
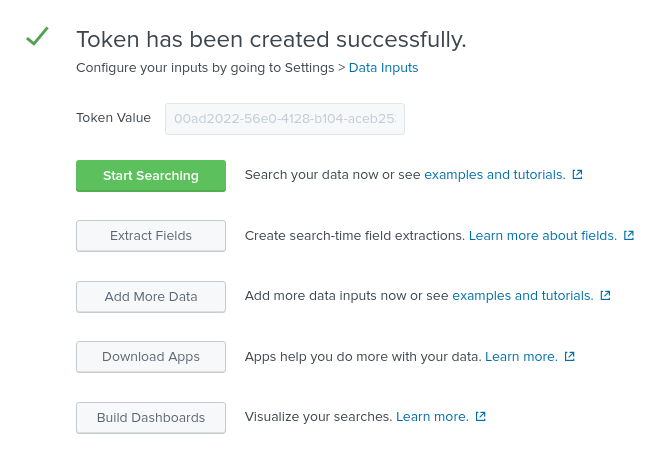
Store the created Token value as it will be used to authenticate Splunk on Ansible Automation Platform
Click the Start Search green button and copy the supplied sample query for later use.
source="http:AAP" (index="ansible") sourcetype="_json"
source="http:AAP" (index="ansible") sourcetype="_json"Copy to Clipboard Copied! Toggle word wrap Toggle overflow


9.2. Configuring Ansible Automation Platform automation controller
With HEC enabled and an HEC token created, our Splunk environment is ready to receive events from Ansible Automation Platform.
The final step is to configure our Ansible Automation Platform automation controller cluster to use the Splunk environment for centralized logging as shown below.
On each Ansible Automation Platform environment,
-
Login as an
adminuser to the Ansible Automation Platform dashboard. - Scroll to the bottom of the page and click on Settings.
Under System, select Logging settings.
Within Logging Aggregator enter the location that the logs should be sent to.
This Splunk environment uses https://splunk.example.com:8088/services/collector/event
NoteModify your location Protocol (HTTP/HTTPS) and the port if not using the default 8088.
- Within Logging Aggregator Type select splunk from the drop down.
- Within Logging Aggregator Password/Token, copy and paste the HEC token previously created.
- Within Logging Aggregator Protocol, select HTTPS/HTTP from the drop down.
- Within Logging Aggregator Level Threshold, select the appriopriate level of logging for your environment, e.g. INFO

Figure 9.2. Reference Environment Logging Setup
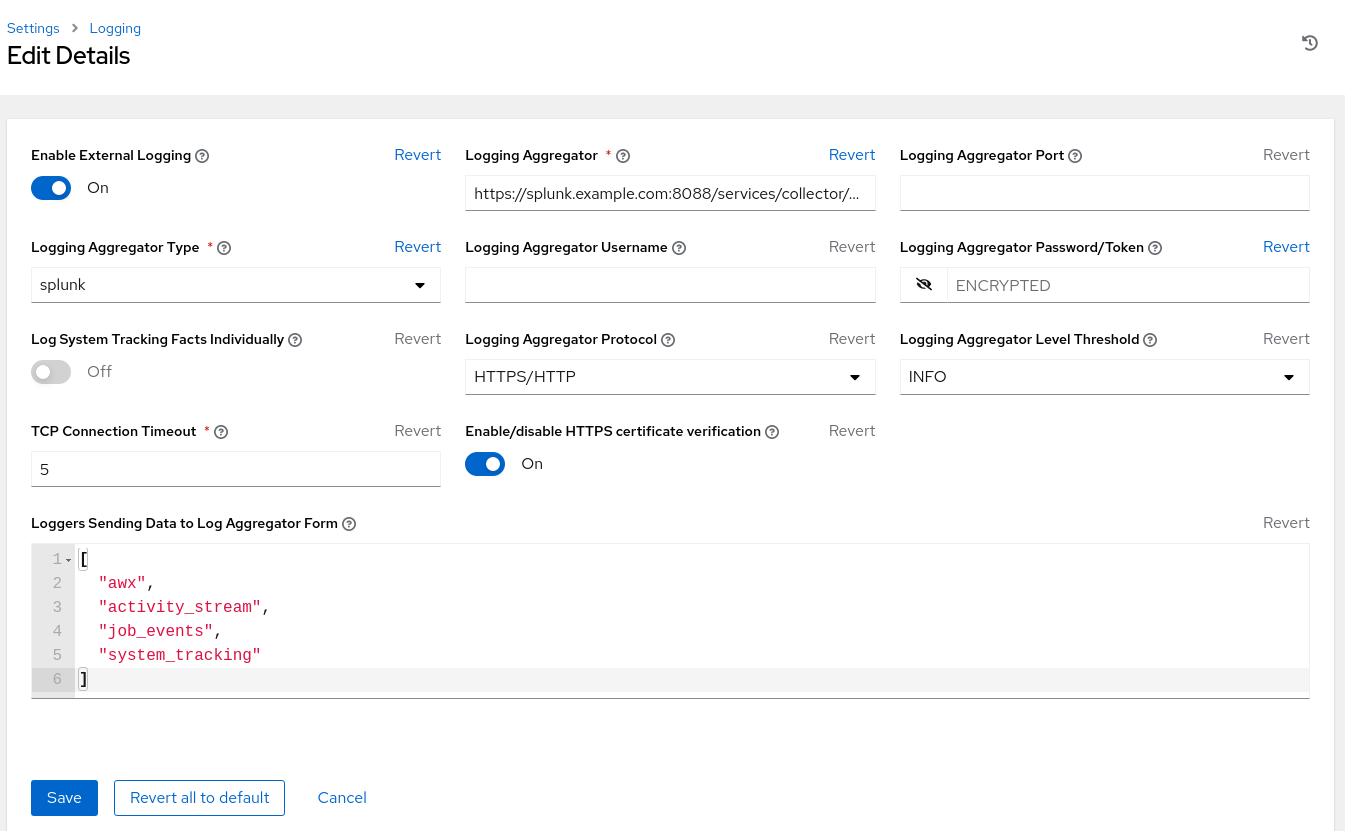
The settings above include the minimum to achieve logging with Splunk. Adjust the logging settings to best fit your environment.
Repeat the logging feature configuration on site two once complete. This ensures both sites are using the same centralized logging environment.
9.3. Verifying events sent to Splunk
Lastly, verify that the Ansible Automation Platform events are being appropriately sent to Splunk. In order to accomplish this, an ad-hoc command via Ansible Automation Platform automation controller is run to confirm.
Within the Ansible Automation Platform dashboard,
-
Under Resources
Inventories, select Demo Inventory. - Within Details, select Hosts.
- Click on the Run Command button.
- Within the Run command Details window section, select the module ping from the drop down and click Next.
- Within the Run command Execution Environment section, select Default execution environment and click Next.
- Within the Run command Credential section, select Demo Credential and click Next.
- Within the Run command Preview section, click the blue Launch button.
The output provided should look as follows:
localhost | SUCCESS => {
    "changed": false,
    "ping": "pong"
}
localhost | SUCCESS => {
    "changed": false,
    "ping": "pong"
}Now head over to your Splunk dashboard and within the Search see if the Ansible Automation Platform event triggered within Splunk.
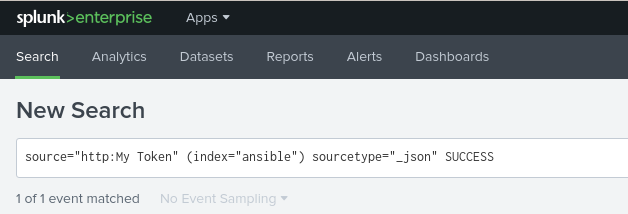
The search should show one event similar to the following

Repeat the same verification process for each Ansible Automation Platform site setup.