19.3. Defining Metrics Collection
19.3.1. Setting Baseline Calculation Properties
Copy linkLink copied to clipboard!
The monitoring baselines have two configuration properties that define how the automatic metric baselines are calculated. These properties don't set the value; they set the window of time used for the baseline averages.
- In the Configuration menu, select the System Settings item.

- Scroll to the Automatic Baseline Configuration Properties section.
- Change the settings to define the window used for calculation.

- Baseline Frequency sets the interval, in days, for how often baselines are recalculated. The default is three days.
- Baseline Dataset sets the time interval, in days, used to calculate the baseline. The default is seven days.
19.3.2. Setting Collection Intervals for a Specific Resource
Copy linkLink copied to clipboard!
Metrics are collected at the intervals specified by the collection schedule. Because not all metrics are mission critical or even likely to change, JBoss ON has different collection schedules for different metrics, with critical metrics collected more frequently.
For most environments, setting a daily collection schedule (once every 24 hours) is sufficient.
To change the collection interval for a specific metric:
- Click the Inventory tab in the top menu.
- Select the resource category, such as servers or services, in the Resources menu table on the left. Then browse or search for the resource.

- Click the Monitoring tab on the resource entry.
- Click the Schedules subtab.
- Select the metric for which to change the monitoring frequency. Multiple metrics can be selected, if they will all be changed to the same frequency.

- Enter the desired collection period in the Collection Interval field, with the appropriate time unit (seconds, minutes, or hours).
- Click Set.
19.3.3. Enabling and Disabling Metrics for a Specific Resource
Copy linkLink copied to clipboard!
- Click the Inventory tab in the top menu.
- Select the resource type in the Resources menu table on the left, and then browse or search for the resource.

- Click the Monitoring tab on the resource entry.
- Click the Schedules sub tab.
- Select the metrics to enable or disable.

- Click the Enable or Disable button.
19.3.4. Changing Metrics Templates
Copy linkLink copied to clipboard!
The metrics which are collected for a resource type are defined in the monitoring template for the resource type. Each resource type has some metrics disabled by default, and these must be manually enabled. Likewise, metrics which are enabled by default can be disabled.
Note
Metric templates only apply to new resources of that resource type unless the checkbox is selected to apply them to existing resources as well as new resources.
- In the top navigation, open the Administration menu, and then the Configuration menu.

- Select the Metric Collection Templates menu item. This opens a long list of resource types, both for platforms and server types.
- Locate the type of resource for which to create the template definition.

- Click the pencil icon to edit the metric collection schedule templates.
- Select the required metrics to enable or disable, and click the Enable or Disable button.
- To edit the frequency that a metric is collected, select the Update schedules for existing resources of marked type checkbox, and then enter the desired time frame into the Collection Interval for Selected: field.

- Click the Set button.
19.3.5. Adding a PostgreSQL Query as a Metric
Copy linkLink copied to clipboard!
A SQL query can be added to a PostgreSQL database as a child resource. That entry becomes a custom metric for that PostgreSQL database.
A query metric must have two columns that allow the JBoss ON agent to collect data for the query:
- metricColumn
- count(id)
The query has to return a single row with those two columns. The first column signals that it is a collected metric, and the second gives the count for the metric.
For example, to track logged-in users:
SELECT 'metricColumn', count(id) FROM my_application_user WHERE is_logged_in = true
The SELECT statement defines the metric for the JBoss ON agent. The rest of the query collects the data from the database. Simple as that.
To add a metric based on a query:
- Click the Inventory tab in the top menu.
- Search for the PostgreSQL resource.
- Click the Inventory tab for the PostgreSQL database.
- Click the Import button in the bottom of the Inventory tab, and select Query.

- Fill in the properties for the query metric. Three fields are particularly important:
- The Table gives which table within the database contains the data; this is whatever is in the FROM statement in the query.
- The Metric Query contains the full query to run. The SELECT statement must be 'metricColumn',count(id) to format the query properly for the JBoss ON agent to interpret it as a metric.
SELECT 'metricColumn', count(id) FROM my_application_user WHERE is_logged_in = true - The Name field is not important in configuring the metric, but it is important identifying the metric later.

Once the query is created, then the agent begins collecting the counts for the data.
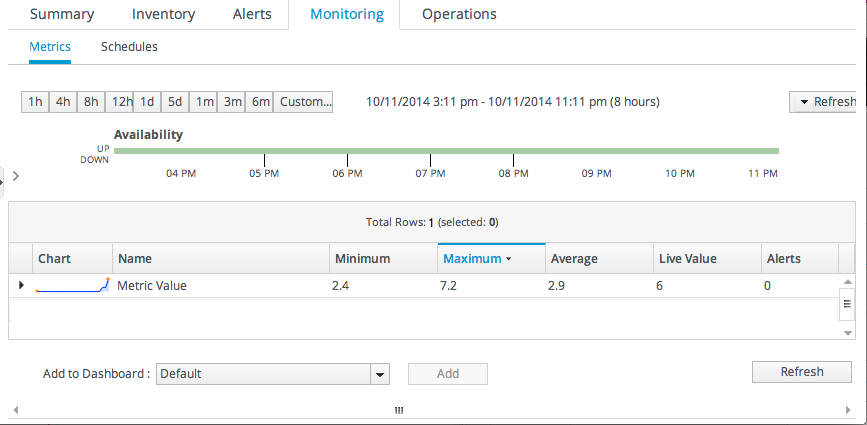
Figure 19.9. Query: Total Logged-in User Count
