Chapter 24. Monitoring and Debugging Routers
24.1. Overview
Depending on the underlying implementation, you can monitor a running router in multiple ways. This topic discusses the HAProxy template router and the components to check to ensure its health.
24.2. Viewing Statistics
The HAProxy router exposes a web listener for the HAProxy statistics. Enter the router’s public IP address and the correctly configured port (1936 by default) to view the statistics page. The administrator password and port are configured during the router installation, but they can be found by viewing the haproxy.config file on the container.
To view HAProxy router stats:
If needed, create the router using
--stats-portto expose statistics on the specified port:$ oc adm router <name> --replicas=<number> --service-account=router --selector='<zone>' --stats-port=<port>For example:
$ oc adm router router --replicas=1 --selector='zone=west' --stats-port=1936Note-replicasis the replication factor of the router; commonly 2 when high availability is desired.-selectoris used to filter nodes on deployment. Used to run routers on a specific set of nodes.If you receive the following error, run the
oc adm policy add-scc-to-user hostnetwork -z <name>command as suggested.error: router could not be created; service account "router" is not allowed to access the host network on nodes, grant access with oc adm policy add-scc-to-user hostnetwork -z routerRun the following command to get the router pod name:
oc get pod
NAME              READY     STATUS    RESTARTS   AGE
router-1-deploy   0/1       Pending   0          48s
If needed, run the following command to get the stats password that was assigned during router creation:
$ oc describe pod <pod-name> |grep STATS_PASSWORDFor example:
oc describe pod router-1-lt7xm |grep STATS_PASSWORD
      STATS_PASSWORD:				C1dSdUff00
Run the following command to open iptables for the router stats port:
$ iptables -I OS_FIREWALL_ALLOW -p tcp -m tcp --dport 1936 -j ACCEPTYou can add this rule to /etc/sysconfig/iptables to keep the rule across reboots.
You can make this port accessible via port forwarding, if desired.
Use one of the following methods to view statistics:
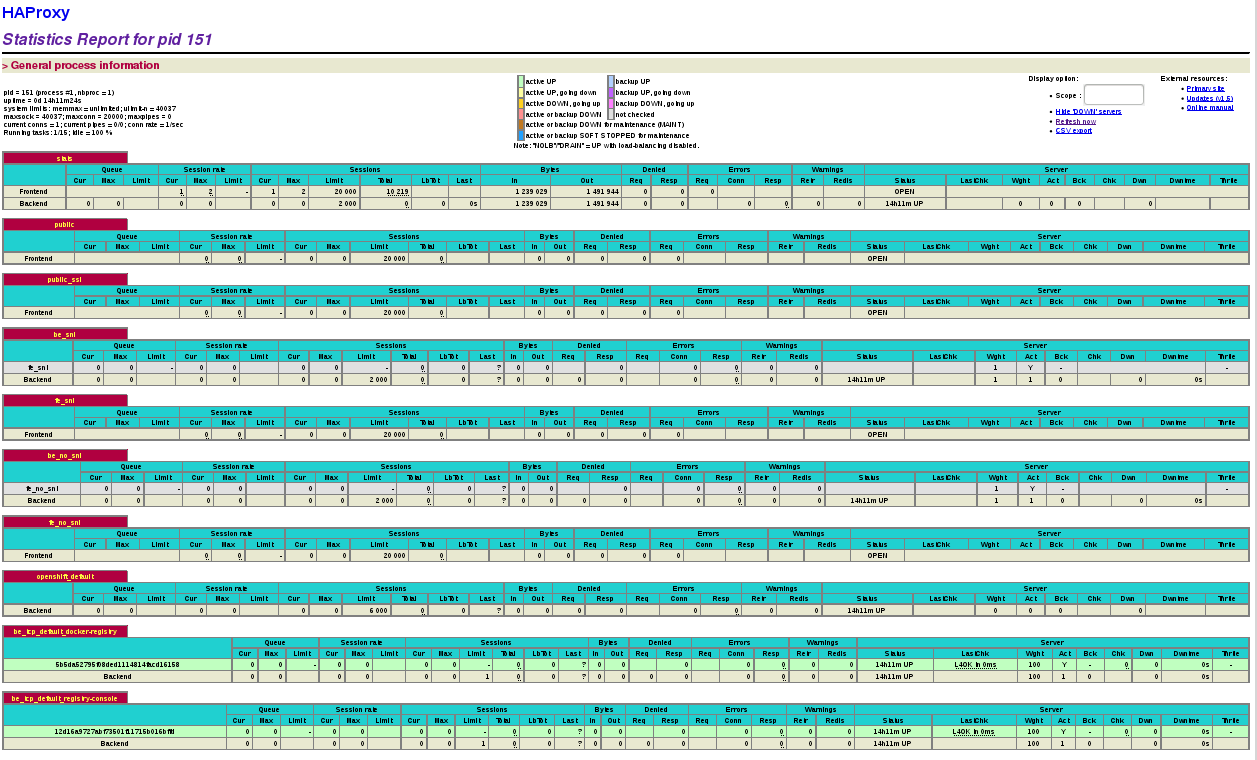
To launch the stats window, use the following URL in a browser:
http://admin:<stats-password>@<master-ip>:1936/haproxy_statsFor example:
http://admin:C1dSdUff00@master.example.com:1936The statistics display in a table similar to the following:
To generate a CSV output of the statistics, execute the following command on master:
$ cmd="echo 'show stat' | socat - UNIX-CONNECT:/var/lib/haproxy/run/haproxy.sock"
$ routerPod=$(oc get pods --selector="router=router"  \
    --template="{{with index .items 0}}{{.metadata.name}}{{end}}")
$ oc exec $routerPod -- bash -c "$cmd"
Statistics are output similar to the following:
# pxname,svname,qcur,qmax,scur,smax,slim,stot,bin,bout,dreq,dresp,ereq,econ,eresp,wretr,wredis,status,weight,act,bck,chkfail,chkdown,lastchg,downtime,qlimit,pid,iid,sid,throttle,lbtot,tracked,type,rate,rate_lim,rate_max,check_status,check_code,check_duration,hrsp_1xx,hrsp_2xx,hrsp_3xx,hrsp_4xx,hrsp_5xx,hrsp_other,hanafail,req_rate,req_rate_max,req_tot,cli_abrt,srv_abrt,comp_in,comp_out,comp_byp,comp_rsp,lastsess,last_chk,last_agt,qtime,ctime,rtime,ttime, stats,FRONTEND,,,0,3,20000,10273,1254027,1600580,0,0,0,,,,,OPEN,,,,,,,,,1,2,0,,,,0,0,0,2,,,,0,10274,0,1,0,0,,0,3,10275,,,0,0,0,0,,,,,,,, stats,BACKEND,0,0,0,0,2000,0,1254027,1600580,0,0,,0,0,0,0,UP,0,0,0,,0,51350,0,,1,2,0,,0,,1,0,,0,,,,0,0,0,0,0,0,,,,,0,0,0,0,0,0,266,,,0,0,0,1, public,FRONTEND,,,0,0,20000,0,0,0,0,0,0,,,,,OPEN,,,,,,,,,1,3,0,,,,0,0,0,0,,,,0,0,0,0,0,0,,0,0,0,,,0,0,0,0,,,,,,,, public_ssl,FRONTEND,,,0,0,20000,0,0,0,0,0,0,,,,,OPEN,,,,,,,,,1,4,0,,,,0,0,0,0,,,,,,,,,,,0,0,0,,,0,0,0,0,,,,,,,, be_sni,fe_sni,0,0,0,0,,0,0,0,,0,,0,0,0,0,no check,1,1,0,,,,,,1,5,1,,0,,2,0,,0,,,,,,,,,,0,,,,0,0,,,,,-1,,,0,0,0,0, be_sni,BACKEND,0,0,0,0,2000,0,0,0,0,0,,0,0,0,0,UP,1,1,0,,0,51350,0,,1,5,0,,0,,1,0,,0,,,,,,,,,,,,,,0,0,0,0,0,0,-1,,,0,0,0,0, fe_sni,FRONTEND,,,0,0,20000,0,0,0,0,0,0,,,,,OPEN,,,,,,,,,1,6,0,,,,0,0,0,0,,,,0,0,0,0,0,0,,0,0,0,,,0,0,0,0,,,,,,,, be_no_sni,fe_no_sni,0,0,0,0,,0,0,0,,0,,0,0,0,0,no check,1,1,0,,,,,,1,7,1,,0,,2,0,,0,,,,,,,,,,0,,,,0,0,,,,,-1,,,0,0,0,0, be_no_sni,BACKEND,0,0,0,0,2000,0,0,0,0,0,,0,0,0,0,UP,1,1,0,,0,51350,0,,1,7,0,,0,,1,0,,0,,,,,,,,,,,,,,0,0,0,0,0,0,-1,,,0,0,0,0, fe_no_sni,FRONTEND,,,0,0,20000,0,0,0,0,0,0,,,,,OPEN,,,,,,,,,1,8,0,,,,0,0,0,0,,,,0,0,0,0,0,0,,0,0,0,,,0,0,0,0,,,,,,,, openshift_default,BACKEND,0,0,0,0,6000,0,0,0,0,0,,0,0,0,0,UP,0,0,0,,0,51350,0,,1,9,0,,0,,1,0,,0,,,,0,0,0,0,0,0,,,,,0,0,0,0,0,0,-1,,,0,0,0,0, be_tcp_default_docker-registry,5b5da52795f08ded1114814facd16158,0,0,0,0,,0,0,0,,0,,0,0,0,0,UP,100,1,0,0,0,51350,0,,1,10,1,,0,,2,0,,0,L4OK,,0,,,,,,,0,,,,0,0,,,,,-1,,,0,0,0,0, be_tcp_default_docker-registry,BACKEND,0,0,0,0,1,0,0,0,0,0,,0,0,0,0,UP,100,1,0,,0,51350,0,,1,10,0,,0,,1,0,,0,,,,,,,,,,,,,,0,0,0,0,0,0,-1,,,0,0,0,0, be_tcp_default_registry-console,12d16a9727abf73501f11715b016bffd,0,0,0,0,,0,0,0,,0,,0,0,0,0,UP,100,1,0,0,0,51350,0,,1,11,1,,0,,2,0,,0,L4OK,,0,,,,,,,0,,,,0,0,,,,,-1,,,0,0,0,0, be_tcp_default_registry-console,BACKEND,0,0,0,0,1,0,0,0,0,0,,0,0,0,0,UP,100,1,0,,0,51350,0,,1,11,0,,0,,1,0,,0,,,,,,,,,,,,,,0,0,0,0,0,0,-1,,,0,0,0,0,ImportantFor security purposes, the
oc execcommand does not work when accessing privileged containers. Instead, you can SSH into a node host, then use thedocker execcommand on the desired container.
24.3. Disabling Statistics View
By default the HAProxy statistics are exposed on port 1936 (with a password protected account). To disable exposing the HAProxy statistics, specify 0 as the stats port number.
$ oc set env dc/router STATS_PORT=0$ oc adm router hap --service-account=router --stats-port=0HAProxy will still collect and store statistics. However, the stats are not exposed through a web listener. You can still get access to the CSV statistics by sending a request to the HAProxy AF_UNIX socket inside the HAProxy Router container as shown above.
24.4. Viewing Logs
To view a router log, run the oc logs command on the pod. Since the router is running as a plug-in process that manages the underlying implementation, the log is for the plug-in, not the actual HAProxy log.
To view the logs generated by HAProxy, start a syslog server and pass the location to a router pod using the following environment variables.
| Environment Variable | Description |
|---|---|
|
| The IP address of the syslog server. Port 514 is the default if no port is specified. |
|
| Optional. Set to change the HAProxy log level. If not set, the default log level is warning. This can be changed to any log level that HAProxy supports. |
To set a running router pod to send messages to a syslog server:
$ oc set env dc/router ROUTER_SYSLOG_ADDRESS=<dest_ip:dest_port> ROUTER_LOG_LEVEL=<level>For example, the following sets HAProxy to send logs to 127.0.0.1 with the default port 514 and changes the log level to debug.
$ oc set env dc/router ROUTER_SYSLOG_ADDRESS=127.0.0.1 ROUTER_LOG_LEVEL=debug24.5. Viewing the Router Internals
routes.json
Routes are processed by the HAProxy router, and are stored both in memory, on disk, and in the HAProxy configuration file. The internal route representation, which is passed to the template to generate the HAProxy configuration file, is found in the /var/lib/haproxy/router/routes.json file. When troubleshooting a routing issue, view this file to see the data being used to drive configuration.
HAProxy configuration
You can find the HAProxy configuration and the backends that have been created for specific routes in the /var/lib/haproxy/conf/haproxy.config file. The mapping files are found in the same directory. The helper frontend and backends use mapping files when mapping incoming requests to a backend.
Certificates
Certificates are stored in two places:
- Certificates for edge terminated and re-encrypt terminated routes are stored in the /var/lib/haproxy/router/certs directory.
- Certificates that are used for connecting to backends for re-encrypt terminated routes are stored in the /var/lib/haproxy/router/cacerts directory.
The files are keyed by the namespace and name of the route. The key, certificate, and CA certificate are concatenated into a single file. You can use OpenSSL to view the contents of these files.