Chapter 30. API analytics
This guide is designed to help you tune your API analytics to track the items you need to know about and to see top applications and trends over time.
Knowing how your API is used is a crucial step for managing traffic, provisioning for peaks, and identifying top users so you can help them achieve greater success with your API.
30.1. Prerequisites
Complete the instructions of the Getting Started section before using this guide.
The guide assumes that you are using one of the existing 3scale code plugins to perform an integration. You can follow a similar flow with other integration methods. Check the Operating APIcast chapter of the documentation to learn more about the available integration options.
30.2. Determining the metrics and methods to track
3scale acts as an infinitely scalable data repository for your API statistics, and you can track almost any metric for your API. For example:
- Hits/transactions: calls to the API. Hits are included by default as metrics on all APIs. Hits can be overall calls to the API or broken out into individual methods on the API.
- Data transfer: quantity of MB/GB of data uploaded and downloaded via the API
- CPU hours: compute time (or some other internal resource) associated with calls to the API
- Results returned: count of the number of records or data objects being returned
- Disk storage: total disk storage in use by an account
You can track more metrics that are relevant to your API. 3scale can track an arbitrary number of metrics and methods, as long as it is a countable quantity that can be incremented over time.
30.3. Creating your metrics and methods
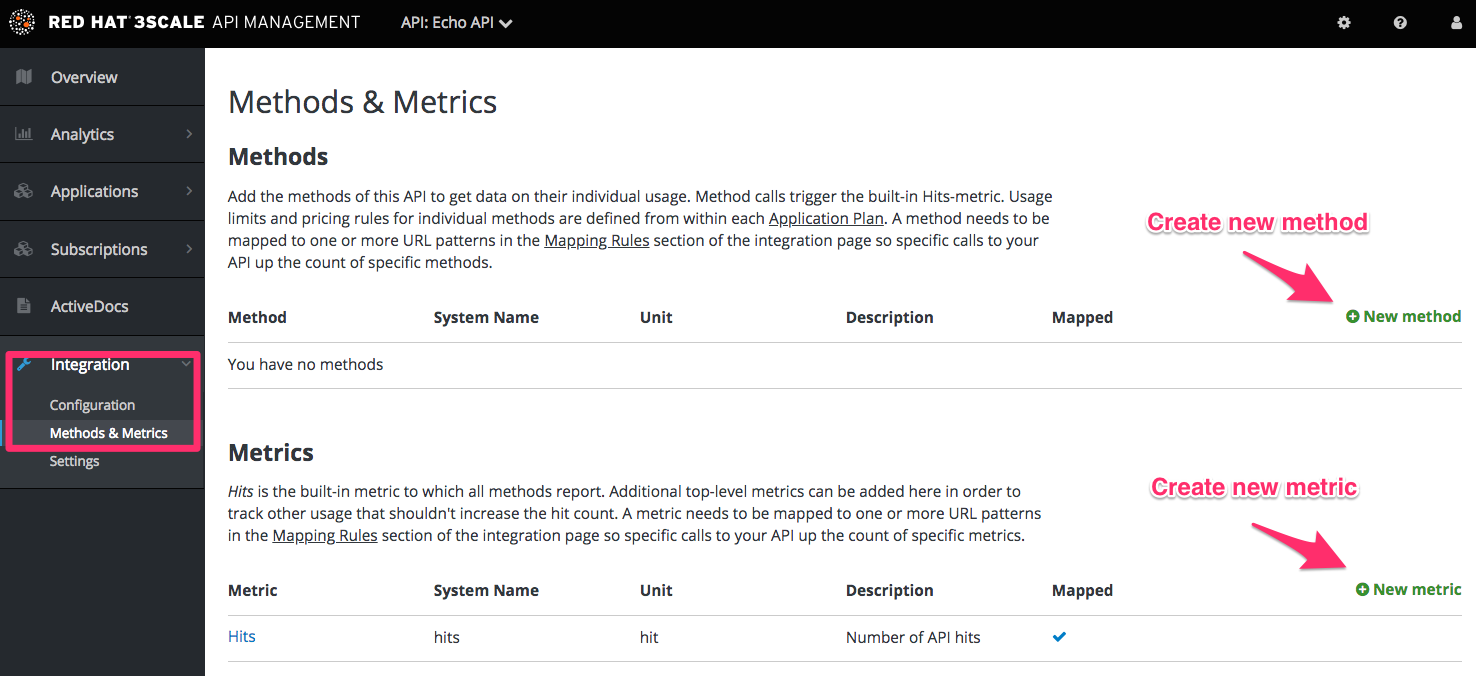
After you chose your metrics, register them in the 3scale Admin Portal. Navigate to [your_API_name] > Integration > Methods & Metrics.
Figure 30.1. Create new method

Add metrics and methods to the service. Provide them with a friendly name and a system name, which is used later in your plugin configuration. For more details about creating methods and metrics, see defining your API on 3scale.
30.4. Setting up reports
Once you have configured the 3scale system with the names of the metrics to track, it is time to tweak your plugin setup to report the right metrics. The precise manner of doing this depends on the plugin or integration method in use. By default, the plugins report the hits (API transactions) metric only.
Generally speaking, you need to follow these steps.
- The application should pass the appropriate metric/method names to the plugin as determined by the incoming API call. The metric/method value and the increment required is an argument of authorize and/or report methods the plugin exposes.
-
You can also report the traffic using the 3scale Service Management API. You can find information about different endpoints in the 3scale APIs ActiveDocs section. 3scale ActiveDocs are available in your Admin Portal under the Documentation
3scale API Docs section.
When you report traffic for a specific API method, use the method system name in the metric argument. This automatically increments the counter both for the method reported and the hits metric.
30.5. Checking that traffic is reported correctly
Once the API and 3scale connection is established, you can send traffic to the API and watch it register on the API Analytics dashboard. You need an existing developer account and an application with API credentials to be able to perform the steps in this section. Follow these steps to create a developer account and get an application with API credentials.
- Open the Getting Started guide.
- Navigate to Audience > Applications > Listing to see the list of existing applications.
Select an application by clicking on its name.
Figure 30.2. Applications

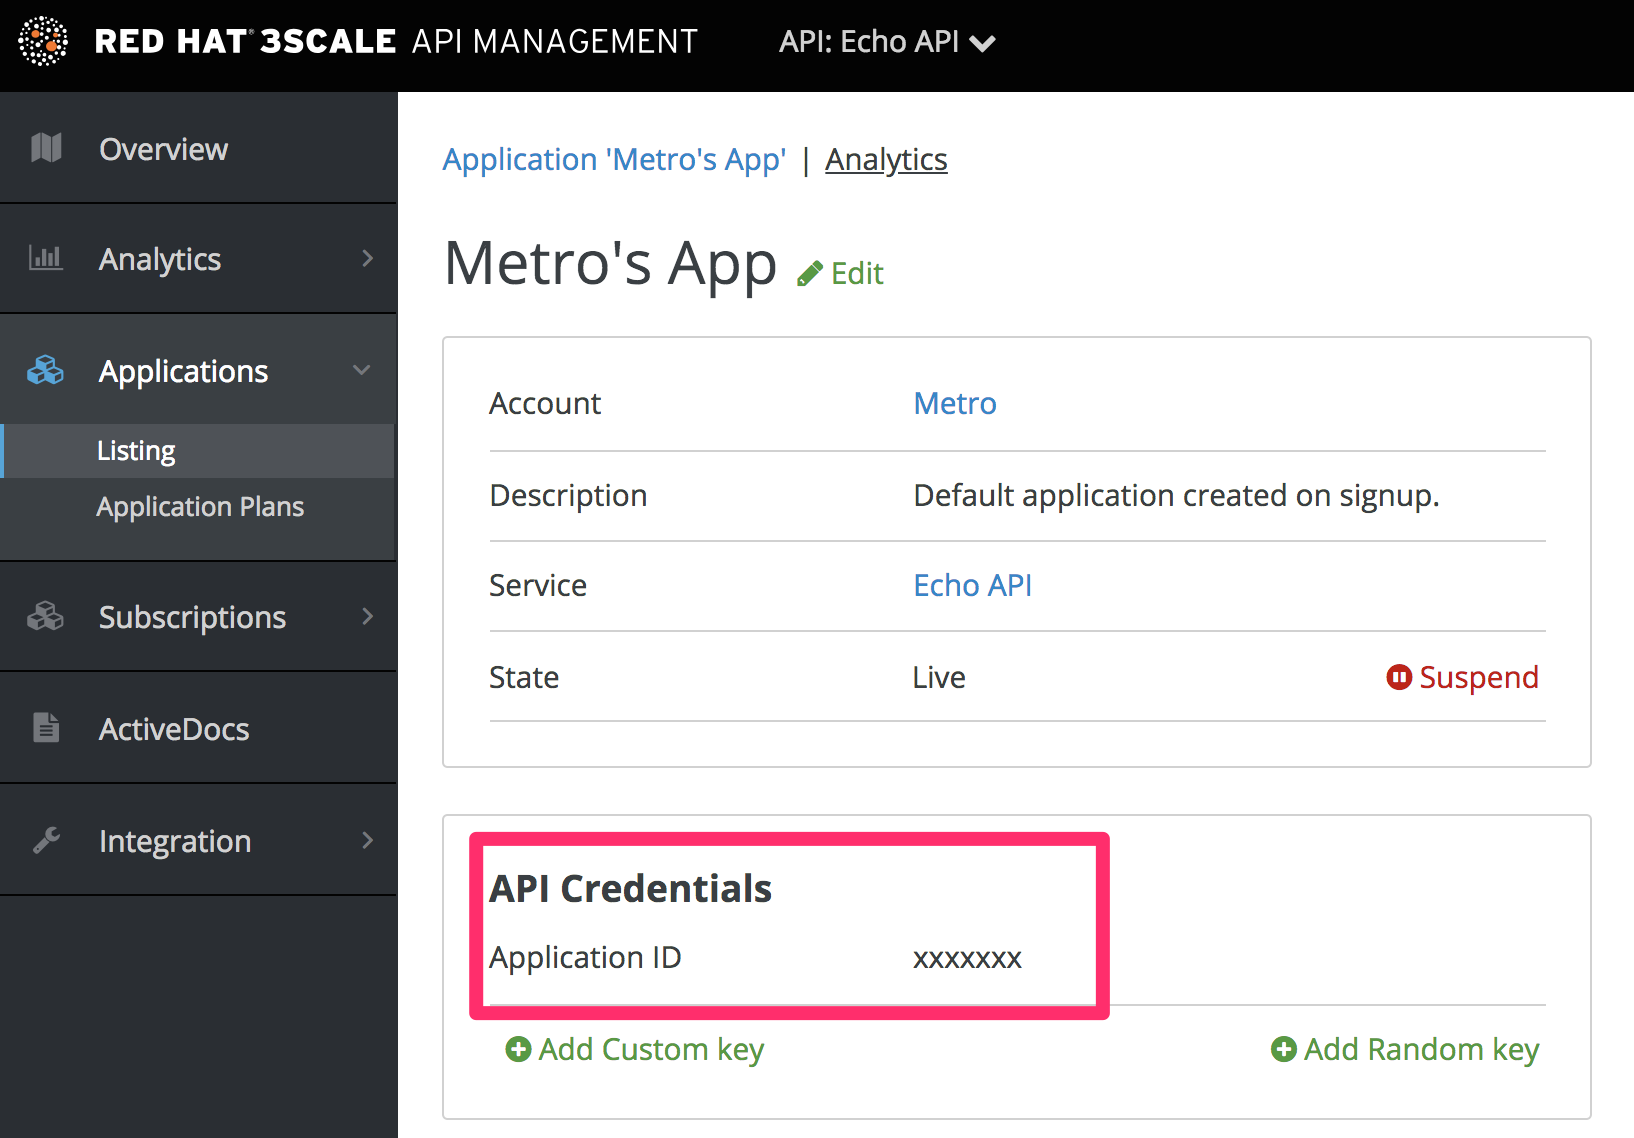
Find the API credentials for the selected application. The credentials depend on the selected authentication type and can be a user key (API key), an application ID and application keys, or a client ID and client secret. For more information about the available authentication modes, see the authentication patterns article.
Figure 30.3. API credentials

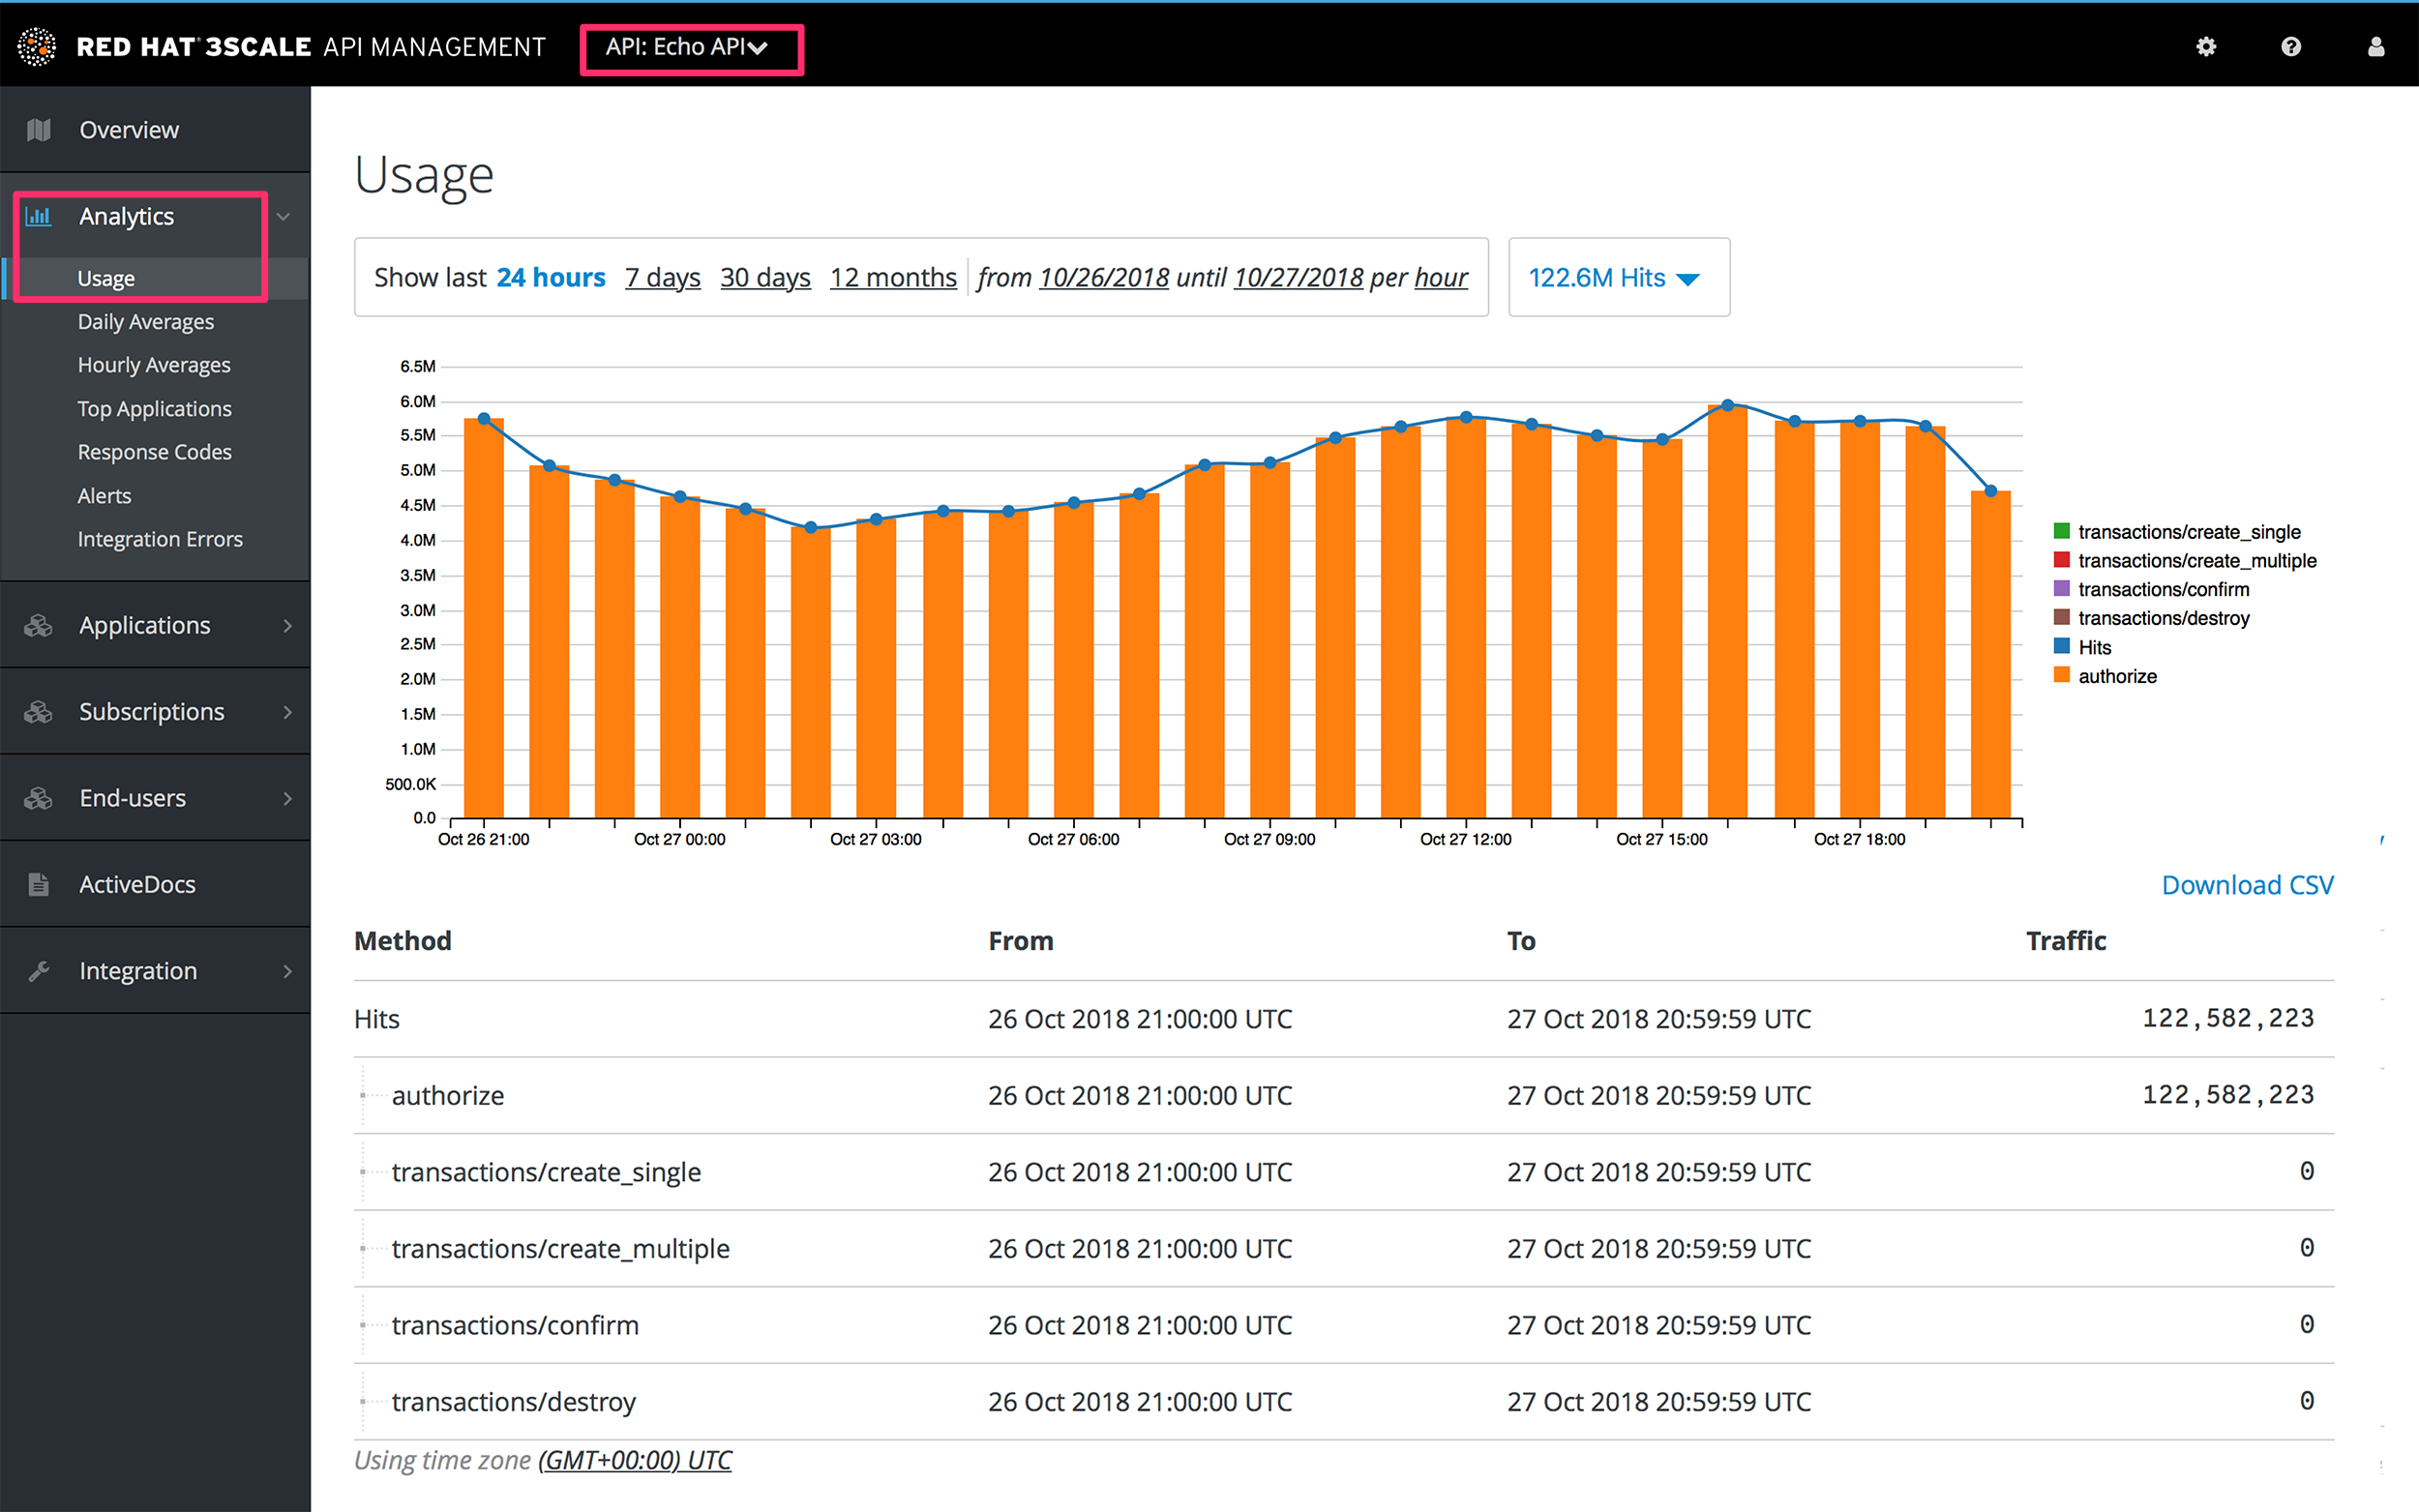
Use these keys to make calls to your API in the normal way (for example, from the command line using cURL or from the browser for API endpoints using the GET method). The precise calls to make depend on the structure of the methods on your API. Traffic from these calls appear in the Analytics section for your API.
Figure 30.4. Analytics usage

30.6. Troubleshooting
If traffic does not display on the usage charts in the Analytics section, perform the following checks.
Are authorize/report calls responding correctly?
All plugins call the 3scale Service Management API, which has predetermined response codes. Authorize calls for valid keys should return responses with HTTP code 200. Report calls should respond with code 202.
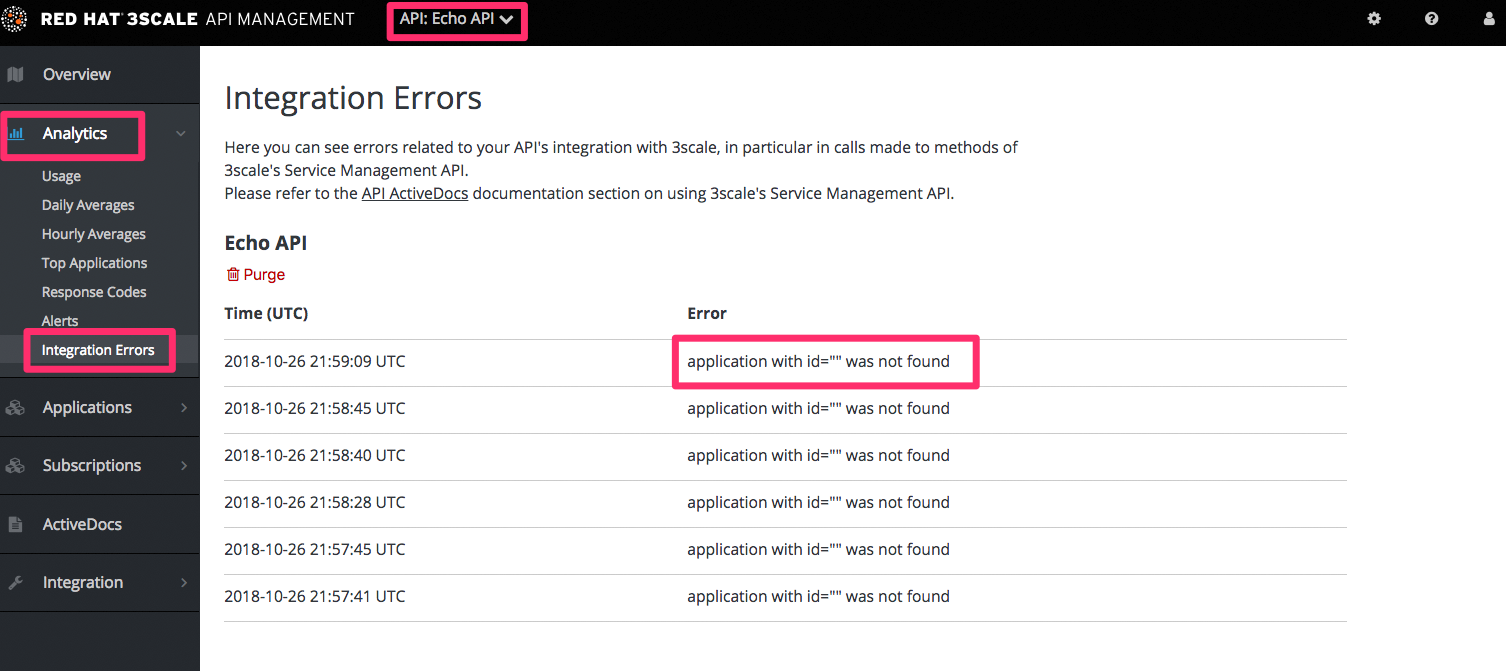
Are there errors in the integration error console?
The log of integration errors detected by 3scale can be found in [your_API_name] > Analytics > Integration Errors.
Figure 30.5. Integration errors

Are the correct metric and method names being used?
The most common reason for failure is that the method and metric names passed in report calls do not correspond to those created in the API settings of your Admin Portal. Check that you are using the correct system names for each metric/method.
30.7. Controlling who sees the analytics
By default, the usage statistics are visible to the API provider through the Admin Portal and to the developers who created applications through the Developer Portal. (Each developer can see only the usage statistics for their own applications.) You have the ability to hide the analytics views from the Developer Portal. See the Creating the Developer Portal section to learn more about customizing the Developer Portal.
30.8. Accessing analytics data by API and email reports
Besides the usage graphs in the Analytics section, there are other methods of getting your API’s analytics data.
Analytics API
You can use the 3scale Analytics API. It is a flexible way to extract all the analytics data for your API in either XML or JSON format.
Daily and weekly traffic reports (SaaS only)
These reports provide the aggregated data about your traffic, including information about new subscribers to your API and top applications. To enable these reports in the Account Settings (gear icon) > Personal > Notification Preferences of your Admin Portal, find the weekly aggregate reports and daily aggregate reports check boxes. If enabled, these reports are emailed to the admin user of your 3scale account.
CSV export (SaaS only)
There is a download CSV link on each analytics view page, and you can download the usage statistics in .csv format.
Download CSV image::guides-api-analytics-download-csv.png[width=100px]