Initial Setup: the Resource Inventory, Groups, and Users
JBoss Operations Network 3.0.1
for initially setting up resources and security in JBoss ON
December 7, 2011, updated March 18, 2012
Abstract
Once JBoss Operations Network is installed, you are ready to set up your inventory. The inventory in JBoss ON lists all of the recognized platforms, servers, and services which are managed by JBoss ON — these are your resources. These resources can be organized into groups to help simplify management tasks.
Security-related entries like users, roles, and assigned permissions also need to be created once JBoss ON is installed.
This guide provides GUI-based procedures to set up all of your resource entries, groups, and security entries, as well as providing a basic overview of the JBoss ON GUI and tasks.
1. Using the JBoss ON Web Interface
JBoss Operations Network has a rich, layered UI which covers a broad range of functionality. This chapters gives a brief summary of the major sections of the UI so that users can more effectively perform management tasks.
1.1. Logging into the JBoss ON Web UI
Aside from some minor configuration in its
rhq-server.properties file, JBoss ON is completely administered through its web interface.
By default, the JBoss ON server listens over port 7080. (A different port can be configured when the server is installed, and the port number can be changed in the server configuration.) To connect to the server, then, simply open a standard HTTP page with a URL in the format hostname:port. For example:
http://server.example.com:7080
Then, log in using any valid username/password combination. The default administrative user has the name and password
rhqadmin.
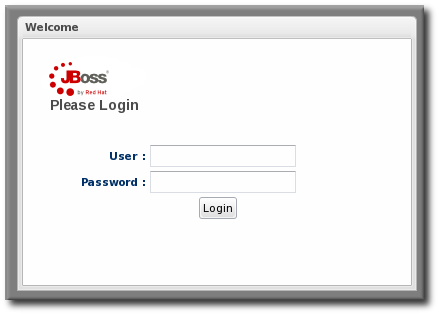
Figure 1. Logging into JBoss ON
Note
By default, JBoss ON only runs over standard HTTP. SSL must be specially configured to open a secure connection over HTTPS. For HTTPS, JBoss ON uses the connection port 7443.
1.2. A High Level Walk-Through
The JBoss ON UI is very rich — there are a lot of small elements that are all layered together to provide a very detailed and flexible interface for interacting with the JBoss ON servers and resources. To maximize its use of space, JBoss ON uses top navigation menus, tabbed browsing with subtabs, active links, and navigation trees to establish relationships between JBoss ON resources and JBoss ON functionality. In a very general view, several types of visual elements that work together to comprise the UI:
- The top menu
- The left menu tables
- The dashboard
- Resource-based tables, which can be for the resource inventory, a summary report, or the results of a search
- Configuration pages which both provide details for and access to elements in JBoss ON, including resources, groups, plug-ins, and JBoss ON server settings
All of these elements fit together in a repeated and reliable pattern.
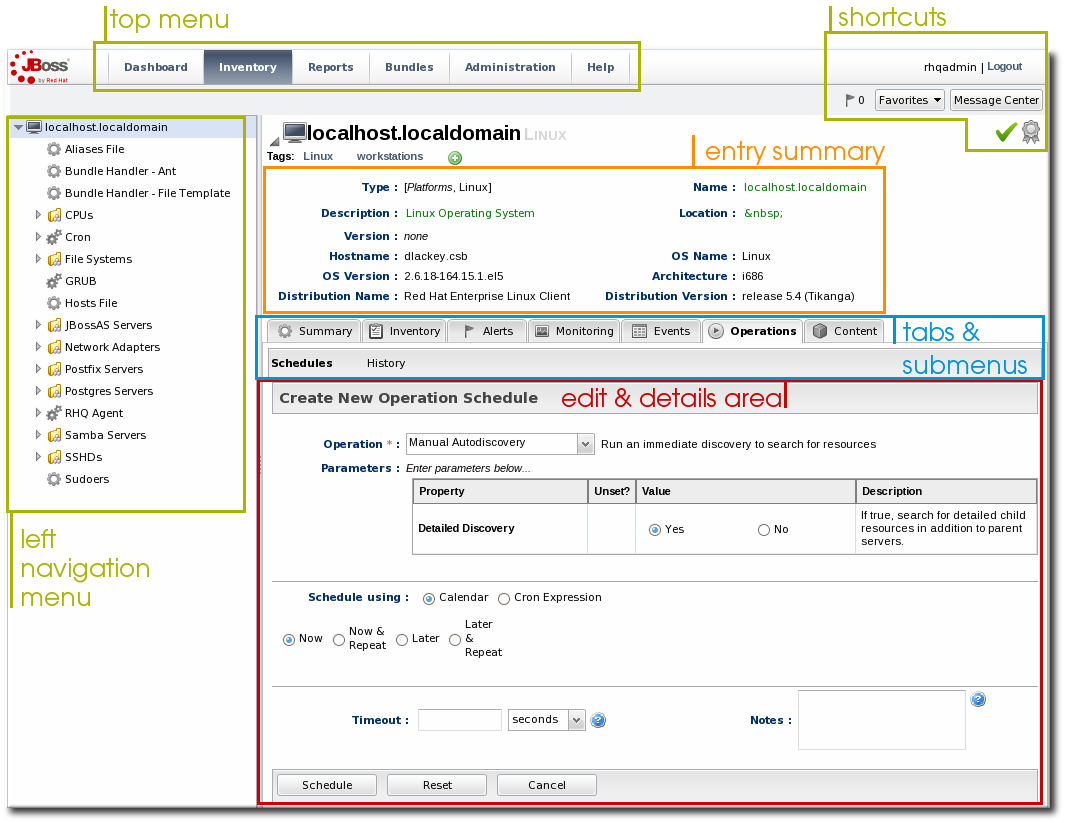
Figure 2. UI Elements All Together
Understanding the type of page that you're on can make it easier to navigate through the JBoss ON UI and can help you more completely understand what you can accomplish in JBoss ON.
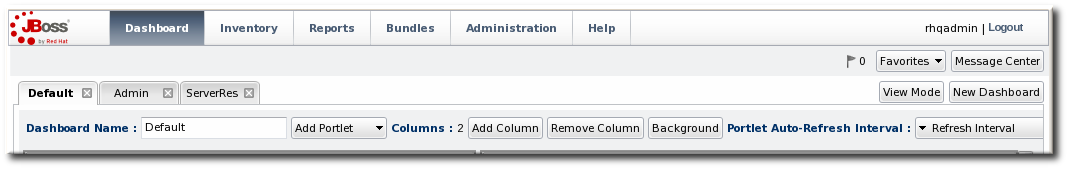
1.2.1. The Top Menu
At the very top of the JBoss ON UI is a menu bar with, with five tabs that go to the major configuration areas of JBoss ON.
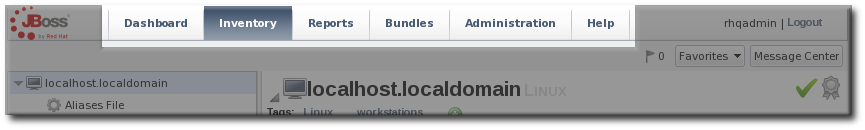
Figure 3. The Top Menu
Each menu item relates to a different functional aspect of JBoss ON.
- The Dashboard contains a global overview of JBoss ON and its resources. Different, configurable snapshot summaries (called portlets) show different aspects of the resources and server, such as the discovery queue, recent alerts, recent operations, and resource counts.
- The Inventory tab shows both resources and groups.
- The Reports tab shows pre-defined reports. These are slightly different than the Dashboard, which focuses exclusively on resource information: the reports look at the current actions of the different subsystem (or major functional areas) of JBoss ON, such as alerts, operations, metric collection, and configuration history.
- The Bundles tab opens the provisioning and content functional area. This is for uploading and deploying content bundles that are used to provision new applications.
- Administration goes to all areas related to configuring the JBoss ON server itself. This includes server settings, plug-ins, users and security, and agent settings.
1.2.2. The Left Menu
Rather than using drop-down or tabbed options, much of the configuration for JBoss ON is accessed through the left menu. There are individual tables that contain related areas of configuration, like users and groups, server configuration, server/agent connections, and content for the Administration area in Figure 4, “The Left Menu”.
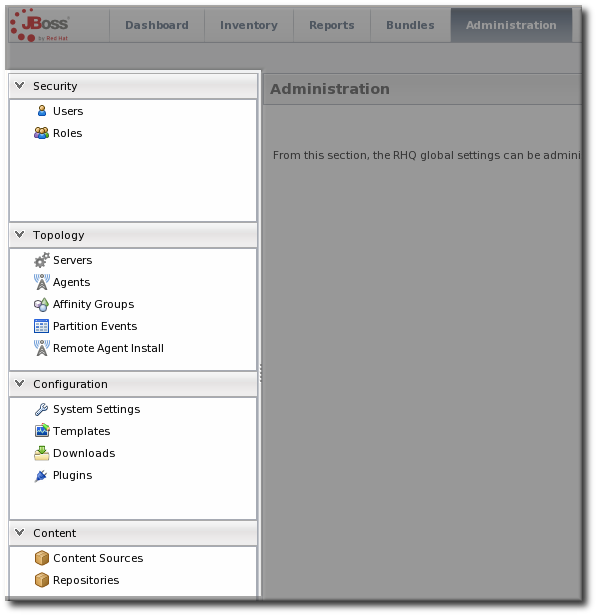
Figure 4. The Left Menu
Clicking the up or down arrows at the left of the menu tables collapses and expands the tables. This can make it easier to navigate the left menu.
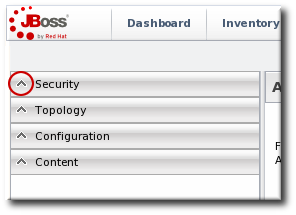
Figure 5. Collapsing the Left Menu
1.2.3. Dashboard
The Dashboard is an overview of everything in JBoss ON, from recent actions (fired alerts and operations) to availability reports to newly discovered and imported resources. This page, unlike any other area of JBoss ON, is customizable so it can be used to display only the collection of information that you want to see. Each table of information is called a portlet, a mini-portal into a view of the JBoss ON server or resources. There can be multiple Dashboard views configured, with different portlets or different layouts; these are accessed by tabs at the top of the Dashboard page.
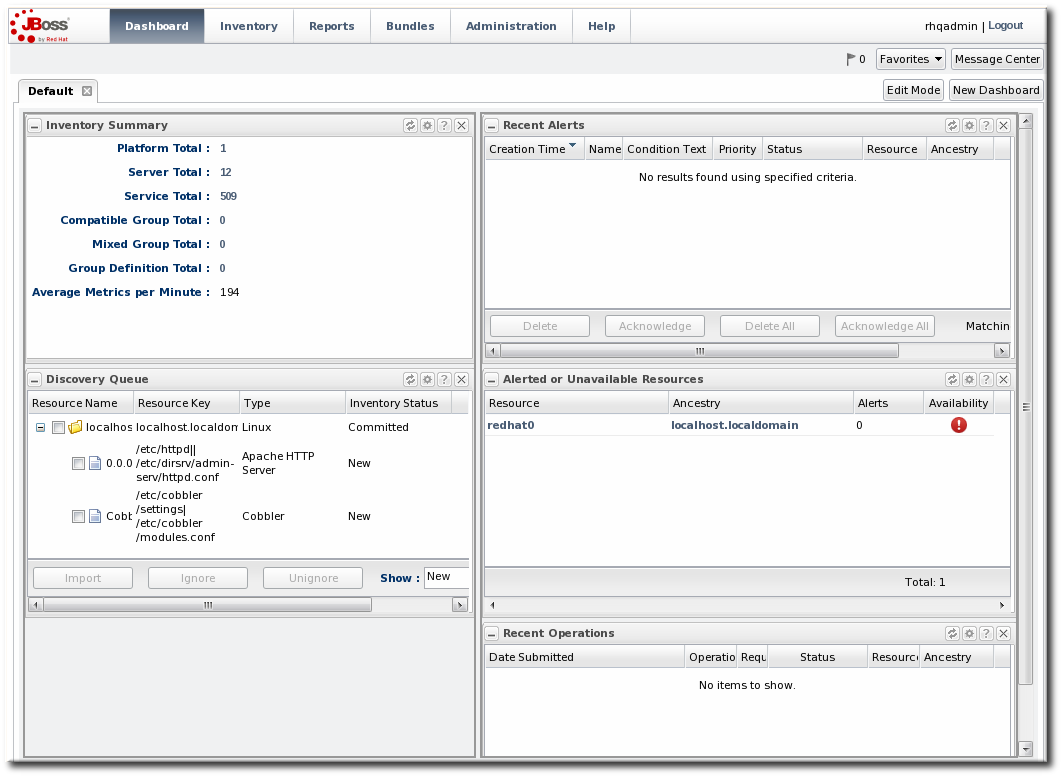
Figure 6. Dashboard View
The Dashboard is the landing page for JBoss ON, the first page that comes up after login.
1.2.4. Inventory Browsers and Summaries
Some pages are essentially long tables of information, presented in basically the same way:
- Tabs for different areas, with subtabs that further break down information
- A table of results
- Icons that open a configuration or task option for that specific entity
- Buttons that perform actions (create, delete, or some other specific action) on the entries; some of these buttons aren't active unless an entry is selected
The inventory interface in Figure 7, “Inventory Browser” is rich with functionality. The search bar for resources and groups uses a specialized syntax and flexible dynamic search. Hovering over any resource name gives a small popup message with more information about that resource. Clicking the name of the entry itself opens its default entry configuration page, while clicking the name of its parent opens up that parent resource's configuration page.
Figure 7. Inventory Browser
In Figure 7, “Inventory Browser”, the button is active because a resource is selected. If no entries are actively selected, activity buttons are grayed out.
1.2.5. Entry Details Pages
Possibly the most functionality-saturated area in JBoss ON is an entry's details page.
The left navigation area shows the hierarchy, both parents and children, of the selected resource. This makes it very easy to navigate among all of the different services and servers that affect a resource.
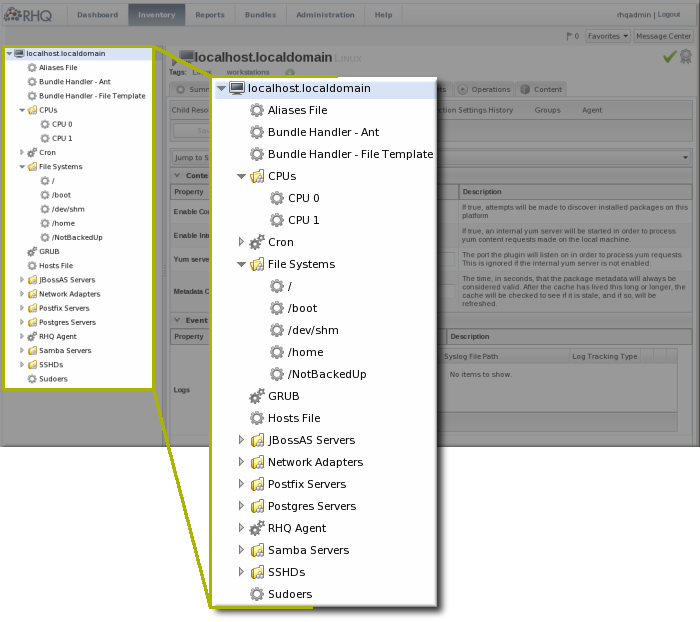
Figure 8. Resource Tree
Right-clicking any of the resources in the left navigation opens shortcuts to that entry's configuration.
Note
Resources have short names that are automatically assigned based on their type, instance or system name, or IP address. These names are used in the inventory and in the tree navigation.
The configuration area of a resource entry page (and other JBoss ON entities, like plug-ins and templates) has three information layers that provide all of the possible functionality and tasks available for that entry.
The entry's configuration page is tabbed according to each area that can be configured, and frequently has subtabs for additional configuration options and to show the history of that area (like fired alerts, previous content updates, or monitoring data).
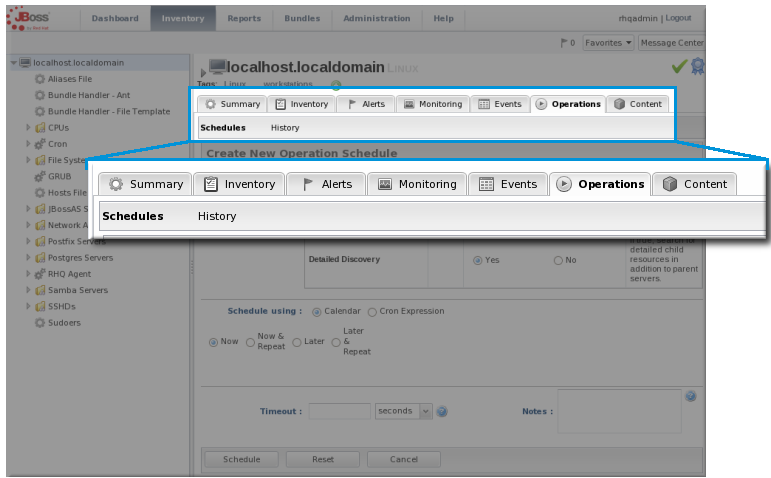
Figure 9. Tabs for a Resource Entry
The next section in the entry area shows lists of related configured entries for that task. For example, an Operations area will have a list of available operations in a table below the tabs. For Inventory, there is a list of configured child resources, while Alerts shows all of the configured alerts for that resource. All of those entries are listed in a table similar to the search results available in other parts of the JBoss ON UI.
Many elements are both a details page and an edit page. meaning that many fields are active automatically. This makes it possible to perform management tasks directly, without opening a separate page.
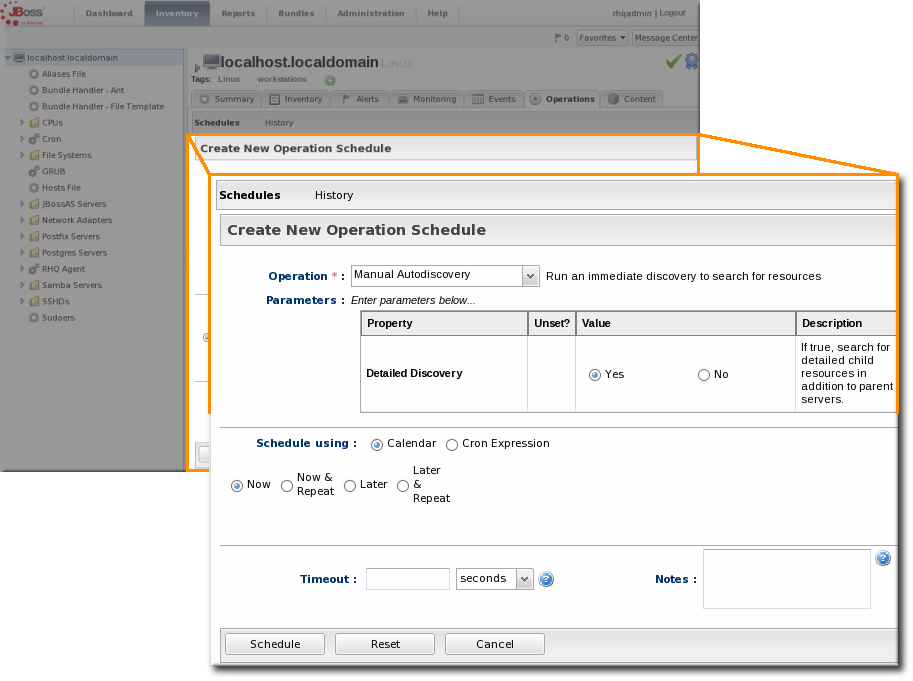
Figure 10. Editable Areas for a Resource Entry
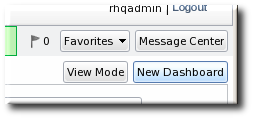
1.2.6. Shortcuts in the UI
To the far right of the top menu is a small cluster of icons that provide very quick, targeted insight into JBoss ON.
- The Message Center shows all notifications that have been sent by the JBoss ON server. This includes alerts, configuration changes, changes to the inventory, or error messages for the server or UI.
- The alerts area shows the total number of current alerts for all resources in the inventory.
- The Favorites button can be used to navigate to selected resources and groups quickly, while the little blue ribbon on resource pages can be used to add that resource to the favorites list.
- The resource available is shown as a green check mark if the resource is available and a red X if the resource is down.
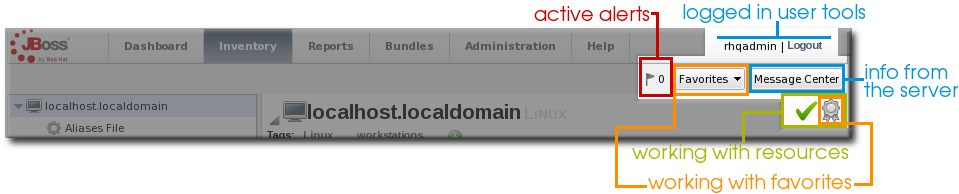
Figure 11. Shortcuts
1.3. Getting Notifications in the Message Center
The Message Center shows all of the messages that have been returned by the GUI for the current browser session. This includes any actions taken in the UI — like adding resources to the inventory, configuring resources, or uploading content — and it also includes any error messages that may have been returned during the session.
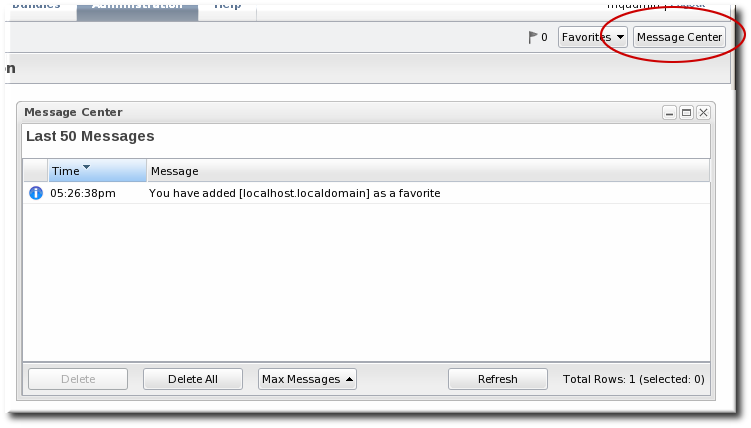
Figure 12. Message Center
1.4. Sorting and Changing Table Displays
Almost all of the information in JBoss ON is displayed in tables, from the resource inventory to the list of plug-ins for the agent. The SmartGWT UI has some versatility in how that table information is sorted and displayed.
A few tables use a very simple ascending/descending order based on the column being sorted, either numerically or alphabetically.
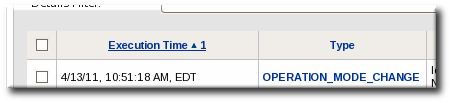
Figure 13. Basic Table Sorting on the Partition Events List
Most areas in the UI allow a more complex method of displaying information. As with basic tables, simply clicking a column name will sort that column in ascending/descending order. However, advanced GWT tables also have an option to change the table layout and sort options, by clicking a menu arrow at the right of the column.
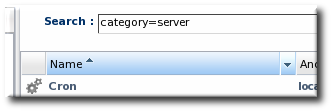
Figure 14. Basic Table Sorting on the Server Resources List
When a menu arrow is selected, the sort order for that column can be changed, or any other column. You can also change the column sizing and even the types of columns displayed. The options are generated dynamically, depending on what kind of entry is contained in the table.
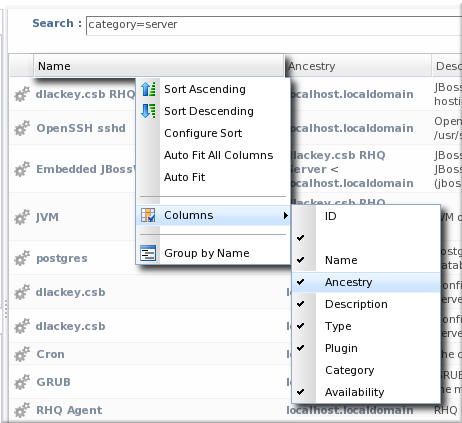
Figure 15. Advanced Table Sorting on the Server Resources List
The sort order can even be prioritized by specifying multiple criteria. For example, resources can be sorted by name, then by plug-in, then by ID. Since resources have standardized names, sorting by name or parent alone may not be specific enough to give a meaningful order to the entries; providing multiple, prioritized criteria can make the table display more accurate.
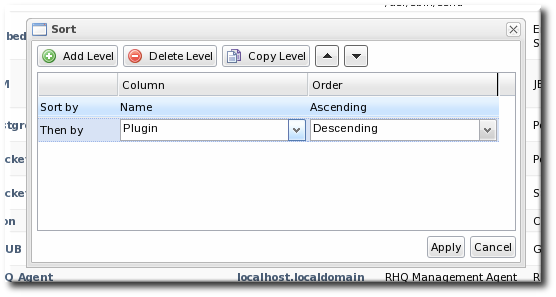
Figure 16. Changing the Sort Method
1.5. Customizing the Dashboard
The Dashboard is configurable. It is composed of individual portlets, and these portlets can be rearranged or independently refreshed through the icon menu displayed on each portlet. There can even be multiple Dashboards, with different portlets, which can be used to give different and specific views into JBoss ON and its resources.
Note
Dashboards are configured per user, not globally.
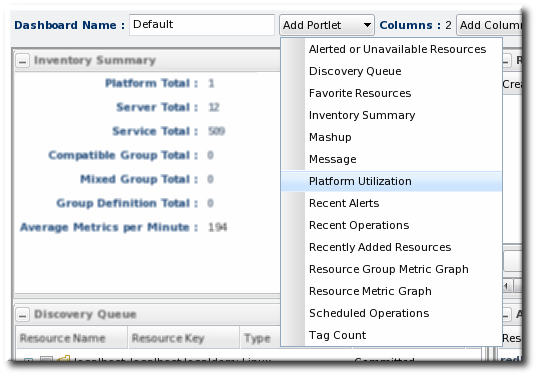
1.5.1. Editing Portlets
To move portlets within the Dashboard layout, use the arrows in the portlet tool bar. To get rid of a portlet in a current, click the minimize icon on the far left to collapse it or click the X icon on the far right to delete the portlet from the Dashboard entirely. Some types of portlet allow customization, which can be accessed by clicking the wrench icon.
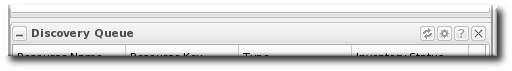
Figure 17. Portlet Icons
1.5.2. Adding and Editing Dashboards
The Dashboard page can actually contain multiple Dashboards, each with different portlets, column layouts, and refresh intervals. This makes it possible to get a logical grouping of information for a very fast assessment of the state of resources in JBoss ON. When multiple Dashboards are configured, they are displayed as tabs in the UI.
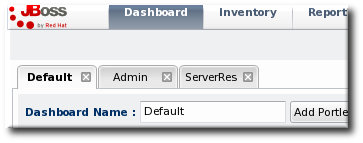
Figure 18. Tabbed Dashboards
To add a new Dashboard:
- Click the button in the far right of the main Dashboard.
Note
The process of editing and adding Dashboards is very similar. The only difference is that to edit a Dashboard, you click the button. - The new Dashboard opens in the edit mode. Enter a name for the new Dashboard.
- Add the desired portlets to the Dashboard. If necessary, change the number of columns to fit the number of portlets.
1.6. Setting Favorites
Using favorites makes it easy to navigate to resources that administrators need to access routinely for configuration updates, monitoring, or alerting.
Each resource has a small ribbon icon in the upper right corner of its details page. Clicking that icon automatically adds it to the resource favorites list.
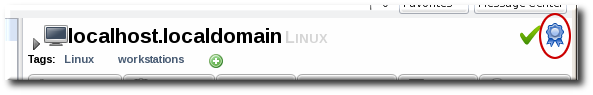
Figure 19. Favorites Icon
The resource and group favorites are listed in the in the shortcuts on the right of the top menu. Clicking a resource on that list automatically opens its details page without having to search for the resource. Because multiple resources may share a name or some properties, the Favorites list includes a hover with more details about the resource so you can select the right one.
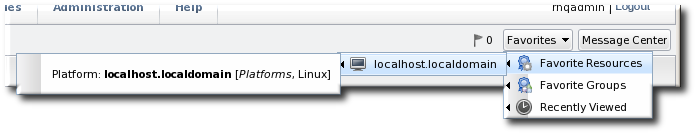
Figure 20. Favorites List
1.7. Deleting Entries
Resource-related entries can be deleted through the inventory browser or group browser. Most JBoss ON server configuration entries cannot be deleted. Only user-supplied elements, like plug-ins, content, roles, and users, can be deleted.
If an item can be deleted, then a delete button is available in the table list or details page for that item.
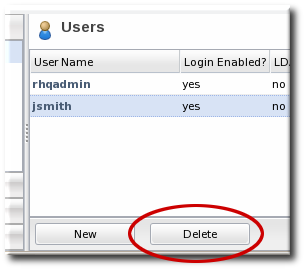
Figure 21. Delete Button in the Area Browser
Note
A user may have the right to change something, but that does not implicitly grant the right to delete something. For example, users with the configuration write permission can edit resource configuration and view configuration history and settings, but they cannot delete elements in the configuration history. Similar constraints are true for users with permission to create and edit operations and alerts — there is no right to delete elements in the resource history.
Deleting elements in the history requires the manage inventory permission.