Monitoring
Monitoring projects on Red Hat OpenShift Service on AWS
Abstract
Chapter 1. About monitoring
1.1. About Red Hat OpenShift Service on AWS monitoring
Red Hat OpenShift Service on AWS includes a preconfigured, preinstalled, and self-updating monitoring stack that provides monitoring for core platform components. You also have the option to enable monitoring for user-defined projects.
A cluster administrator can configure the monitoring stack with the supported configurations. Red Hat OpenShift Service on AWS delivers monitoring best practices out of the box.
A set of alerts are included by default that immediately notify administrators about issues with a cluster. Default dashboards in the Red Hat OpenShift Service on AWS web console include visual representations of cluster metrics to help you to quickly understand the state of your cluster. With the Red Hat OpenShift Service on AWS web console, you can access metrics and manage alerts.
After installing Red Hat OpenShift Service on AWS, cluster administrators can optionally enable monitoring for user-defined projects. By using this feature, cluster administrators, developers, and other users can specify how services and pods are monitored in their own projects. As a cluster administrator, you can find answers to common problems such as user metrics unavailability and high consumption of disk space by Prometheus in Troubleshooting monitoring issues.
1.2. Monitoring stack architecture
The Red Hat OpenShift Service on AWS monitoring stack is based on the Prometheus open source project and its wider ecosystem. You can learn about the monitoring stack architecture, which includes default monitoring components and components for monitoring user-defined projects.
1.2.1. Understanding the monitoring stack
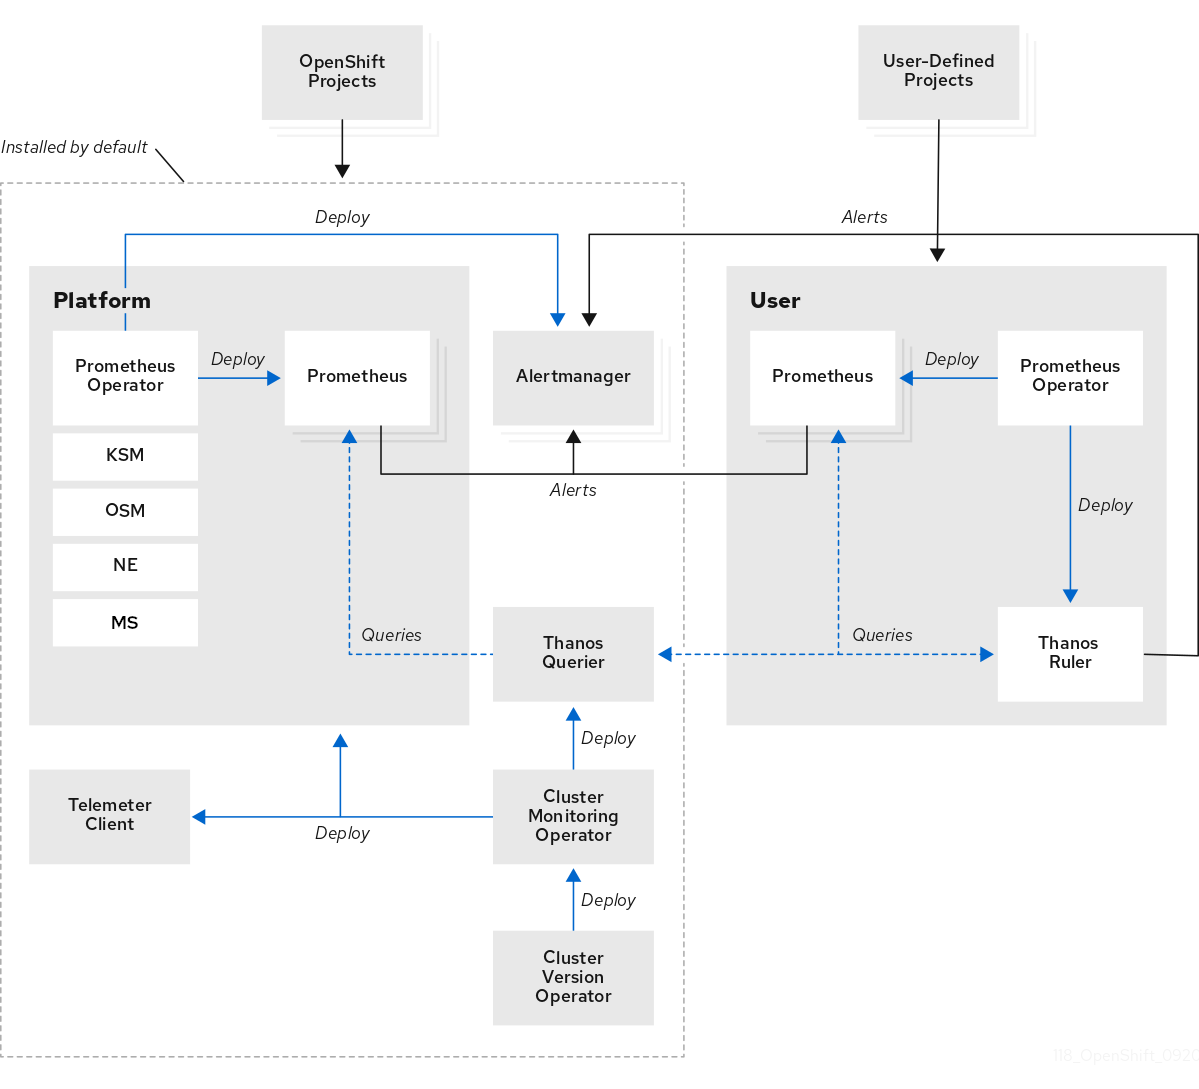
The monitoring stack includes the following components:
- Default platform monitoring components
A set of platform monitoring components are installed in the
openshift-monitoringproject by default during an Red Hat OpenShift Service on AWS installation. This provides monitoring for core cluster components including Kubernetes services. The default monitoring stack also enables remote health monitoring for clusters.You can see these components in the Installed by default section in the following diagram.
- Components for monitoring user-defined projects
If you enable monitoring for user-defined projects, additional monitoring components are installed in the
openshift-user-workload-monitoringproject. This provides optional monitoring for user-defined projects.You can see these components in the User section in the following diagram.
1.2.2. Default monitoring components
By default, the Red Hat OpenShift Service on AWS 4 monitoring stack includes the following components:
| Component | Description |
|---|---|
| Cluster Monitoring Operator | The Cluster Monitoring Operator (CMO) is a central component of the monitoring stack. It deploys, manages, and automatically updates Prometheus and Alertmanager instances, Thanos Querier, Telemeter Client, and metrics targets. The CMO is deployed by the Cluster Version Operator (CVO). |
| Prometheus Operator |
The Prometheus Operator in the |
| Prometheus | The Red Hat OpenShift Service on AWS monitoring stack is based on the Prometheus monitoring system. Prometheus is a time-series database and a rule evaluation engine for metrics. Prometheus sends alerts to Alertmanager for processing. |
| Metrics Server |
The Metrics Server component (MS in the preceding diagram) collects resource metrics and exposes them in the |
| Alertmanager | The Alertmanager service handles alerts received from Prometheus. Alertmanager is also responsible for sending the alerts to external notification systems. |
| kube-state-metrics agent | The kube-state-metrics exporter agent (KSM in the preceding diagram) converts Kubernetes objects to metrics that Prometheus can use. |
| monitoring-plugin | The monitoring-plugin dynamic plugin component deploys the monitoring pages in the Observe section of the Red Hat OpenShift Service on AWS web console. You can use Cluster Monitoring Operator config map settings to manage monitoring-plugin resources for the web console pages. |
| openshift-state-metrics agent | The openshift-state-metrics exporter (OSM in the preceding diagram) expands upon kube-state-metrics by adding metrics for Red Hat OpenShift Service on AWS-specific resources. |
| node-exporter agent | The node-exporter agent (NE in the preceding diagram) collects metrics about every node in a cluster. The node-exporter agent is deployed on every node. |
| Thanos Querier | Thanos Querier aggregates and optionally deduplicates core Red Hat OpenShift Service on AWS metrics and metrics for user-defined projects under a single, multi-tenant interface. |
| Telemeter Client | Telemeter Client sends a subsection of the data from platform Prometheus instances to Red Hat to enable remote health monitoring for clusters. |
The monitoring stack monitors all components within the stack. The components are automatically updated when Red Hat OpenShift Service on AWS is updated.
1.2.2.1. Default monitoring targets
In addition to the components of the stack itself, the default monitoring stack monitors additional platform components.
The following are examples of monitoring targets:
- CoreDNS
- etcd
- HAProxy
- Image registry
- Kubelets
- Kubernetes API server
- Kubernetes controller manager
- Kubernetes scheduler
- OpenShift API server
- OpenShift Controller Manager
- Operator Lifecycle Manager (OLM)
- The exact list of targets can vary depending on your cluster capabilities and installed components.
- Each Red Hat OpenShift Service on AWS component is responsible for its monitoring configuration. For problems with the monitoring of an Red Hat OpenShift Service on AWS component, open a Jira issue against that component, not against the general monitoring component.
Other Red Hat OpenShift Service on AWS framework components might be exposing metrics as well. For details, see their respective documentation.
1.2.3. Components for monitoring user-defined projects
Red Hat OpenShift Service on AWS includes an optional enhancement to the monitoring stack that helps you monitor services and pods in user-defined projects. This feature includes the following components:
| Component | Description |
|---|---|
| Prometheus Operator |
The Prometheus Operator in the |
| Prometheus | Prometheus is the monitoring system that provides monitoring for user-defined projects. Prometheus sends alerts to Alertmanager for processing. |
| Thanos Ruler | The Thanos Ruler is a rule evaluation engine for Prometheus that is deployed as a separate process. In Red Hat OpenShift Service on AWS , Thanos Ruler provides rule and alerting evaluation for the monitoring of user-defined projects. |
| Alertmanager | The Alertmanager service handles alerts received from Prometheus and Thanos Ruler. Alertmanager is also responsible for sending user-defined alerts to external notification systems. Deploying this service is optional. |
The components in the preceding table are deployed after you enable monitoring for user-defined projects.
The monitoring stack monitors all components for user-defined projects. The components are automatically updated when Red Hat OpenShift Service on AWS is updated.
1.2.3.1. Monitoring targets for user-defined projects
When monitoring is enabled for user-defined projects, you can monitor:
- Metrics provided through service endpoints in user-defined projects.
- Pods running in user-defined projects.
1.2.4. The monitoring stack in high-availability clusters
By default, in multi-node clusters, the following components run in high-availability (HA) mode to prevent data loss and service interruption:
- Prometheus
- Alertmanager
- Thanos Ruler
- Thanos Querier
- Metrics Server
- Monitoring plugin
The component is replicated across two pods, each running on a separate node. This means that the monitoring stack can tolerate the loss of one pod.
- Prometheus in HA mode
- Both replicas independently scrape the same targets and evaluate the same rules.
- The replicas do not communicate with each other. Therefore, data might differ between the pods.
- Alertmanager in HA mode
- The two replicas synchronize notification and silence states with each other. This ensures that each notification is sent at least once.
- If the replicas fail to communicate or if there is an issue on the receiving side, notifications are still sent, but they might be duplicated.
Prometheus, Alertmanager, and Thanos Ruler are stateful components. To ensure high availability, you must configure them with persistent storage.
1.2.5. TLS security and rotation in the monitoring stack
Learn how TLS profiles and certificate rotation work in the Red Hat OpenShift Service on AWS monitoring stack to keep communication secure.
- TLS security profiles for monitoring components
-
All components of the monitoring stack use the TLS security profile settings that are centrally configured by a cluster administrator. The monitoring stack component uses the TLS security profile settings that already exist in the
tlsSecurityProfilefield in the global Red Hat OpenShift Service on AWSapiservers.config.openshift.io/clusterresource. - TLS certificate rotation and automatic restarts
The Cluster Monitoring Operator manages the internal TLS certificate lifecycle for the monitoring components. These certificates secure the internal communication between the monitoring components.
During certificate rotation, the CMO updates secrets and config maps, which triggers automatic restarts of affected pods. This is an expected behavior, and the pods recover automatically.
The following example shows events that occur during certificate rotation:
$ oc get events -n openshift-monitoring

LAST SEEN   TYPE      REASON              OBJECT                                   MESSAGE
2h39m       Normal    SecretUpdated       deployment/cluster-monitoring-operator   Updated Secret/grpc-tls -n openshift-monitoring because it changed
2h39m       Normal    SecretCreated       deployment/cluster-monitoring-operator   Created Secret/prometheus-user-workload-grpc-tls -n openshift-user-workload-monitoring because it was missing
2h39m       Normal    SecretCreated       deployment/cluster-monitoring-operator   Created Secret/thanos-querier-grpc-tls -n openshift-monitoring because it was missing
2h39m       Normal    SecretCreated       deployment/cluster-monitoring-operator   Created Secret/thanos-ruler-grpc-tls -n openshift-user-workload-monitoring because it was missing
2h39m       Normal    SecretCreated       deployment/cluster-monitoring-operator   Created Secret/prometheus-k8s-grpc-tls -n openshift-monitoring because it was missing
2h38m       Warning   FailedMount         pod/prometheus-k8s-0                     MountVolume.SetUp failed for volume "secret-grpc-tls" : secret "prometheus-k8s-grpc-tls" not found
2h39m       Normal    Created             pod/prometheus-k8s-0                     Created container kube-rbac-proxy-thanos
2h39m       Normal    Started             pod/prometheus-k8s-0                     Started container kube-rbac-proxy-thanos
2h39m       Normal    SuccessfulDelete    statefulset/prometheus-k8s               delete Pod prometheus-k8s-0 in StatefulSet prometheus-k8s successful
2h39m       Normal    SuccessfulCreate    statefulset/prometheus-k8s               create Pod prometheus-k8s-0 in StatefulSet prometheus-k8s successful
1.2.6. Glossary of common terms for Red Hat OpenShift Service on AWS monitoring
This glossary defines common terms that are used in Red Hat OpenShift Service on AWS architecture.
- Alertmanager
- Alertmanager handles alerts received from Prometheus. Alertmanager is also responsible for sending the alerts to external notification systems.
- Alerting rules
- Alerting rules contain a set of conditions that outline a particular state within a cluster. Alerts are triggered when those conditions are true. An alerting rule can be assigned a severity that defines how the alerts are routed.
- Cluster Monitoring Operator
- The Cluster Monitoring Operator (CMO) is a central component of the monitoring stack. It deploys and manages Prometheus instances such as, the Thanos Querier, the Telemeter Client, and metrics targets to ensure that they are up to date. The CMO is deployed by the Cluster Version Operator (CVO).
- Cluster Version Operator
- The Cluster Version Operator (CVO) manages the lifecycle of cluster Operators, many of which are installed in Red Hat OpenShift Service on AWS by default.
- config map
-
A config map provides a way to inject configuration data into pods. You can reference the data stored in a config map in a volume of type
ConfigMap. Applications running in a pod can use this data. - Container
- A container is a lightweight and executable image that includes software and all its dependencies. Containers virtualize the operating system. As a result, you can run containers anywhere from a data center to a public or private cloud as well as a developer’s laptop.
- custom resource (CR)
- A CR is an extension of the Kubernetes API. You can create custom resources.
- etcd
- etcd is the key-value store for Red Hat OpenShift Service on AWS, which stores the state of all resource objects.
- Kubelets
- Runs on nodes and reads the container manifests. Ensures that the defined containers have started and are running.
- Kubernetes API server
- Kubernetes API server validates and configures data for the API objects.
- Kubernetes controller manager
- Kubernetes controller manager governs the state of the cluster.
- Kubernetes scheduler
- Kubernetes scheduler allocates pods to nodes.
- labels
- Labels are key-value pairs that you can use to organize and select subsets of objects such as a pod.
- Metrics Server
-
The Metrics Server monitoring component collects resource metrics and exposes them in the
metrics.k8s.ioMetrics API service for use by other tools and APIs, which frees the core platform Prometheus stack from handling this functionality. - node
- A compute machine in the Red Hat OpenShift Service on AWS cluster. A node is either a virtual machine (VM) or a physical machine.
- Operator
- The preferred method of packaging, deploying, and managing a Kubernetes application in your Red Hat OpenShift Service on AWS cluster. An Operator takes human operational knowledge and encodes it into software that is packaged and shared with customers.
- Operator Lifecycle Manager (OLM)
- OLM helps you install, update, and manage the lifecycle of Kubernetes native applications. OLM is an open source toolkit designed to manage Operators in an effective, automated, and scalable way.
- Persistent storage
- Stores the data even after the device is shut down. Kubernetes uses persistent volumes to store the application data.
- Persistent volume claim (PVC)
- You can use a PVC to mount a PersistentVolume into a Pod. You can access the storage without knowing the details of the cloud environment.
- pod
- The pod is the smallest logical unit in Kubernetes. A pod is comprised of one or more containers to run in a worker node.
- Prometheus
- Prometheus is the monitoring system on which the Red Hat OpenShift Service on AWS monitoring stack is based. Prometheus is a time-series database and a rule evaluation engine for metrics. Prometheus sends alerts to Alertmanager for processing.
- Prometheus Operator
-
The Prometheus Operator in the
openshift-monitoringproject creates, configures, and manages platform Prometheus and Alertmanager instances. It also automatically generates monitoring target configurations based on Kubernetes label queries. - Silences
- A silence can be applied to an alert to prevent notifications from being sent when the conditions for an alert are true. You can mute an alert after the initial notification, while you work on resolving the underlying issue.
- storage
- Red Hat OpenShift Service on AWS supports many types of storage on AWS. You can manage container storage for persistent and non-persistent data in your Red Hat OpenShift Service on AWS cluster.
- Thanos Ruler
- The Thanos Ruler is a rule evaluation engine for Prometheus that is deployed as a separate process. In Red Hat OpenShift Service on AWS, Thanos Ruler provides rule and alerting evaluation for the monitoring of user-defined projects.
- Vector
- Vector is a log collector that deploys to each Red Hat OpenShift Service on AWS node. It collects log data from each node, transforms the data, and forwards it to configured outputs.
- web console
- A user interface (UI) to manage Red Hat OpenShift Service on AWS.
1.3. Understanding the monitoring stack - key concepts
Get familiar with the Red Hat OpenShift Service on AWS monitoring concepts and terms. Learn about how you can improve performance and scale of your cluster, store and record data, manage metrics and alerts, and more.
1.3.1. About performance and scalability
You can optimize the performance and scale of your clusters. You can configure the monitoring stack by performing any of the following actions:
Control the placement and distribution of monitoring components:
- Use node selectors to move components to specific nodes.
- Assign tolerations to enable moving components to tainted nodes.
- Use pod topology spread constraints.
- Manage CPU and memory resources.
- Set the body size limit for metrics scraping.
- Use metrics collection profiles.
1.3.1.1. Using node selectors to move monitoring components
By using the nodeSelector constraint with labeled nodes, you can move any of the monitoring stack components to specific nodes. By doing so, you can control the placement and distribution of the monitoring components across a cluster.
By controlling placement and distribution of monitoring components, you can optimize system resource use, improve performance, and separate workloads based on specific requirements or policies.
How node selectors work with other constraints
If you move monitoring components by using node selector constraints, be aware that other constraints to control pod scheduling might exist for a cluster:
- Topology spread constraints might be in place to control pod placement.
- Hard anti-affinity rules are in place for Prometheus, Alertmanager, and other monitoring components to ensure that multiple pods for these components are always spread across different nodes and are therefore always highly available.
When scheduling pods onto nodes, the pod scheduler tries to satisfy all existing constraints when determining pod placement. That is, all constraints compound when the pod scheduler determines which pods will be placed on which nodes.
Therefore, if you configure a node selector constraint but existing constraints cannot all be satisfied, the pod scheduler cannot match all constraints and will not schedule a pod for placement onto a node.
To maintain resilience and high availability for monitoring components, ensure that enough nodes are available and match all constraints when you configure a node selector constraint to move a component.
1.3.1.2. About pod topology spread constraints for monitoring
You can use pod topology spread constraints to control how the monitoring pods are spread across a network topology when Red Hat OpenShift Service on AWS pods are deployed in multiple availability zones.
Pod topology spread constraints are suitable for controlling pod scheduling within hierarchical topologies in which nodes are spread across different infrastructure levels, such as regions and zones within those regions. Additionally, by being able to schedule pods in different zones, you can improve network latency in certain scenarios.
You can configure pod topology spread constraints for all the pods deployed by the Cluster Monitoring Operator to control how pod replicas are scheduled to nodes across zones. This ensures that the pods are highly available and run more efficiently, because workloads are spread across nodes in different data centers or hierarchical infrastructure zones.
1.3.1.3. About specifying limits and requests for monitoring components
You can configure resource limits and requests for the following core platform monitoring components:
- Alertmanager
- kube-state-metrics
- monitoring-plugin
- node-exporter
- openshift-state-metrics
- Prometheus
- Metrics Server
- Prometheus Operator and its admission webhook service
- Telemeter Client
- Thanos Querier
You can configure resource limits and requests for the following components that monitor user-defined projects:
- Alertmanager
- Prometheus
- Thanos Ruler
By defining the resource limits, you limit a container’s resource usage, which prevents the container from exceeding the specified maximum values for CPU and memory resources.
By defining the resource requests, you specify that a container can be scheduled only on a node that has enough CPU and memory resources available to match the requested resources.
1.3.1.4. About metrics collection profiles
By default, Prometheus collects metrics exposed by all default metrics targets in Red Hat OpenShift Service on AWS components. However, you might want Prometheus to collect fewer metrics from a cluster in certain scenarios:
- If cluster administrators require only alert, telemetry, and console metrics and do not require other metrics to be available.
- If a cluster increases in size, and the increased size of the default metrics data collected now requires a significant increase in CPU and memory resources.
You can use a metrics collection profile to collect either the default amount of metrics data or a minimal amount of metrics data. When you collect minimal metrics data, basic monitoring features such as alerting continue to work. At the same time, the CPU and memory resources required by Prometheus decrease.
You can enable one of two metrics collection profiles:
- full: Prometheus collects metrics data exposed by all platform components. This setting is the default.
- minimal: Prometheus collects only the metrics data required for platform alerts, recording rules, telemetry, and console dashboards.
1.3.2. About storing and recording data
You can store and record data to help you protect the data and use them for troubleshooting. You can configure the monitoring stack by performing any of the following actions:
Configure persistent storage:
- Protect your metrics and alerting data from data loss by storing them in a persistent volume (PV). As a result, they can survive pods being restarted or recreated.
- Avoid getting duplicate notifications and losing silences for alerts when the Alertmanager pods are restarted.
- Modify the retention time and size for Prometheus and Thanos Ruler metrics data.
Configure logging to help you troubleshoot issues with your cluster:
- Configure audit logs for Metrics Server.
- Set log levels for monitoring.
- Enable the query logging for Prometheus and Thanos Querier.
1.3.2.1. Retention time and size for Prometheus metrics
By default, Prometheus retains metrics data for the following durations:
- Core platform monitoring: 15 days
- Monitoring for user-defined projects: 24 hours
You can modify the retention time for the Prometheus instance to change how soon the data is deleted. You can also set the maximum amount of disk space the retained metrics data uses. If the data reaches this size limit, Prometheus deletes the oldest data first until the disk space used is again below the limit.
Note the following behaviors of these data retention settings:
-
The size-based retention policy applies to all data block directories in the
/prometheusdirectory, including persistent blocks, write-ahead log (WAL) data, and m-mapped chunks. -
Data in the
/waland/head_chunksdirectories counts toward the retention size limit, but Prometheus never purges data from these directories based on size- or time-based retention policies. Thus, if you set a retention size limit lower than the maximum size set for the/waland/head_chunksdirectories, you have configured the system not to retain any data blocks in the/prometheusdata directories. - The size-based retention policy is applied only when Prometheus cuts a new data block, which occurs every two hours after the WAL contains at least three hours of data.
-
If you do not explicitly define values for either
retentionorretentionSize, retention time defaults to 15 days for core platform monitoring and 24 hours for user-defined project monitoring. Retention size is not set. -
If you define values for both
retentionandretentionSize, both values apply. If any data blocks exceed the defined retention time or the defined size limit, Prometheus purges these data blocks. -
If you define a value for
retentionSizeand do not defineretention, only theretentionSizevalue applies. -
If you do not define a value for
retentionSizeand only define a value forretention, only theretentionvalue applies. -
If you set the
retentionSizeorretentionvalue to0, the default settings apply. The default settings set retention time to 15 days for core platform monitoring and 24 hours for user-defined project monitoring. By default, retention size is not set.
Data compaction occurs every two hours. Therefore, a persistent volume (PV) might fill up before compaction, potentially exceeding the retentionSize limit. In such cases, the KubePersistentVolumeFillingUp alert fires until the space on a PV is lower than the retentionSize limit.
1.3.3. Understanding metrics
In Red Hat OpenShift Service on AWS, cluster components are monitored by scraping metrics exposed through service endpoints. You can also configure metrics collection for user-defined projects. Metrics enable you to monitor how cluster components and your own workloads are performing.
You can define the metrics that you want to provide for your own workloads by using Prometheus client libraries at the application level.
In Red Hat OpenShift Service on AWS, metrics are exposed through an HTTP service endpoint under the /metrics canonical name. You can list all available metrics for a service by running a curl query against http://<endpoint>/metrics. For instance, you can expose a route to the prometheus-example-app example application and then run the following to view all of its available metrics:
$ curl http://<example_app_endpoint>/metricsExample output
# HELP http_requests_total Count of all HTTP requests
# TYPE http_requests_total counter
http_requests_total{code="200",method="get"} 4
http_requests_total{code="404",method="get"} 2
# HELP version Version information about this binary
# TYPE version gauge
version{version="v0.1.0"} 11.3.3.1. Controlling the impact of unbound metrics attributes in user-defined projects
Developers can create labels to define attributes for metrics in the form of key-value pairs. The number of potential key-value pairs corresponds to the number of possible values for an attribute. An attribute that has an unlimited number of potential values is called an unbound attribute. For example, a customer_id attribute is unbound because it has an infinite number of possible values.
Every assigned key-value pair has a unique time series. The use of many unbound attributes in labels can result in an exponential increase in the number of time series created. This can impact Prometheus performance and can consume a lot of disk space.
Cluster administrators can use the following measures to control the impact of unbound metrics attributes in user-defined projects:
- Limit the number of samples that can be accepted per target scrape in user-defined projects
- Limit the number of scraped labels, the length of label names, and the length of label values
- Configure the intervals between consecutive scrapes and between Prometheus rule evaluations
- Create alerts that fire when a scrape sample threshold is reached or when the target cannot be scraped
Limiting scrape samples can help prevent the issues caused by adding many unbound attributes to labels. Developers can also prevent the underlying cause by limiting the number of unbound attributes that they define for metrics. Using attributes that are bound to a limited set of possible values reduces the number of potential key-value pair combinations.
1.3.3.2. Adding cluster ID labels to metrics
If you manage multiple Red Hat OpenShift Service on AWS clusters and use the remote write feature to send metrics data from these clusters to an external storage location, you can add cluster ID labels to identify the metrics data coming from different clusters. You can then query these labels to identify the source cluster for a metric and distinguish that data from similar metrics data sent by other clusters.
This way, if you manage many clusters for multiple customers and send metrics data to a single centralized storage system, you can use cluster ID labels to query metrics for a particular cluster or customer.
Creating and using cluster ID labels involves three general steps:
- Configuring the write relabel settings for remote write storage.
- Adding cluster ID labels to the metrics.
- Querying these labels to identify the source cluster or customer for a metric.
1.3.4. About monitoring dashboards
Red Hat OpenShift Service on AWS provides a set of monitoring dashboards that help you understand the state of cluster components and user-defined workloads.
Starting with Red Hat OpenShift Service on AWS 4.19, the perspectives in the web console have unified. The Developer perspective is no longer enabled by default.
All users can interact with all Red Hat OpenShift Service on AWS web console features. However, if you are not the cluster owner, you might need to request permission to access certain features from the cluster owner.
You can still enable the Developer perspective. On the Getting Started pane in the web console, you can take a tour of the console, find information on setting up your cluster, view a quick start for enabling the Developer perspective, and follow links to explore new features and capabilities.
As an administrator, you can access dashboards for the core Red Hat OpenShift Service on AWS components, including the following items:
- API performance
- etcd
- Kubernetes compute resources
- Kubernetes network resources
- Prometheus
- USE method dashboards relating to cluster and node performance
- Node performance metrics
1.3.5. Managing alerts
In the Red Hat OpenShift Service on AWS, the Alerting UI enables you to manage alerts, silences, and alerting rules.
- Alerting rules. Alerting rules contain a set of conditions that outline a particular state within a cluster. Alerts are triggered when those conditions are true. An alerting rule can be assigned a severity that defines how the alerts are routed.
- Alerts. An alert is fired when the conditions defined in an alerting rule are true. Alerts provide a notification that a set of circumstances are apparent within your Red Hat OpenShift Service on AWS cluster.
- Silences. A silence can be applied to an alert to prevent notifications from being sent when the conditions for an alert are true. You can mute an alert after the initial notification, while you work on resolving the issue.
The alerts, silences, and alerting rules that are available in the Alerting UI relate to the projects that you have access to. For example, if you are logged in as a user with the cluster-admin role, you can access all alerts, silences, and alerting rules.
1.3.5.1. Managing silences
You can create a silence for an alert in the Red Hat OpenShift Service on AWS web console. After you create a silence, you will not receive notifications about an alert when the alert fires.
Creating silences is useful in scenarios where you have received an initial alert notification, and you do not want to receive further notifications during the time in which you resolve the underlying issue causing the alert to fire.
When creating a silence, you must specify whether it becomes active immediately or at a later time. You must also set a duration period after which the silence expires.
After you create silences, you can view, edit, and expire them.
When you create silences, they are replicated across Alertmanager pods. However, if you do not configure persistent storage for Alertmanager, silences might be lost. This can happen, for example, if all Alertmanager pods restart at the same time.
1.3.5.2. Managing alerting rules for core platform monitoring
The Red Hat OpenShift Service on AWS monitoring includes a large set of default alerting rules for platform metrics. As a cluster administrator, you can customize this set of rules in two ways:
-
Modify the settings for existing platform alerting rules by adjusting thresholds or by adding and modifying labels. For example, you can change the
severitylabel for an alert fromwarningtocriticalto help you route and triage issues flagged by an alert. -
Define and add new custom alerting rules by constructing a query expression based on core platform metrics in the
openshift-monitoringnamespace.
Core platform alerting rule considerations
- New alerting rules must be based on the default Red Hat OpenShift Service on AWS monitoring metrics.
-
You must create the
AlertingRuleandAlertRelabelConfigobjects in theopenshift-monitoringnamespace. - You can only add and modify alerting rules. You cannot create new recording rules or modify existing recording rules.
-
If you modify existing platform alerting rules by using an
AlertRelabelConfigobject, your modifications are not reflected in the Prometheus alerts API. Therefore, any dropped alerts still appear in the Red Hat OpenShift Service on AWS web console even though they are no longer forwarded to Alertmanager. Additionally, any modifications to alerts, such as a changedseveritylabel, do not appear in the web console.
1.3.5.3. Tips for optimizing alerting rules for core platform monitoring
If you customize core platform alerting rules to meet your organization’s specific needs, follow these guidelines to help ensure that the customized rules are efficient and effective.
- Minimize the number of new rules. Create only rules that are essential to your specific requirements. By minimizing the number of rules, you create a more manageable and focused alerting system in your monitoring environment.
- Focus on symptoms rather than causes. Create rules that notify users of symptoms instead of underlying causes. This approach ensures that users are promptly notified of a relevant symptom so that they can investigate the root cause after an alert has triggered. This tactic also significantly reduces the overall number of rules you need to create.
- Plan and assess your needs before implementing changes. First, decide what symptoms are important and what actions you want users to take if these symptoms occur. Then, assess existing rules and decide if you can modify any of them to meet your needs instead of creating entirely new rules for each symptom. By modifying existing rules and creating new ones judiciously, you help to streamline your alerting system.
- Provide clear alert messaging. When you create alert messages, describe the symptom, possible causes, and recommended actions. Include unambiguous, concise explanations along with troubleshooting steps or links to more information. Doing so helps users quickly assess the situation and respond appropriately.
- Include severity levels. Assign severity levels to your rules to indicate how a user needs to react when a symptom occurs and triggers an alert. For example, classifying an alert as Critical signals that an individual or a critical response team needs to respond immediately. By defining severity levels, you help users know how to respond to an alert and help ensure that the most urgent issues receive prompt attention.
1.3.5.4. Creating alerting rules for user-defined projects
In Red Hat OpenShift Service on AWS, you can create alerting rules for user-defined projects. Those alerting rules will trigger alerts based on the values of the chosen metrics.
If you create alerting rules for a user-defined project, consider the following key behaviors and important limitations when you define the new rules:
A user-defined alerting rule can include metrics exposed by its own project in addition to the default metrics from core platform monitoring. You cannot include metrics from another user-defined project.
For example, an alerting rule for the
ns1user-defined project can use metrics exposed by thens1project in addition to core platform metrics, such as CPU and memory metrics. However, the rule cannot include metrics from a differentns2user-defined project.-
By default, when you create an alerting rule, the
namespacelabel is enforced on it even if a rule with the same name exists in another project. To create alerting rules that are not bound to their project of origin, see "Creating cross-project alerting rules for user-defined projects". To reduce latency and to minimize the load on core platform monitoring components, you can add the
openshift.io/prometheus-rule-evaluation-scope: leaf-prometheuslabel to a rule. This label forces only the Prometheus instance deployed in theopenshift-user-workload-monitoringproject to evaluate the alerting rule and prevents the Thanos Ruler instance from doing so.ImportantIf an alerting rule has this label, your alerting rule can use only those metrics exposed by your user-defined project. Alerting rules you create based on default platform metrics might not trigger alerts.
1.3.5.5. Managing alerting rules for user-defined projects
In Red Hat OpenShift Service on AWS, you can view, edit, and remove alerting rules in user-defined projects.
Managing alerting rules for user-defined projects is only available in Red Hat OpenShift Service on AWS version 4.11 and later.
Alerting rule considerations
- The default alerting rules are used specifically for the Red Hat OpenShift Service on AWS cluster.
- Some alerting rules intentionally have identical names. They send alerts about the same event with different thresholds, different severity, or both.
- Inhibition rules prevent notifications for lower severity alerts that are firing when a higher severity alert is also firing.
1.3.5.6. Optimizing alerting for user-defined projects
You can optimize alerting for your own projects by considering the following recommendations when creating alerting rules:
- Minimize the number of alerting rules that you create for your project. Create alerting rules that notify you of conditions that impact you. It is more difficult to notice relevant alerts if you generate many alerts for conditions that do not impact you.
- Create alerting rules for symptoms instead of causes. Create alerting rules that notify you of conditions regardless of the underlying cause. The cause can then be investigated. You will need many more alerting rules if each relates only to a specific cause. Some causes are then likely to be missed.
- Plan before you write your alerting rules. Determine what symptoms are important to you and what actions you want to take if they occur. Then build an alerting rule for each symptom.
- Provide clear alert messaging. State the symptom and recommended actions in the alert message.
- Include severity levels in your alerting rules. The severity of an alert depends on how you need to react if the reported symptom occurs. For example, a critical alert should be triggered if a symptom requires immediate attention by an individual or a critical response team.
1.3.5.7. Searching and filtering alerts, silences, and alerting rules
You can filter the alerts, silences, and alerting rules that are displayed in the Alerting UI. This section provides a description of each of the available filtering options.
1.3.5.7.1. Understanding alert filters
The Alerts page in the Alerting UI provides details about alerts relating to default Red Hat OpenShift Service on AWS and user-defined projects. The page includes a summary of severity, state, and source for each alert. The time at which an alert went into its current state is also shown.
You can filter by alert state, severity, and source. By default, only Platform alerts that are Firing are displayed. The following describes each alert filtering option:
State filters:
-
Firing. The alert is firing because the alert condition is true and the optional
forduration has passed. The alert continues to fire while the condition remains true. - Pending. The alert is active but is waiting for the duration that is specified in the alerting rule before it fires.
- Silenced. The alert is now silenced for a defined time period. Silences temporarily mute alerts based on a set of label selectors that you define. Notifications are not sent for alerts that match all the listed values or regular expressions.
-
Firing. The alert is firing because the alert condition is true and the optional
Severity filters:
- Critical. The condition that triggered the alert could have a critical impact. The alert requires immediate attention when fired and is typically paged to an individual or to a critical response team.
- Warning. The alert provides a warning notification about something that might require attention to prevent a problem from occurring. Warnings are typically routed to a ticketing system for non-immediate review.
- Info. The alert is provided for informational purposes only.
- None. The alert has no defined severity.
- You can also create custom severity definitions for alerts relating to user-defined projects.
Source filters:
- Platform. Platform-level alerts relate only to default Red Hat OpenShift Service on AWS projects. These projects provide core Red Hat OpenShift Service on AWS functionality.
- User. User alerts relate to user-defined projects. These alerts are user-created and are customizable. User-defined workload monitoring can be enabled postinstallation to provide observability into your own workloads.
1.3.5.7.2. Understanding silence filters
The Silences page in the Alerting UI provides details about silences applied to alerts in default Red Hat OpenShift Service on AWS and user-defined projects. The page includes a summary of the state of each silence and the time at which a silence ends.
You can filter by silence state. By default, only Active and Pending silences are displayed. The following describes each silence state filter option:
State filters:
- Active. The silence is active and the alert will be muted until the silence is expired.
- Pending. The silence has been scheduled and it is not yet active.
- Expired. The silence has expired and notifications will be sent if the conditions for an alert are true.
1.3.5.7.3. Understanding alerting rule filters
The Alerting rules page in the Alerting UI provides details about alerting rules relating to default Red Hat OpenShift Service on AWS and user-defined projects. The page includes a summary of the state, severity, and source for each alerting rule.
You can filter alerting rules by alert state, severity, and source. By default, only Platform alerting rules are displayed. The following describes each alerting rule filtering option:
Alert state filters:
-
Firing. The alert is firing because the alert condition is true and the optional
forduration has passed. The alert continues to fire while the condition remains true. - Pending. The alert is active but is waiting for the duration that is specified in the alerting rule before it fires.
- Silenced. The alert is now silenced for a defined time period. Silences temporarily mute alerts based on a set of label selectors that you define. Notifications are not sent for alerts that match all the listed values or regular expressions.
- Not Firing. The alert is not firing.
-
Firing. The alert is firing because the alert condition is true and the optional
Severity filters:
- Critical. The conditions defined in the alerting rule could have a critical impact. When true, these conditions require immediate attention. Alerts relating to the rule are typically paged to an individual or to a critical response team.
- Warning. The conditions defined in the alerting rule might require attention to prevent a problem from occurring. Alerts relating to the rule are typically routed to a ticketing system for non-immediate review.
- Info. The alerting rule provides informational alerts only.
- None. The alerting rule has no defined severity.
- You can also create custom severity definitions for alerting rules relating to user-defined projects.
Source filters:
- Platform. Platform-level alerting rules relate only to default Red Hat OpenShift Service on AWS projects. These projects provide core Red Hat OpenShift Service on AWS functionality.
- User. User-defined workload alerting rules relate to user-defined projects. These alerting rules are user-created and are customizable. User-defined workload monitoring can be enabled postinstallation to provide observability into your own workloads.
1.3.6. Understanding alert routing for user-defined projects
As a cluster administrator, you can enable alert routing for user-defined projects. With this feature, you can allow users with the alert-routing-edit cluster role to configure alert notification routing and receivers for user-defined projects. These notifications are routed by the default Alertmanager instance or, if enabled, an optional Alertmanager instance dedicated to user-defined monitoring.
Users can then create and configure user-defined alert routing by creating or editing the AlertmanagerConfig objects for their user-defined projects without the help of an administrator.
After a user has defined alert routing for a user-defined project, user-defined alert notifications are routed as follows:
-
To the
alertmanager-mainpods in theopenshift-monitoringnamespace if using the default platform Alertmanager instance. -
To the
alertmanager-user-workloadpods in theopenshift-user-workload-monitoringnamespace if you have enabled a separate instance of Alertmanager for user-defined projects.
Review the following limitations of alert routing for user-defined projects:
-
For user-defined alerting rules, user-defined routing is scoped to the namespace in which the resource is defined. For example, a routing configuration in namespace
ns1only applies toPrometheusRulesresources in the same namespace. -
When a namespace is excluded from user-defined monitoring,
AlertmanagerConfigresources in the namespace cease to be part of the Alertmanager configuration.
1.3.7. Sending notifications to external systems
In Red Hat OpenShift Service on AWS , firing alerts can be viewed in the Alerting UI. Alerts are not configured by default to be sent to any notification systems. You can configure Red Hat OpenShift Service on AWS to send alerts to the following receiver types:
- PagerDuty
- Webhook
- Slack
- Microsoft Teams
Routing alerts to receivers enables you to send timely notifications to the appropriate teams when failures occur. For example, critical alerts require immediate attention and are typically paged to an individual or a critical response team. Alerts that provide non-critical warning notifications might instead be routed to a ticketing system for non-immediate review.
Checking that alerting is operational by using the watchdog alert
Red Hat OpenShift Service on AWS monitoring includes a watchdog alert that fires continuously. Alertmanager repeatedly sends watchdog alert notifications to configured notification providers. The provider is usually configured to notify an administrator when it stops receiving the watchdog alert. This mechanism helps you quickly identify any communication issues between Alertmanager and the notification provider.
Chapter 2. Getting started
2.1. Maintenance and support for monitoring
Not all configuration options for the monitoring stack are exposed. To configure Red Hat OpenShift Service on AWS monitoring, configure the Cluster Monitoring Operator (CMO) using the options described in the "Config map reference for the Cluster Monitoring Operator" linked in the Additional resources section. Do not use other configurations, as they are unsupported.
Configuration paradigms might change across Prometheus releases, and such cases can only be handled gracefully if all configuration possibilities are controlled. If you use unsupported configurations, your changes will disappear because the CMO automatically reconciles any differences and resets any unsupported changes back to the originally defined state by default and by design.
Installing another Prometheus instance is not supported by the Red Hat Site Reliability Engineers (SRE).
2.1.1. Support considerations for monitoring
The Red Hat OpenShift Service on AWS monitoring has configuration limitations. Understanding them is essential for avoiding automated configuration resets.
Backward compatibility for metrics, recording rules, or alerting rules is not guaranteed.
The following modifications are explicitly not supported:
-
Creating additional
ServiceMonitor,PodMonitor, andPrometheusRuleobjects in theopenshift-*andkube-*projects. Modifying any resources or objects deployed in the
openshift-monitoringoropenshift-user-workload-monitoringprojects. The resources created by the Red Hat OpenShift Service on AWS monitoring stack are not meant to be used by any other resources, as there are no guarantees about their backward compatibility.NoteThe Alertmanager configuration is deployed as the
alertmanager-mainsecret resource in theopenshift-monitoringnamespace. If you have enabled a separate Alertmanager instance for user-defined alert routing, an Alertmanager configuration is also deployed as thealertmanager-user-workloadsecret resource in theopenshift-user-workload-monitoringnamespace. To configure additional routes for any instance of Alertmanager, you need to decode, modify, and then encode that secret. This procedure is a supported exception to the preceding statement.- Modifying resources of the stack. The Red Hat OpenShift Service on AWS monitoring stack ensures its resources are always in the state it expects them to be. If they are modified, the stack will reset them.
-
Deploying user-defined workloads to
openshift-*, andkube-*projects. These projects are reserved for Red Hat provided components and they should not be used for user-defined workloads. -
Enabling symptom based monitoring by using the
Probecustom resource definition (CRD) in Prometheus Operator. -
Manually deploying monitoring resources into namespaces that have the
openshift.io/cluster-monitoring: "true"label. -
Adding the
openshift.io/cluster-monitoring: "true"label to namespaces. This label is reserved only for the namespaces with core Red Hat OpenShift Service on AWS components and Red Hat certified components. - Installing custom Prometheus instances on Red Hat OpenShift Service on AWS. A custom instance is a Prometheus custom resource (CR) managed by the Prometheus Operator.
2.1.2. Support policy for monitoring Operators
Monitoring Operators ensure that Red Hat OpenShift Service on AWS monitoring resources function as designed and tested. If Cluster Version Operator (CVO) control of an Operator is overridden, the Operator does not respond to configuration changes, reconcile the intended state of cluster objects, or receive updates.
While overriding CVO control for an Operator can be helpful during debugging, this is unsupported and the cluster administrator assumes full control of the individual component configurations and upgrades.
Overriding the Cluster Version Operator
The spec.overrides parameter can be added to the configuration for the CVO to allow administrators to provide a list of overrides to the behavior of the CVO for a component. Setting the spec.overrides[].unmanaged parameter to true for a component blocks cluster upgrades and alerts the administrator after a CVO override has been set:
Disabling ownership via cluster version overrides prevents upgrades. Please remove overrides before continuing.Setting a CVO override puts the entire cluster in an unsupported state and prevents the monitoring stack from being reconciled to its intended state. This impacts the reliability features built into Operators and prevents updates from being received. Reported issues must be reproduced after removing any overrides for support to proceed.
2.1.3. Support version matrix for monitoring components
The following matrix contains information about versions of monitoring components for Red Hat OpenShift Service on AWS 4.12 and later releases:
| Red Hat OpenShift Service on AWS | Prometheus Operator | Prometheus | Metrics Server | Alertmanager | kube-state-metrics agent | monitoring-plugin | node-exporter agent | Thanos |
|---|---|---|---|---|---|---|---|---|
| 4.20 | 0.85.0 | 3.5.0 | 0.8.0 | 0.28.1 | 2.16.0 | 1.0.0 | 1.9.1 | 0.39.2 |
| 4.19 | 0.81.0 | 3.2.1 | 0.7.2 | 0.28.1 | 2.15.0 | 1.0.0 | 1.9.1 | 0.37.2 |
| 4.18 | 0.78.1 | 2.55.1 | 0.7.2 | 0.27.0 | 2.13.0 | 1.0.0 | 1.8.2 | 0.36.1 |
| 4.17 | 0.75.2 | 2.53.1 | 0.7.1 | 0.27.0 | 2.13.0 | 1.0.0 | 1.8.2 | 0.35.1 |
| 4.16 | 0.73.2 | 2.52.0 | 0.7.1 | 0.26.0 | 2.12.0 | 1.0.0 | 1.8.0 | 0.35.0 |
| 4.15 | 0.70.0 | 2.48.0 | 0.6.4 | 0.26.0 | 2.10.1 | 1.0.0 | 1.7.0 | 0.32.5 |
| 4.14 | 0.67.1 | 2.46.0 | N/A | 0.25.0 | 2.9.2 | 1.0.0 | 1.6.1 | 0.30.2 |
| 4.13 | 0.63.0 | 2.42.0 | N/A | 0.25.0 | 2.8.1 | N/A | 1.5.0 | 0.30.2 |
| 4.12 | 0.60.1 | 2.39.1 | N/A | 0.24.0 | 2.6.0 | N/A | 1.4.0 | 0.28.1 |
The openshift-state-metrics agent and Telemeter Client are OpenShift-specific components. Therefore, their versions correspond with the versions of Red Hat OpenShift Service on AWS.
2.2. Core platform monitoring first steps
After Red Hat OpenShift Service on AWS is installed, core platform monitoring components immediately begin collecting metrics, which you can query and view. The default in-cluster monitoring stack includes the core platform Prometheus instance that collects metrics from your cluster and the core Alertmanager instance that routes alerts, among other components. Depending on who will use the monitoring stack and for what purposes, as a cluster administrator, you can further configure these monitoring components to suit the needs of different users in various scenarios.
2.2.1. Configuring core platform monitoring: Postinstallation steps
After Red Hat OpenShift Service on AWS is installed, cluster administrators typically configure core platform monitoring to suit their needs. These activities include setting up storage and configuring options for Prometheus, Alertmanager, and other monitoring components.
By default, in a newly installed Red Hat OpenShift Service on AWS system, users can query and view collected metrics. You need only configure an alert receiver if you want users to receive alert notifications. Any other configuration options listed here are optional.
-
Create the
cluster-monitoring-configConfigMapobject if it does not exist. - Configure notifications for default platform alerts so that Alertmanager can send alerts to an external notification system such as email, Slack, or PagerDuty.
For shorter term data retention, configure persistent storage for Prometheus and Alertmanager to store metrics and alert data. Specify the metrics data retention parameters for Prometheus and Thanos Ruler.
Important- In multi-node clusters, you must configure persistent storage for Prometheus, Alertmanager, and Thanos Ruler to ensure high availability.
-
By default, in a newly installed Red Hat OpenShift Service on AWS system, the monitoring
ClusterOperatorresource reports aPrometheusDataPersistenceNotConfiguredstatus message to remind you that storage is not configured.
For longer term data retention, configure the remote write feature to enable Prometheus to send ingested metrics to remote systems for storage.
ImportantBe sure to add cluster ID labels to metrics for use with your remote write storage configuration.
- Grant monitoring cluster roles to any non-administrator users that need to access certain monitoring features.
- Assign tolerations to monitoring stack components so that administrators can move them to tainted nodes.
- Set the body size limit for metrics collection to help avoid situations in which Prometheus consumes excessive amounts of memory when scraped targets return a response that contains a large amount of data.
- Modify or create alerting rules for your cluster. These rules specify the conditions that trigger alerts, such as high CPU or memory usage, network latency, and so forth.
- Specify resource limits and requests for monitoring components to ensure that the containers that run monitoring components have enough CPU and memory resources.
With the monitoring stack configured to suit your needs, Prometheus collects metrics from the specified services and stores these metrics according to your settings. You can go to the Observe pages in the Red Hat OpenShift Service on AWS web console to view and query collected metrics, manage alerts, identify performance bottlenecks, and scale resources as needed:
- View dashboards to visualize collected metrics, troubleshoot alerts, and monitor other information about your cluster.
- Query collected metrics by creating PromQL queries or using predefined queries.
2.3. User workload monitoring first steps
As a cluster administrator, you can optionally enable monitoring for user-defined projects in addition to core platform monitoring. Non-administrator users such as developers can then monitor their own projects outside of core platform monitoring.
Cluster administrators typically complete the following activities to configure user-defined projects so that users can view collected metrics, query these metrics, and receive alerts for their own projects:
- Enable user workload monitoring.
-
Grant non-administrator users permissions to monitor user-defined projects by assigning the
monitoring-rules-view,monitoring-rules-edit, ormonitoring-editcluster roles. -
Assign the
user-workload-monitoring-config-editrole to grant non-administrator users permission to configure user-defined projects. - Enable alert routing for user-defined projects so that developers and other users can configure custom alerts and alert routing for their projects.
- If needed, configure alert routing for user-defined projects to use an optional Alertmanager instance dedicated for use only by user-defined projects.
- Configure notifications for user-defined alerts.
- If you use the platform Alertmanager instance for user-defined alert routing, configure different alert receivers for default platform alerts and user-defined alerts.
2.4. Developer and non-administrator steps
After monitoring for user-defined projects is enabled and configured, developers and other non-administrator users can then perform the following activities to set up and use monitoring for their own projects:
- Deploy and monitor services.
- Create and manage alerting rules.
- Receive and manage alerts for your projects.
-
If granted the
alert-routing-editcluster role, configure alert routing. - View dashboards by using the Red Hat OpenShift Service on AWS web console.
- Query the collected metrics by creating PromQL queries or using predefined queries.
Chapter 3. Configuring core platform monitoring
3.1. Preparing to configure core platform monitoring stack
This section explains which monitoring components can be configured and how to prepare for configuring the monitoring stack.
- Not all configuration parameters for the monitoring stack are exposed. Only the parameters and fields listed in the Config map reference for the Cluster Monitoring Operator are supported for configuration.
3.1.1. Configurable monitoring components
This table shows the monitoring components you can configure and the keys used to specify the components in the cluster-monitoring-config config map.
| Component | cluster-monitoring-config config map key |
|---|---|
| Prometheus Operator |
|
| Prometheus |
|
| Alertmanager |
|
| Thanos Querier |
|
| kube-state-metrics |
|
| monitoring-plugin |
|
| openshift-state-metrics |
|
| Telemeter Client |
|
| Metrics Server |
|
Different configuration changes to the ConfigMap object result in different outcomes:
- The pods are not redeployed. Therefore, there is no service outage.
The affected pods are redeployed:
- For multi-node clusters, because of high-availability, the affected pods are gradually rolled out and the monitoring stack remains available.
- Configuring and resizing a persistent volume always results in a service outage, regardless of high availability.
Each procedure that requires a change in the config map includes its expected outcome.
3.1.2. Creating a cluster monitoring config map
You can configure the core Red Hat OpenShift Service on AWS monitoring components by creating and updating the cluster-monitoring-config config map in the openshift-monitoring project. The Cluster Monitoring Operator (CMO) then configures the core components of the monitoring stack.
Prerequisites
-
You have access to the cluster as a user with the
cluster-admincluster role. -
You have installed the OpenShift CLI (
oc).
Procedure
Check whether the
cluster-monitoring-configConfigMapobject exists:$ oc -n openshift-monitoring get configmap cluster-monitoring-configIf the
ConfigMapobject does not exist:Create the following YAML manifest. In this example the file is called
cluster-monitoring-config.yaml:apiVersion: v1 kind: ConfigMap metadata: name: cluster-monitoring-config namespace: openshift-monitoring data: config.yaml: |Apply the configuration to create the
ConfigMapobject:$ oc apply -f cluster-monitoring-config.yaml
3.1.3. Granting users permissions for core platform monitoring
As a cluster administrator, you can monitor all core Red Hat OpenShift Service on AWS and user-defined projects.
You can also grant developers and other users different permissions for core platform monitoring. You can grant the permissions by assigning one of the following monitoring roles or cluster roles:
| Name | Description | Project |
|---|---|---|
|
| Users with this role have the ability to access Thanos Querier API endpoints. Additionally, it grants access to the core platform Prometheus API and user-defined Thanos Ruler API endpoints. |
|
|
|
Users with this role can manage |
|
|
| Users with this role can manage the Alertmanager API for core platform monitoring. They can also manage alert silences in the Red Hat OpenShift Service on AWS web console. |
|
|
| Users with this role can monitor the Alertmanager API for core platform monitoring. They can also view alert silences in the Red Hat OpenShift Service on AWS web console. |
|
|
|
Users with this cluster role have the same access rights as |
Must be bound with |
3.1.3.1. Granting user permissions by using the web console
You can grant users permissions for the openshift-monitoring project or their own projects, by using the Red Hat OpenShift Service on AWS web console.
Prerequisites
-
You have access to the cluster as a user with the
cluster-admincluster role. - The user account that you are assigning the role to already exists.
Procedure
- In the Red Hat OpenShift Service on AWS web console, go to User Management → RoleBindings → Create binding.
- In the Binding Type section, select the Namespace Role Binding type.
- In the Name field, enter a name for the role binding.
In the Namespace field, select the project where you want to grant the access.
ImportantThe monitoring role or cluster role permissions that you grant to a user by using this procedure apply only to the project that you select in the Namespace field.
- Select a monitoring role or cluster role from the Role Name list.
- In the Subject section, select User.
- In the Subject Name field, enter the name of the user.
- Select Create to apply the role binding.
3.1.3.2. Granting user permissions by using the CLI
You can grant users permissions for the openshift-monitoring project or their own projects, by using the OpenShift CLI (oc).
Whichever role or cluster role you choose, you must bind it against a specific project as a cluster administrator.
Prerequisites
-
You have access to the cluster as a user with the
cluster-admincluster role. - The user account that you are assigning the role to already exists.
-
You have installed the OpenShift CLI (
oc).
Procedure
To assign a monitoring role to a user for a project, enter the following command:
$ oc adm policy add-role-to-user <role> <user> -n <namespace> --role-namespace <namespace>1 - 1
- Substitute
<role>with the wanted monitoring role,<user>with the user to whom you want to assign the role, and<namespace>with the project where you want to grant the access.
To assign a monitoring cluster role to a user for a project, enter the following command:
$ oc adm policy add-cluster-role-to-user <cluster-role> <user> -n <namespace>1 - 1
- Substitute
<cluster-role>with the wanted monitoring cluster role,<user>with the user to whom you want to assign the cluster role, and<namespace>with the project where you want to grant the access.
3.2. Configuring performance and scalability for core platform monitoring
You can configure the monitoring stack to optimize the performance and scale of your clusters. The following documentation provides information about how to distribute the monitoring components and control the impact of the monitoring stack on CPU and memory resources.
3.2.1. Controlling the placement and distribution of monitoring components
You can move the monitoring stack components to specific nodes:
-
Use the
nodeSelectorconstraint with labeled nodes to move any of the monitoring stack components to specific nodes. - Assign tolerations to enable moving components to tainted nodes.
By doing so, you control the placement and distribution of the monitoring components across a cluster.
By controlling placement and distribution of monitoring components, you can optimize system resource use, improve performance, and separate workloads based on specific requirements or policies.
3.2.1.1. Moving monitoring components to different nodes
To specify the nodes in your cluster on which monitoring stack components will run, configure the nodeSelector constraint for the components in the cluster-monitoring-config config map to match labels assigned to the nodes.
You cannot add a node selector constraint directly to an existing scheduled pod.
Prerequisites
-
You have access to the cluster as a user with the
cluster-admincluster role. -
You have created the
cluster-monitoring-configConfigMapobject. -
You have installed the OpenShift CLI (
oc).
Procedure
If you have not done so yet, add a label to the nodes on which you want to run the monitoring components:
$ oc label nodes <node_name> <node_label>1 - 1
- Replace
<node_name>with the name of the node where you want to add the label. Replace<node_label>with the name of the wanted label.
Edit the
cluster-monitoring-configConfigMapobject in theopenshift-monitoringproject:$ oc -n openshift-monitoring edit configmap cluster-monitoring-configSpecify the node labels for the
nodeSelectorconstraint for the component underdata/config.yaml:apiVersion: v1 kind: ConfigMap metadata: name: cluster-monitoring-config namespace: openshift-monitoring data: config.yaml: | # ... <component>:1 nodeSelector: <node_label_1>2 <node_label_2>3 # ...- 1
- Substitute
<component>with the appropriate monitoring stack component name. - 2
- Substitute
<node_label_1>with the label you added to the node. - 3
- Optional: Specify additional labels. If you specify additional labels, the pods for the component are only scheduled on the nodes that contain all of the specified labels.
NoteIf monitoring components remain in a
Pendingstate after configuring thenodeSelectorconstraint, check the pod events for errors relating to taints and tolerations.- Save the file to apply the changes. The components specified in the new configuration are automatically moved to the new nodes, and the pods affected by the new configuration are redeployed.
3.2.1.2. Assigning tolerations to monitoring components
You can assign tolerations to any of the monitoring stack components to enable moving them to tainted nodes.
Prerequisites
-
You have access to the cluster as a user with the
cluster-admincluster role. -
You have created the
cluster-monitoring-configConfigMapobject. -
You have installed the OpenShift CLI (
oc).
Procedure
Edit the
cluster-monitoring-configconfig map in theopenshift-monitoringproject:$ oc -n openshift-monitoring edit configmap cluster-monitoring-configSpecify
tolerationsfor the component:apiVersion: v1 kind: ConfigMap metadata: name: cluster-monitoring-config namespace: openshift-monitoring data: config.yaml: | <component>: tolerations: <toleration_specification>Substitute
<component>and<toleration_specification>accordingly.For example,
oc adm taint nodes node1 key1=value1:NoScheduleadds a taint tonode1with the keykey1and the valuevalue1. This prevents monitoring components from deploying pods onnode1unless a toleration is configured for that taint. The following example configures thealertmanagerMaincomponent to tolerate the example taint:apiVersion: v1 kind: ConfigMap metadata: name: cluster-monitoring-config namespace: openshift-monitoring data: config.yaml: | alertmanagerMain: tolerations: - key: "key1" operator: "Equal" value: "value1" effect: "NoSchedule"- Save the file to apply the changes. The pods affected by the new configuration are automatically redeployed.
3.2.2. Setting the body size limit for metrics scraping
By default, no limit exists for the uncompressed body size for data returned from scraped metrics targets. You can set a body size limit to help avoid situations in which Prometheus consumes excessive amounts of memory when scraped targets return a response that contains a large amount of data. In addition, by setting a body size limit, you can reduce the impact that a malicious target might have on Prometheus and on the cluster as a whole.
After you set a value for enforcedBodySizeLimit, the alert PrometheusScrapeBodySizeLimitHit fires when at least one Prometheus scrape target replies with a response body larger than the configured value.
If metrics data scraped from a target has an uncompressed body size exceeding the configured size limit, the scrape fails. Prometheus then considers this target to be down and sets its up metric value to 0, which can trigger the TargetDown alert.
Prerequisites
-
You have access to the cluster as a user with the
cluster-admincluster role. -
You have installed the OpenShift CLI (
oc).
Procedure
Edit the
cluster-monitoring-configConfigMapobject in theopenshift-monitoringnamespace:$ oc -n openshift-monitoring edit configmap cluster-monitoring-configAdd a value for
enforcedBodySizeLimittodata/config.yaml/prometheusK8sto limit the body size that can be accepted per target scrape:apiVersion: v1 kind: ConfigMap metadata: name: cluster-monitoring-config namespace: openshift-monitoring data: config.yaml: |- prometheusK8s: enforcedBodySizeLimit: 40MB1 - 1
- Specify the maximum body size for scraped metrics targets. This
enforcedBodySizeLimitexample limits the uncompressed size per target scrape to 40 megabytes. Valid numeric values use the Prometheus data size format: B (bytes), KB (kilobytes), MB (megabytes), GB (gigabytes), TB (terabytes), PB (petabytes), and EB (exabytes). The default value is0, which specifies no limit. You can also set the value toautomaticto calculate the limit automatically based on cluster capacity.
- Save the file to apply the changes. The new configuration is applied automatically.
3.2.3. Managing CPU and memory resources for monitoring components
You can ensure that the containers that run monitoring components have enough CPU and memory resources by specifying values for resource limits and requests for those components.
You can configure these limits and requests for core platform monitoring components in the openshift-monitoring namespace.
3.2.3.1. Specifying limits and requests
To configure CPU and memory resources, specify values for resource limits and requests in the cluster-monitoring-config ConfigMap object in the openshift-monitoring namespace.
Prerequisites
-
You have access to the cluster as a user with the
cluster-admincluster role. -
You have created the
ConfigMapobject namedcluster-monitoring-config. -
You have installed the OpenShift CLI (
oc).
Procedure
Edit the
cluster-monitoring-configconfig map in theopenshift-monitoringproject:$ oc -n openshift-monitoring edit configmap cluster-monitoring-configAdd values to define resource limits and requests for each component you want to configure.
ImportantEnsure that the value set for a limit is always higher than the value set for a request. Otherwise, an error will occur, and the container will not run.
Example of setting resource limits and requests
apiVersion: v1 kind: ConfigMap metadata: name: cluster-monitoring-config namespace: openshift-monitoring data: config.yaml: | alertmanagerMain: resources: limits: cpu: 500m memory: 1Gi requests: cpu: 200m memory: 500Mi prometheusK8s: resources: limits: cpu: 500m memory: 3Gi requests: cpu: 200m memory: 500Mi thanosQuerier: resources: limits: cpu: 500m memory: 1Gi requests: cpu: 200m memory: 500Mi prometheusOperator: resources: limits: cpu: 500m memory: 1Gi requests: cpu: 200m memory: 500Mi metricsServer: resources: requests: cpu: 10m memory: 50Mi limits: cpu: 50m memory: 500Mi kubeStateMetrics: resources: limits: cpu: 500m memory: 1Gi requests: cpu: 200m memory: 500Mi telemeterClient: resources: limits: cpu: 500m memory: 1Gi requests: cpu: 200m memory: 500Mi openshiftStateMetrics: resources: limits: cpu: 500m memory: 1Gi requests: cpu: 200m memory: 500Mi nodeExporter: resources: limits: cpu: 50m memory: 150Mi requests: cpu: 20m memory: 50Mi monitoringPlugin: resources: limits: cpu: 500m memory: 1Gi requests: cpu: 200m memory: 500Mi prometheusOperatorAdmissionWebhook: resources: limits: cpu: 50m memory: 100Mi requests: cpu: 20m memory: 50Mi- Save the file to apply the changes. The pods affected by the new configuration are automatically redeployed.
3.2.4. Choosing a metrics collection profile
To choose a metrics collection profile for core Red Hat OpenShift Service on AWS monitoring components, edit the cluster-monitoring-config ConfigMap object.
Prerequisites
-
You have installed the OpenShift CLI (
oc). -
You have created the
cluster-monitoring-configConfigMapobject. -
You have access to the cluster as a user with the
cluster-admincluster role.
Procedure
Edit the
cluster-monitoring-configConfigMapobject in theopenshift-monitoringproject:$ oc -n openshift-monitoring edit configmap cluster-monitoring-configAdd the metrics collection profile setting under
data/config.yaml/prometheusK8s:apiVersion: v1 kind: ConfigMap metadata: name: cluster-monitoring-config namespace: openshift-monitoring data: config.yaml: | prometheusK8s: collectionProfile: <metrics_collection_profile_name>1 - 1
- The name of the metrics collection profile. The available values are
fullorminimal. If you do not specify a value or if thecollectionProfilekey name does not exist in the config map, the default setting offullis used.
The following example sets the metrics collection profile to
minimalfor the core platform instance of Prometheus:apiVersion: v1 kind: ConfigMap metadata: name: cluster-monitoring-config namespace: openshift-monitoring data: config.yaml: | prometheusK8s: collectionProfile: minimal- Save the file to apply the changes. The new configuration is applied automatically.
3.2.5. Configuring pod topology spread constraints
You can configure pod topology spread constraints for all the pods deployed by the Cluster Monitoring Operator to control how pod replicas are scheduled to nodes across zones. This ensures that the pods are highly available and run more efficiently, because workloads are spread across nodes in different data centers or hierarchical infrastructure zones.
You can configure pod topology spread constraints for monitoring pods by using the cluster-monitoring-config config map.
Prerequisites
-
You have access to the cluster as a user with the
cluster-admincluster role. -
You have created the
cluster-monitoring-configConfigMapobject. -
You have installed the OpenShift CLI (
oc).
Procedure
Edit the
cluster-monitoring-configconfig map in theopenshift-monitoringproject:$ oc -n openshift-monitoring edit configmap cluster-monitoring-configAdd the following settings under the
data/config.yamlfield to configure pod topology spread constraints:apiVersion: v1 kind: ConfigMap metadata: name: cluster-monitoring-config namespace: openshift-monitoring data: config.yaml: | <component>:1 topologySpreadConstraints: - maxSkew: <n>2 topologyKey: <key>3 whenUnsatisfiable: <value>4 labelSelector:5 <match_option>- 1
- Specify a name of the component for which you want to set up pod topology spread constraints.
- 2
- Specify a numeric value for
maxSkew, which defines the degree to which pods are allowed to be unevenly distributed. - 3
- Specify a key of node labels for
topologyKey. Nodes that have a label with this key and identical values are considered to be in the same topology. The scheduler tries to put a balanced number of pods into each domain. - 4
- Specify a value for
whenUnsatisfiable. Available options areDoNotScheduleandScheduleAnyway. SpecifyDoNotScheduleif you want themaxSkewvalue to define the maximum difference allowed between the number of matching pods in the target topology and the global minimum. SpecifyScheduleAnywayif you want the scheduler to still schedule the pod but to give higher priority to nodes that might reduce the skew. - 5
- Specify
labelSelectorto find matching pods. Pods that match this label selector are counted to determine the number of pods in their corresponding topology domain.
Example configuration for Prometheus
apiVersion: v1 kind: ConfigMap metadata: name: cluster-monitoring-config namespace: openshift-monitoring data: config.yaml: | prometheusK8s: topologySpreadConstraints: - maxSkew: 1 topologyKey: monitoring whenUnsatisfiable: DoNotSchedule labelSelector: matchLabels: app.kubernetes.io/name: prometheus- Save the file to apply the changes. The pods affected by the new configuration are automatically redeployed.
3.3. Storing and recording data for core platform monitoring
Store and record your metrics and alerting data, configure logs to specify which activities are recorded, control how long Prometheus retains stored data, and set the maximum amount of disk space for the data. These actions help you protect your data and use them for troubleshooting.
3.3.1. Configuring persistent storage
Run cluster monitoring with persistent storage to gain the following benefits:
- Protect your metrics and alerting data from data loss by storing them in a persistent volume (PV). As a result, they can survive pods being restarted or recreated.
- Avoid getting duplicate notifications and losing silences for alerts when the Alertmanager pods are restarted.
In multi-node clusters, you must configure persistent storage for Prometheus and Alertmanager to ensure high availability.
For production environments, it is highly recommended to configure persistent storage.
3.3.1.1. Persistent storage prerequisites
- Use the block type of storage.
3.3.1.2. Configuring a persistent volume claim
To use a persistent volume (PV) for monitoring components, you must configure a persistent volume claim (PVC).
Prerequisites
-
You have access to the cluster as a user with the
cluster-admincluster role. -
You have created the
cluster-monitoring-configConfigMapobject. -
You have installed the OpenShift CLI (
oc).
Procedure
Edit the
cluster-monitoring-configconfig map in theopenshift-monitoringproject:$ oc -n openshift-monitoring edit configmap cluster-monitoring-configAdd your PVC configuration for the component under
data/config.yaml:apiVersion: v1 kind: ConfigMap metadata: name: cluster-monitoring-config namespace: openshift-monitoring data: config.yaml: | <component>:1 volumeClaimTemplate: spec: storageClassName: <storage_class>2 resources: requests: storage: <amount_of_storage>3 The following example configures a PVC that claims persistent storage for Prometheus:
Example PVC configuration
apiVersion: v1
kind: ConfigMap
metadata:
  name: cluster-monitoring-config
  namespace: openshift-monitoring
data:
  config.yaml: |
    prometheusK8s:
      volumeClaimTemplate:
        spec:
          storageClassName: my-storage-class
          resources:
            requests:
              storage: 40Gi
Save the file to apply the changes. The pods affected by the new configuration are automatically redeployed and the new storage configuration is applied.
WarningWhen you update the config map with a PVC configuration, the affected
StatefulSetobject is recreated, resulting in a temporary service outage.
3.3.1.3. Resizing a persistent volume
You can resize a persistent volume (PV) for monitoring components, such as Prometheus or Alertmanager. You need to manually expand a persistent volume claim (PVC), and then update the config map in which the component is configured.
You can only expand the size of the PVC. Shrinking the storage size is not possible.
Prerequisites
-
You have access to the cluster as a user with the
cluster-admincluster role. -
You have created the
cluster-monitoring-configConfigMapobject. - You have configured at least one PVC for core Red Hat OpenShift Service on AWS monitoring components.
-
You have installed the OpenShift CLI (
oc).
Procedure
- Manually expand a PVC with the updated storage request. For more information, see "Expanding persistent volume claims (PVCs) with a file system" in Expanding persistent volumes.
Edit the
cluster-monitoring-configconfig map in theopenshift-monitoringproject:$ oc -n openshift-monitoring edit configmap cluster-monitoring-configAdd a new storage size for the PVC configuration for the component under
data/config.yaml:apiVersion: v1 kind: ConfigMap metadata: name: cluster-monitoring-config namespace: openshift-monitoring data: config.yaml: | <component>:1 volumeClaimTemplate: spec: resources: requests: storage: <amount_of_storage>2 The following example sets the new PVC request to 100 gigabytes for the Prometheus instance:
Example storage configuration for
prometheusK8sapiVersion: v1 kind: ConfigMap metadata: name: cluster-monitoring-config namespace: openshift-monitoring data: config.yaml: | prometheusK8s: volumeClaimTemplate: spec: resources: requests: storage: 100GiSave the file to apply the changes. The pods affected by the new configuration are automatically redeployed.
WarningWhen you update the config map with a new storage size, the affected
StatefulSetobject is recreated, resulting in a temporary service outage.
3.3.2. Modifying retention time and size for Prometheus metrics data
By default, Prometheus retains metrics data for 15 days for core platform monitoring. You can modify the retention time for the Prometheus instance to change when the data is deleted. You can also set the maximum amount of disk space the retained metrics data uses.
Data compaction occurs every two hours. Therefore, a persistent volume (PV) might fill up before compaction, potentially exceeding the retentionSize limit. In such cases, the KubePersistentVolumeFillingUp alert fires until the space on a PV is lower than the retentionSize limit.
Prerequisites
-
You have access to the cluster as a user with the
cluster-admincluster role. -
You have created the
cluster-monitoring-configConfigMapobject. -
You have installed the OpenShift CLI (
oc).
Procedure
Edit the
cluster-monitoring-configconfig map in theopenshift-monitoringproject:$ oc -n openshift-monitoring edit configmap cluster-monitoring-configAdd the retention time and size configuration under
data/config.yaml:apiVersion: v1 kind: ConfigMap metadata: name: cluster-monitoring-config namespace: openshift-monitoring data: config.yaml: | prometheusK8s: retention: <time_specification>1 retentionSize: <size_specification>2 - 1
- The retention time: a number directly followed by
ms(milliseconds),s(seconds),m(minutes),h(hours),d(days),w(weeks), ory(years). You can also combine time values for specific times, such as1h30m15s. - 2
- The retention size: a number directly followed by
B(bytes),KB(kilobytes),MB(megabytes),GB(gigabytes),TB(terabytes),PB(petabytes), andEB(exabytes).
The following example sets the retention time to 24 hours and the retention size to 10 gigabytes for the Prometheus instance:
Example of setting retention time for Prometheus
apiVersion: v1 kind: ConfigMap metadata: name: cluster-monitoring-config namespace: openshift-monitoring data: config.yaml: | prometheusK8s: retention: 24h retentionSize: 10GB- Save the file to apply the changes. The pods affected by the new configuration are automatically redeployed.
3.3.3. Configuring audit logs for Metrics Server
You can configure audit logs for Metrics Server to help you troubleshoot issues with the server. Audit logs record the sequence of actions in a cluster. It can record user, application, or control plane activities.
You can configure audit log rules to record specific events and a subset of associated data. The following audit profiles define configuration rules:
-
Metadata(default): This profile logs event metadata including user, timestamps, resource, and verb. It does not record request and response bodies. -
Request: This profile logs event metadata and request body, but it does not record response body. This configuration does not apply to non-resource requests. -
RequestResponse: This profile logs event metadata, and request and response bodies. This configuration does not apply to non-resource requests. -
None: None of the previously described events are recorded.
Prerequisites
-
You have access to the cluster as a user with the
cluster-admincluster role. -
You have created the
cluster-monitoring-configConfigMapobject. -
You have installed the OpenShift CLI (
oc).
Procedure
Edit the
cluster-monitoring-configconfig map in theopenshift-monitoringproject:$ oc -n openshift-monitoring edit configmap cluster-monitoring-configAdd audit log configuration for Metrics Server under
data/config.yaml:apiVersion: v1 kind: ConfigMap metadata: name: cluster-monitoring-config namespace: openshift-monitoring data: config.yaml: | metricsServer: audit: profile: <audit_log_profile>1 - 1
- Specify the audit profile for Metrics Server.
- Save the file to apply the changes. The pods affected by the new configuration are automatically redeployed.
Verify that the audit profile is applied:
$ oc -n openshift-monitoring get deploy metrics-server -o yaml | grep -- '--audit-policy-file=*'Example output
- --audit-policy-file=/etc/audit/request-profile.yaml
3.3.4. Setting log levels for monitoring components
You can configure the log level for Alertmanager, Prometheus Operator, Prometheus, and Thanos Querier and log verbosity for Metrics Server. You can use these settings for troubleshooting and to gain better insight into how the components are functioning.
The following log levels can be applied to the relevant component in the cluster-monitoring-config ConfigMap object:
-
debug. Log debug, informational, warning, and error messages. -
info(default). Log informational, warning, and error messages. -
warn. Log warning and error messages only. -
error. Log error messages only.
Prerequisites
-
You have access to the cluster as a user with the
cluster-admincluster role. -
You have created the
cluster-monitoring-configConfigMapobject. -
You have installed the OpenShift CLI (
oc).
Procedure
Edit the
cluster-monitoring-configconfig map in theopenshift-monitoringproject:$ oc -n openshift-monitoring edit configmap cluster-monitoring-configAdd log configuration for a component under
data/config.yaml:apiVersion: v1 kind: ConfigMap metadata: name: cluster-monitoring-config namespace: openshift-monitoring data: config.yaml: | <component>:1 logLevel: <log_level>2 metricsServer: verbosity: <value>3 # ...- 1
- Specify the monitoring stack component for which you are setting a log level. Available component values are
prometheusK8s,alertmanagerMain,prometheusOperator, andthanosQuerier. - 2
- Specify the log level for the component. The available values are
error,warn,info, anddebug. The default value isinfo. - 3
- Specify the verbosity for Metrics Server. Valid values are positive integers. Increasing the number increases the amount of logged events, values over
10are usually unnecessary. The default value is0.
- Save the file to apply the changes. The pods affected by the new configuration are automatically redeployed.
Verify that the log configuration is applied by reviewing the deployment or pod configuration in the related project.
The following example checks the log level for the
prometheus-operatordeployment:$ oc -n openshift-monitoring get deploy prometheus-operator -o yaml | grep "log-level"Example output
- --log-level=debugThe following example checks the log verbosity for the
metrics-serverdeployment:$ oc -n openshift-monitoring get deploy metrics-server -o yaml | grep -- '--v='Example output
- --v=3
Verify that the pods for the component are running:
$ oc -n openshift-monitoring get podsNoteIf an unrecognized
logLevelvalue is included in theConfigMapobject, the pods for the component might not restart successfully.
3.3.5. Enabling the query log file for Prometheus
You can configure Prometheus to write all queries that have been run by the engine to a log file.
Because log rotation is not supported, only enable this feature temporarily when you need to troubleshoot an issue. After you finish troubleshooting, disable query logging by reverting the changes you made to the ConfigMap object to enable the feature.
Prerequisites
-
You have access to the cluster as a user with the
cluster-admincluster role. -
You have created the
cluster-monitoring-configConfigMapobject. -
You have installed the OpenShift CLI (
oc).
Procedure
Edit the
cluster-monitoring-configconfig map in theopenshift-monitoringproject:$ oc -n openshift-monitoring edit configmap cluster-monitoring-configAdd the
queryLogFileparameter for Prometheus underdata/config.yaml:apiVersion: v1 kind: ConfigMap metadata: name: cluster-monitoring-config namespace: openshift-monitoring data: config.yaml: | prometheusK8s: queryLogFile: <path>1 - 1
- Add the full path to the file in which queries will be logged.
- Save the file to apply the changes. The pods affected by the new configuration are automatically redeployed.
Verify that the pods for the component are running. The following sample command lists the status of pods:
$ oc -n openshift-monitoring get podsExample output
...
prometheus-operator-567c9bc75c-96wkj   2/2     Running   0          62m
prometheus-k8s-0                       6/6     Running   1          57m
prometheus-k8s-1                       6/6     Running   1          57m
thanos-querier-56c76d7df4-2xkpc        6/6     Running   0          57m
thanos-querier-56c76d7df4-j5p29        6/6     Running   0          57m
...
Read the query log:
$ oc -n openshift-monitoring exec prometheus-k8s-0 -- cat <path>ImportantRevert the setting in the config map after you have examined the logged query information.
3.3.6. Enabling query logging for Thanos Querier
For default platform monitoring in the openshift-monitoring project, you can enable the Cluster Monitoring Operator (CMO) to log all queries run by Thanos Querier.
Because log rotation is not supported, only enable this feature temporarily when you need to troubleshoot an issue. After you finish troubleshooting, disable query logging by reverting the changes you made to the ConfigMap object to enable the feature.
Prerequisites
-
You have installed the OpenShift CLI (
oc). -
You have access to the cluster as a user with the
cluster-admincluster role. -
You have created the
cluster-monitoring-configConfigMapobject.
Procedure
You can enable query logging for Thanos Querier in the openshift-monitoring project:
Edit the
cluster-monitoring-configConfigMapobject in theopenshift-monitoringproject:$ oc -n openshift-monitoring edit configmap cluster-monitoring-configAdd a
thanosQueriersection underdata/config.yamland add values as shown in the following example:apiVersion: v1 kind: ConfigMap metadata: name: cluster-monitoring-config namespace: openshift-monitoring data: config.yaml: | thanosQuerier: enableRequestLogging: <value>1 logLevel: <value>2 - Save the file to apply the changes. The pods affected by the new configuration are automatically redeployed.
Verification
Verify that the Thanos Querier pods are running. The following sample command lists the status of pods in the
openshift-monitoringproject:$ oc -n openshift-monitoring get podsRun a test query using the following sample commands as a model:
$ token=`oc create token prometheus-k8s -n openshift-monitoring`$ oc -n openshift-monitoring exec -c prometheus prometheus-k8s-0 -- curl -k -H "Authorization: Bearer $token" 'https://thanos-querier.openshift-monitoring.svc:9091/api/v1/query?query=cluster_version'Run the following command to read the query log:
$ oc -n openshift-monitoring logs <thanos_querier_pod_name> -c thanos-queryNoteBecause the
thanos-querierpods are highly available (HA) pods, you might be able to see logs in only one pod.-
After you examine the logged query information, disable query logging by changing the
enableRequestLoggingvalue tofalsein the config map.
3.4. Configuring metrics for core platform monitoring
Configure the collection of metrics to monitor how cluster components and your own workloads are performing.
You can send ingested metrics to remote systems for long-term storage and add cluster ID labels to the metrics to identify the data coming from different clusters.
3.4.1. Configuring remote write storage
You can configure remote write storage to enable Prometheus to send ingested metrics to remote systems for long-term storage. Doing so has no impact on how or for how long Prometheus stores metrics.
Prerequisites
-
You have access to the cluster as a user with the
cluster-admincluster role. -
You have created the
cluster-monitoring-configConfigMapobject. -
You have installed the OpenShift CLI (
oc). You have set up a remote write compatible endpoint (such as Thanos) and know the endpoint URL. See the Prometheus remote endpoints and storage documentation for information about endpoints that are compatible with the remote write feature.
ImportantRed Hat only provides information for configuring remote write senders and does not offer guidance on configuring receiver endpoints. Customers are responsible for setting up their own endpoints that are remote-write compatible. Issues with endpoint receiver configurations are not included in Red Hat production support.
You have set up authentication credentials in a
Secretobject for the remote write endpoint. You must create the secret in theopenshift-monitoringnamespace.WarningTo reduce security risks, use HTTPS and authentication to send metrics to an endpoint.
Procedure
Edit the
cluster-monitoring-configconfig map in theopenshift-monitoringproject:$ oc -n openshift-monitoring edit configmap cluster-monitoring-configAdd a
remoteWrite:section underdata/config.yaml/prometheusK8s, as shown in the following example:apiVersion: v1 kind: ConfigMap metadata: name: cluster-monitoring-config namespace: openshift-monitoring data: config.yaml: | prometheusK8s: remoteWrite: - url: "https://remote-write-endpoint.example.com"1 <endpoint_authentication_credentials>2 - 1
- The URL of the remote write endpoint.
- 2
- The authentication method and credentials for the endpoint. Currently supported authentication methods are AWS Signature Version 4, authentication using HTTP in an
Authorizationrequest header, Basic authentication, OAuth 2.0, and TLS client. See Supported remote write authentication settings for sample configurations of supported authentication methods.
Add write relabel configuration values after the authentication credentials:
apiVersion: v1 kind: ConfigMap metadata: name: cluster-monitoring-config namespace: openshift-monitoring data: config.yaml: | prometheusK8s: remoteWrite: - url: "https://remote-write-endpoint.example.com" <endpoint_authentication_credentials> writeRelabelConfigs: - <your_write_relabel_configs>1 - 1
- Add configuration for metrics that you want to send to the remote endpoint.
Example of forwarding a single metric called
my_metricapiVersion: v1 kind: ConfigMap metadata: name: cluster-monitoring-config namespace: openshift-monitoring data: config.yaml: | prometheusK8s: remoteWrite: - url: "https://remote-write-endpoint.example.com" writeRelabelConfigs: - sourceLabels: [__name__] regex: 'my_metric' action: keepExample of forwarding metrics called
my_metric_1andmy_metric_2inmy_namespacenamespaceapiVersion: v1 kind: ConfigMap metadata: name: cluster-monitoring-config namespace: openshift-monitoring data: config.yaml: | prometheusK8s: remoteWrite: - url: "https://remote-write-endpoint.example.com" writeRelabelConfigs: - sourceLabels: [__name__,namespace] regex: '(my_metric_1|my_metric_2);my_namespace' action: keep- Save the file to apply the changes. The new configuration is applied automatically.
3.4.1.1. Supported remote write authentication settings
You can use different methods to authenticate with a remote write endpoint. Currently supported authentication methods are AWS Signature Version 4, basic authentication, authorization, OAuth 2.0, and TLS client. The following table provides details about supported authentication methods for use with remote write.
| Authentication method | Config map field | Description |
|---|---|---|
| AWS Signature Version 4 |
| This method uses AWS Signature Version 4 authentication to sign requests. You cannot use this method simultaneously with authorization, OAuth 2.0, or Basic authentication. |
| Basic authentication |
| Basic authentication sets the authorization header on every remote write request with the configured username and password. |
| authorization |
|
Authorization sets the |
| OAuth 2.0 |
|
An OAuth 2.0 configuration uses the client credentials grant type. Prometheus fetches an access token from |
| TLS client |
| A TLS client configuration specifies the CA certificate, the client certificate, and the client key file information used to authenticate with the remote write endpoint server using TLS. The sample configuration assumes that you have already created a CA certificate file, a client certificate file, and a client key file. |
3.4.1.2. Example remote write authentication settings
The following samples show different authentication settings you can use to connect to a remote write endpoint. Each sample also shows how to configure a corresponding Secret object that contains authentication credentials and other relevant settings. Each sample configures authentication for use with default platform monitoring in the openshift-monitoring namespace.
3.4.1.2.1. Sample YAML for AWS Signature Version 4 authentication
The following shows the settings for a sigv4 secret named sigv4-credentials in the openshift-monitoring namespace.
apiVersion: v1
kind: Secret
metadata:
  name: sigv4-credentials
  namespace: openshift-monitoring
stringData:
  accessKey: <AWS_access_key>
secretKey: <AWS_secret_key>
type: Opaque
The following shows sample AWS Signature Version 4 remote write authentication settings that use a Secret object named sigv4-credentials in the openshift-monitoring namespace:
apiVersion: v1
kind: ConfigMap
metadata:
  name: cluster-monitoring-config
  namespace: openshift-monitoring
data:
  config.yaml: |
    prometheusK8s:
      remoteWrite:
      - url: "https://authorization.example.com/api/write"
        sigv4:
          region: <AWS_region>
          accessKey:
            name: sigv4-credentials
key: accessKey
          secretKey:
            name: sigv4-credentials
key: secretKey
profile: <AWS_profile_name>
roleArn: <AWS_role_arn> - 1
- The AWS region.
- 2 4
- The name of the
Secretobject containing the AWS API access credentials. - 3
- The key that contains the AWS API access key in the specified
Secretobject. - 5
- The key that contains the AWS API secret key in the specified
Secretobject. - 6
- The name of the AWS profile that is being used to authenticate.
- 7
- The unique identifier for the Amazon Resource Name (ARN) assigned to your role.
3.4.1.2.2. Sample YAML for Basic authentication
The following shows sample Basic authentication settings for a Secret object named rw-basic-auth in the openshift-monitoring namespace:
apiVersion: v1
kind: Secret
metadata:
  name: rw-basic-auth
  namespace: openshift-monitoring
stringData:
  user: <basic_username>
password: <basic_password>
type: Opaque
The following sample shows a basicAuth remote write configuration that uses a Secret object named rw-basic-auth in the openshift-monitoring namespace. It assumes that you have already set up authentication credentials for the endpoint.
apiVersion: v1
kind: ConfigMap
metadata:
  name: cluster-monitoring-config
  namespace: openshift-monitoring
data:
  config.yaml: |
    prometheusK8s:
      remoteWrite:
      - url: "https://basicauth.example.com/api/write"
        basicAuth:
          username:
            name: rw-basic-auth
key: user
          password:
            name: rw-basic-auth
key: password 3.4.1.2.3. Sample YAML for authentication with a bearer token using a Secret Object
The following shows bearer token settings for a Secret object named rw-bearer-auth in the openshift-monitoring namespace:
apiVersion: v1
kind: Secret
metadata:
  name: rw-bearer-auth
  namespace: openshift-monitoring
stringData:
  token: <authentication_token>
type: Opaque- 1
- The authentication token.
The following shows sample bearer token config map settings that use a Secret object named rw-bearer-auth in the openshift-monitoring namespace:
apiVersion: v1
kind: ConfigMap
metadata:
  name: cluster-monitoring-config
  namespace: openshift-monitoring
data:
  config.yaml: |
    prometheusK8s:
      remoteWrite:
      - url: "https://authorization.example.com/api/write"
        authorization:
          type: Bearer
          credentials:
            name: rw-bearer-auth
key: token 3.4.1.2.4. Sample YAML for OAuth 2.0 authentication
The following shows sample OAuth 2.0 settings for a Secret object named oauth2-credentials in the openshift-monitoring namespace:
apiVersion: v1
kind: Secret
metadata:
  name: oauth2-credentials
  namespace: openshift-monitoring
stringData:
  id: <oauth2_id>
secret: <oauth2_secret>
type: Opaque
The following shows an oauth2 remote write authentication sample configuration that uses a Secret object named oauth2-credentials in the openshift-monitoring namespace:
apiVersion: v1
kind: ConfigMap
metadata:
  name: cluster-monitoring-config
  namespace: openshift-monitoring
data:
  config.yaml: |
    prometheusK8s:
      remoteWrite:
      - url: "https://test.example.com/api/write"
        oauth2:
          clientId:
            secret:
              name: oauth2-credentials
key: id
          clientSecret:
            name: oauth2-credentials
key: secret
tokenUrl: https://example.com/oauth2/token
scopes:
          - <scope_1>
          - <scope_2>
          endpointParams:
            param1: <parameter_1>
param2: <parameter_2>- 1 3
- The name of the corresponding
Secretobject. Note thatClientIdcan alternatively refer to aConfigMapobject, althoughclientSecretmust refer to aSecretobject. - 2 4
- The key that contains the OAuth 2.0 credentials in the specified
Secretobject. - 5
- The URL used to fetch a token with the specified
clientIdandclientSecret. - 6
- The OAuth 2.0 scopes for the authorization request. These scopes limit what data the tokens can access.
- 7
- The OAuth 2.0 authorization request parameters required for the authorization server.
3.4.1.2.5. Sample YAML for TLS client authentication
The following shows sample TLS client settings for a tls Secret object named mtls-bundle in the openshift-monitoring namespace.
apiVersion: v1
kind: Secret
metadata:
  name: mtls-bundle
  namespace: openshift-monitoring
data:
  ca.crt: <ca_cert>
client.crt: <client_cert>
client.key: <client_key>
type: tls
The following sample shows a tlsConfig remote write authentication configuration that uses a TLS Secret object named mtls-bundle.
apiVersion: v1
kind: ConfigMap
metadata:
  name: cluster-monitoring-config
  namespace: openshift-monitoring
data:
  config.yaml: |
    prometheusK8s:
      remoteWrite:
      - url: "https://remote-write-endpoint.example.com"
        tlsConfig:
          ca:
            secret:
              name: mtls-bundle
key: ca.crt
          cert:
            secret:
              name: mtls-bundle
key: client.crt
          keySecret:
            name: mtls-bundle
key: client.key - 1 3 5
- The name of the corresponding
Secretobject that contains the TLS authentication credentials. Note thatcaandcertcan alternatively refer to aConfigMapobject, thoughkeySecretmust refer to aSecretobject. - 2
- The key in the specified
Secretobject that contains the CA certificate for the endpoint. - 4
- The key in the specified
Secretobject that contains the client certificate for the endpoint. - 6
- The key in the specified
Secretobject that contains the client key secret.
3.4.1.3. Example remote write queue configuration
You can use the queueConfig object for remote write to tune the remote write queue parameters. The following example shows the queue parameters with their default values for default platform monitoring in the openshift-monitoring namespace.
Example configuration of remote write parameters with default values
apiVersion: v1
kind: ConfigMap
metadata:
  name: cluster-monitoring-config
  namespace: openshift-monitoring
data:
  config.yaml: |
    prometheusK8s:
      remoteWrite:
      - url: "https://remote-write-endpoint.example.com"
        <endpoint_authentication_credentials>
        queueConfig:
          capacity: 10000
minShards: 1
maxShards: 50
maxSamplesPerSend: 2000
batchSendDeadline: 5s
minBackoff: 30ms
maxBackoff: 5s
retryOnRateLimit: false
sampleAgeLimit: 0s - 1
- The number of samples to buffer per shard before they are dropped from the queue.
- 2
- The minimum number of shards.
- 3
- The maximum number of shards.
- 4
- The maximum number of samples per send.
- 5
- The maximum time for a sample to wait in buffer.
- 6
- The initial time to wait before retrying a failed request. The time gets doubled for every retry up to the
maxbackofftime. - 7
- The maximum time to wait before retrying a failed request.
- 8
- Set this parameter to
trueto retry a request after receiving a 429 status code from the remote write storage. - 9
- The samples that are older than the
sampleAgeLimitlimit are dropped from the queue. If the value is undefined or set to0s, the parameter is ignored.
3.4.1.4. Table of remote write metrics
The following table contains remote write and remote write-adjacent metrics with further description to help solve issues during remote write configuration.
| Metric | Description |
|---|---|
|
| Shows the newest timestamp that Prometheus stored in the write-ahead log (WAL) for any sample. |
|
| Shows the newest timestamp that the remote write queue successfully sent. |
|
| The number of samples that remote write failed to send and had to resend to remote storage. A steady high rate for this metric indicates problems with the network or remote storage endpoint. |
|
| Shows how many shards are currently running for each remote endpoint. |
|
| Shows the calculated needed number of shards based on the current write throughput and the rate of incoming versus sent samples. |
|
| Shows the maximum number of shards based on the current configuration. |
|
| Shows the minimum number of shards based on the current configuration. |
|
| The WAL segment file that Prometheus is currently writing new data to. |
|
| The WAL segment file that each remote write instance is currently reading from. |
3.4.2. Creating cluster ID labels for metrics
You can create cluster ID labels for metrics by adding the write_relabel settings for remote write storage in the cluster-monitoring-config config map in the openshift-monitoring namespace.
Prerequisites
-
You have access to the cluster as a user with the
cluster-admincluster role. -
You have created the
cluster-monitoring-configConfigMapobject. -
You have installed the OpenShift CLI (
oc). - You have configured remote write storage.
Procedure
Edit the
cluster-monitoring-configconfig map in theopenshift-monitoringproject:$ oc -n openshift-monitoring edit configmap cluster-monitoring-configIn the
writeRelabelConfigs:section underdata/config.yaml/prometheusK8s/remoteWrite, add cluster ID relabel configuration values:apiVersion: v1 kind: ConfigMap metadata: name: cluster-monitoring-config namespace: openshift-monitoring data: config.yaml: | prometheusK8s: remoteWrite: - url: "https://remote-write-endpoint.example.com" <endpoint_authentication_credentials> writeRelabelConfigs:1 - <relabel_config>2 The following sample shows how to forward a metric with the cluster ID label
cluster_id:apiVersion: v1 kind: ConfigMap metadata: name: cluster-monitoring-config namespace: openshift-monitoring data: config.yaml: | prometheusK8s: remoteWrite: - url: "https://remote-write-endpoint.example.com" writeRelabelConfigs: - sourceLabels: - __tmp_openshift_cluster_id__1 targetLabel: cluster_id2 action: replace3 - 1
- The system initially applies a temporary cluster ID source label named
__tmp_openshift_cluster_id__. This temporary label gets replaced by the cluster ID label name that you specify. - 2
- Specify the name of the cluster ID label for metrics sent to remote write storage. If you use a label name that already exists for a metric, that value is overwritten with the name of this cluster ID label. For the label name, do not use
__tmp_openshift_cluster_id__. The final relabeling step removes labels that use this name. - 3
- The
replacewrite relabel action replaces the temporary label with the target label for outgoing metrics. This action is the default and is applied if no action is specified.
- Save the file to apply the changes. The new configuration is applied automatically.
3.5. Configuring alerts and notifications for core platform monitoring
You can configure a local or external Alertmanager instance to route alerts from Prometheus to endpoint receivers. You can also attach custom labels to all time series and alerts to add useful metadata information.
3.5.1. Configuring external Alertmanager instances
The Red Hat OpenShift Service on AWS monitoring stack includes a local Alertmanager instance that routes alerts from Prometheus.
You can add external Alertmanager instances to route alerts for core Red Hat OpenShift Service on AWS projects.
If you add the same external Alertmanager configuration for multiple clusters and disable the local instance for each cluster, you can then manage alert routing for multiple clusters by using a single external Alertmanager instance.
Prerequisites
-
You have access to the cluster as a user with the
cluster-admincluster role. -
You have created the
cluster-monitoring-configConfigMapobject. -
You have installed the OpenShift CLI (
oc).
Procedure
Edit the
cluster-monitoring-configconfig map in theopenshift-monitoringproject:$ oc -n openshift-monitoring edit configmap cluster-monitoring-configAdd an
additionalAlertmanagerConfigssection with configuration details underdata/config.yaml/prometheusK8s:apiVersion: v1 kind: ConfigMap metadata: name: cluster-monitoring-config namespace: openshift-monitoring data: config.yaml: | prometheusK8s: additionalAlertmanagerConfigs: - <alertmanager_specification>1 - 1
- Substitute
<alertmanager_specification>with authentication and other configuration details for additional Alertmanager instances. Currently supported authentication methods are bearer token (bearerToken) and client TLS (tlsConfig).
The following sample config map configures an additional Alertmanager for Prometheus by using a bearer token with client TLS authentication:
apiVersion: v1 kind: ConfigMap metadata: name: cluster-monitoring-config namespace: openshift-monitoring data: config.yaml: | prometheusK8s: additionalAlertmanagerConfigs: - scheme: https pathPrefix: / timeout: "30s" apiVersion: v1 bearerToken: name: alertmanager-bearer-token key: token tlsConfig: key: name: alertmanager-tls key: tls.key cert: name: alertmanager-tls key: tls.crt ca: name: alertmanager-tls key: tls.ca staticConfigs: - external-alertmanager1-remote.com - external-alertmanager1-remote2.com- Save the file to apply the changes. The pods affected by the new configuration are automatically redeployed.
3.5.1.1. Disabling the local Alertmanager
A local Alertmanager that routes alerts from Prometheus instances is enabled by default in the openshift-monitoring project of the Red Hat OpenShift Service on AWS monitoring stack.
If you do not need the local Alertmanager, you can disable it by configuring the cluster-monitoring-config config map in the openshift-monitoring project.
Prerequisites
-
You have access to the cluster as a user with the
cluster-admincluster role. -
You have created the
cluster-monitoring-configconfig map. -
You have installed the OpenShift CLI (
oc).
Procedure
Edit the
cluster-monitoring-configconfig map in theopenshift-monitoringproject:$ oc -n openshift-monitoring edit configmap cluster-monitoring-configAdd
enabled: falsefor thealertmanagerMaincomponent underdata/config.yaml:apiVersion: v1 kind: ConfigMap metadata: name: cluster-monitoring-config namespace: openshift-monitoring data: config.yaml: | alertmanagerMain: enabled: false- Save the file to apply the changes. The Alertmanager instance is disabled automatically when you apply the change.
3.5.2. Configuring secrets for Alertmanager
The Red Hat OpenShift Service on AWS monitoring stack includes Alertmanager, which routes alerts from Prometheus to endpoint receivers. If you need to authenticate with a receiver so that Alertmanager can send alerts to it, you can configure Alertmanager to use a secret that contains authentication credentials for the receiver.
For example, you can configure Alertmanager to use a secret to authenticate with an endpoint receiver that requires a certificate issued by a private Certificate Authority (CA). You can also configure Alertmanager to use a secret to authenticate with a receiver that requires a password file for Basic HTTP authentication. In either case, authentication details are contained in the Secret object rather than in the ConfigMap object.
3.5.2.1. Adding a secret to the Alertmanager configuration
You can add secrets to the Alertmanager configuration by editing the cluster-monitoring-config config map in the openshift-monitoring project.
After you add a secret to the config map, the secret is mounted as a volume at /etc/alertmanager/secrets/<secret_name> within the alertmanager container for the Alertmanager pods.
Prerequisites
-
You have access to the cluster as a user with the
cluster-admincluster role. -
You have created the
cluster-monitoring-configconfig map. -
You have created the secret to be configured in Alertmanager in the
openshift-monitoringproject. -
You have installed the OpenShift CLI (
oc).
Procedure
Edit the
cluster-monitoring-configconfig map in theopenshift-monitoringproject:$ oc -n openshift-monitoring edit configmap cluster-monitoring-configAdd a
secrets:section underdata/config.yaml/alertmanagerMainwith the following configuration:apiVersion: v1 kind: ConfigMap metadata: name: cluster-monitoring-config namespace: openshift-monitoring data: config.yaml: | alertmanagerMain: secrets:1 - <secret_name_1>2 - <secret_name_2>- 1
- This section contains the secrets to be mounted into Alertmanager. The secrets must be located within the same namespace as the Alertmanager object.
- 2
- The name of the
Secretobject that contains authentication credentials for the receiver. If you add multiple secrets, place each one on a new line.
The following sample config map settings configure Alertmanager to use two
Secretobjects namedtest-secret-basic-authandtest-secret-api-token:apiVersion: v1 kind: ConfigMap metadata: name: cluster-monitoring-config namespace: openshift-monitoring data: config.yaml: | alertmanagerMain: secrets: - test-secret-basic-auth - test-secret-api-token- Save the file to apply the changes. The new configuration is applied automatically.
3.5.3. Attaching additional labels to your time series and alerts
You can attach custom labels to all time series and alerts leaving Prometheus by using the external labels feature of Prometheus.
Prerequisites
-
You have access to the cluster as a user with the
cluster-admincluster role. -
You have created the
cluster-monitoring-configConfigMapobject. -
You have installed the OpenShift CLI (
oc).
Procedure
Edit the
cluster-monitoring-configconfig map in theopenshift-monitoringproject:$ oc -n openshift-monitoring edit configmap cluster-monitoring-configDefine labels you want to add for every metric under
data/config.yaml:apiVersion: v1 kind: ConfigMap metadata: name: cluster-monitoring-config namespace: openshift-monitoring data: config.yaml: | prometheusK8s: externalLabels: <key>: <value>1 - 1
- Substitute
<key>: <value>with key-value pairs where<key>is a unique name for the new label and<value>is its value.
Warning-
Do not use
prometheusorprometheus_replicaas key names, because they are reserved and will be overwritten. -
Do not use
clusteras a key name. Using it can cause issues where you are unable to see data in the developer dashboards.
For example, to add metadata about the region and environment to all time series and alerts, use the following example:
apiVersion: v1 kind: ConfigMap metadata: name: cluster-monitoring-config namespace: openshift-monitoring data: config.yaml: | prometheusK8s: externalLabels: region: eu environment: prod- Save the file to apply the changes. The pods affected by the new configuration are automatically redeployed.
3.5.4. Configuring alert notifications
In Red Hat OpenShift Service on AWS, you can view firing alerts in the Alerting UI. You can configure Alertmanager to send notifications about default platform alerts by configuring alert receivers.
Alertmanager does not send notifications by default. It is strongly recommended to configure Alertmanager to receive notifications by configuring alert receivers through the web console or through the alertmanager-main secret.
3.5.4.1. Configuring alert routing for default platform alerts
You can configure Alertmanager to send notifications to receive important alerts coming from your cluster. Customize where and how Alertmanager sends notifications about default platform alerts by editing the default configuration in the alertmanager-main secret in the openshift-monitoring namespace.
All features of a supported version of upstream Alertmanager are also supported in an Red Hat OpenShift Service on AWS Alertmanager configuration. To check all the configuration options of a supported version of upstream Alertmanager, see Alertmanager configuration (Prometheus documentation).
Prerequisites
-
You have access to the cluster as a user with the
cluster-admincluster role. -
You have installed the OpenShift CLI (
oc).
Procedure
Extract the currently active Alertmanager configuration from the
alertmanager-mainsecret and save it as a localalertmanager.yamlfile:$ oc -n openshift-monitoring get secret alertmanager-main --template='{{ index .data "alertmanager.yaml" }}' | base64 --decode > alertmanager.yaml-
Open the
alertmanager.yamlfile. Edit the Alertmanager configuration:
Optional: Change the default Alertmanager configuration:
Example of the default Alertmanager secret YAML
global:
  resolve_timeout: 5m
  http_config:
    proxy_from_environment: true
1 route: group_wait: 30s2 group_interval: 5m3 repeat_interval: 12h4 receiver: default routes: - matchers: - "alertname=Watchdog" repeat_interval: 2m receiver: watchdog receivers: - name: default - name: watchdog- 1
- If you configured an HTTP cluster-wide proxy, set the
proxy_from_environmentparameter totrueto enable proxying for all alert receivers. - 2
- Specify how long Alertmanager waits while collecting initial alerts for a group of alerts before sending a notification.
- 3
- Specify how much time must elapse before Alertmanager sends a notification about new alerts added to a group of alerts for which an initial notification was already sent.
- 4
- Specify the minimum amount of time that must pass before an alert notification is repeated. If you want a notification to repeat at each group interval, set the
repeat_intervalvalue to less than thegroup_intervalvalue. The repeated notification can still be delayed, for example, when certain Alertmanager pods are restarted or rescheduled.
Add your alert receiver configuration:
# ...
receivers:
- name: default
- name: watchdog
- name: <receiver>
1 <receiver_configuration>2 # ...Example of configuring PagerDuty as an alert receiver
# ...
receivers:
- name: default
- name: watchdog
- name: team-frontend-page
  pagerduty_configs:
  - routing_key: xxxxxxxxxx
1 http_config:2 proxy_from_environment: true authorization: credentials: xxxxxxxxxx # ...Example of configuring email as an alert receiver
# ...
receivers:
- name: default
- name: watchdog
- name: team-frontend-page
  email_configs:
    - to: myemail@example.com
1 from: alertmanager@example.com2 smarthost: 'smtp.example.com:587'3 auth_username: alertmanager@example.com4 auth_password: password hello: alertmanager5 # ...- 1
- Specify an email address to send notifications to.
- 2
- Specify an email address to send notifications from.
- 3
- Specify the SMTP server address used for sending emails, including the port number.
- 4
- Specify the authentication credentials that Alertmanager uses to connect to the SMTP server. This example uses username and password.
- 5
- Specify the hostname to identify to the SMTP server. If you do not include this parameter, the hostname defaults to
localhost.
ImportantAlertmanager requires an external SMTP server to send email alerts. To configure email alert receivers, ensure you have the necessary connection details for an external SMTP server.
Add the routing configuration:
# ...
route:
  group_wait: 30s
  group_interval: 5m
  repeat_interval: 12h
  receiver: default
  routes:
  - matchers:
    - "alertname=Watchdog"
    repeat_interval: 2m
    receiver: watchdog
  - matchers:
1 - "<your_matching_rules>"2 receiver: <receiver>3 # ...- 1
- Use the
matcherskey name to specify the matching rules that an alert has to fulfill to match the node. If you define inhibition rules, usetarget_matcherskey name for target matchers andsource_matcherskey name for source matchers. - 2
- Specify labels to match your alerts.
- 3
- Specify the name of the receiver to use for the alerts.
WarningDo not use the
match,match_re,target_match,target_match_re,source_match, andsource_match_rekey names, which are deprecated and planned for removal in a future release.Example of alert routing
# ...
route:
  group_wait: 30s
  group_interval: 5m
  repeat_interval: 12h
  receiver: default
  routes:
  - matchers:
    - "alertname=Watchdog"
    repeat_interval: 2m
    receiver: watchdog
  - matchers:
1 - "service=example-app" routes:2 - matchers: - "severity=critical" receiver: team-frontend-page # ...The previous example routes alerts of
criticalseverity that are fired by theexample-appservice to theteam-frontend-pagereceiver. Typically, these types of alerts are paged to an individual or a critical response team.
Apply the new configuration in the file:
$ oc -n openshift-monitoring create secret generic alertmanager-main --from-file=alertmanager.yaml --dry-run=client -o=yaml | oc -n openshift-monitoring replace secret --filename=-Verify your routing configuration by visualizing the routing tree:
$ oc exec alertmanager-main-0 -n openshift-monitoring -- amtool config routes show --alertmanager.url http://localhost:9093Example output
Routing tree:
.
└── default-route  receiver: default
    ├── {alertname="Watchdog"}  receiver: Watchdog
    └── {service="example-app"}  receiver: default
        └── {severity="critical"}  receiver: team-frontend-page
3.5.4.2. Configuring alert routing with the Red Hat OpenShift Service on AWS web console
You can configure alert routing through the Red Hat OpenShift Service on AWS web console to ensure that you learn about important issues with your cluster.
The Red Hat OpenShift Service on AWS web console provides fewer settings to configure alert routing than the alertmanager-main secret. To configure alert routing with the access to more configuration settings, see "Configuring alert routing for default platform alerts".
Prerequisites
-
You have access to the cluster as a user with the
cluster-admincluster role.
Procedure
In the Red Hat OpenShift Service on AWS web console, go to Administration → Cluster Settings → Configuration → Alertmanager.
NoteAlternatively, you can go to the same page through the notification drawer. Select the bell icon at the top right of the Red Hat OpenShift Service on AWS web console and choose Configure in the AlertmanagerReceiverNotConfigured alert.
- Click Create Receiver in the Receivers section of the page.
- In the Create Receiver form, add a Receiver name and choose a Receiver type from the list.
Edit the receiver configuration:
For PagerDuty receivers:
- Choose an integration type and add a PagerDuty integration key.
- Add the URL of your PagerDuty installation.
- Click Show advanced configuration if you want to edit the client and incident details or the severity specification.
For webhook receivers:
- Add the endpoint to send HTTP POST requests to.
- Click Show advanced configuration if you want to edit the default option to send resolved alerts to the receiver.
For email receivers:
- Add the email address to send notifications to.
Add SMTP configuration details, including the address to send notifications from, the smarthost and port number used for sending emails, the hostname of the SMTP server, and authentication details.
ImportantAlertmanager requires an external SMTP server to send email alerts. To configure email alert receivers, ensure you have the necessary connection details for an external SMTP server.
- Select whether TLS is required.
- Click Show advanced configuration if you want to edit the default option not to send resolved alerts to the receiver or edit the body of email notifications configuration.
For Slack receivers:
- Add the URL of the Slack webhook.
- Add the Slack channel or user name to send notifications to.
- Select Show advanced configuration if you want to edit the default option not to send resolved alerts to the receiver or edit the icon and username configuration. You can also choose whether to find and link channel names and usernames.
By default, firing alerts with labels that match all of the selectors are sent to the receiver. If you want label values for firing alerts to be matched exactly before they are sent to the receiver, perform the following steps:
- Add routing label names and values in the Routing labels section of the form.
- Click Add label to add further routing labels.
- Click Create to create the receiver.
3.5.4.3. Configuring different alert receivers for default platform alerts and user-defined alerts
You can configure different alert receivers for default platform alerts and user-defined alerts to ensure the following results:
- All default platform alerts are sent to a receiver owned by the team in charge of these alerts.
- All user-defined alerts are sent to another receiver so that the team can focus only on platform alerts.
You can achieve this by using the openshift_io_alert_source="platform" label that is added by the Cluster Monitoring Operator to all platform alerts:
-
Use the
openshift_io_alert_source="platform"matcher to match default platform alerts. -
Use the
openshift_io_alert_source!="platform"or'openshift_io_alert_source=""'matcher to match user-defined alerts.
This configuration does not apply if you have enabled a separate instance of Alertmanager dedicated to user-defined alerts.
Chapter 4. Configuring user workload monitoring
4.1. Preparing to configure the user workload monitoring stack
This section explains which user-defined monitoring components can be configured , how to enable user workload monitoring, and how to prepare for configuring the user workload monitoring stack.
- Not all configuration parameters for the monitoring stack are exposed. Only the parameters and fields listed in the Config map reference for the Cluster Monitoring Operator are supported for configuration.
4.1.1. Configurable monitoring components
This table shows the monitoring components you can configure and the keys used to specify the components in the user-workload-monitoring-config config map.
Do not modify the monitoring components in the cluster-monitoring-config ConfigMap object. Red Hat Site Reliability Engineers (SRE) use these components to monitor the core cluster components and Kubernetes services.
| Component | user-workload-monitoring-config config map key |
|---|---|
| Prometheus Operator |
|
| Prometheus |
|
| Alertmanager |
|
| Thanos Ruler |
|
Different configuration changes to the ConfigMap object result in different outcomes:
- The pods are not redeployed. Therefore, there is no service outage.
The affected pods are redeployed:
- For multi-node clusters, because of high-availability, the affected pods are gradually rolled out and the monitoring stack remains available.
- Configuring and resizing a persistent volume always results in a service outage, regardless of high availability.
Each procedure that requires a change in the config map includes its expected outcome.
4.1.2. Enabling monitoring for user-defined projects
In Red Hat OpenShift Service on AWS, you can enable monitoring for user-defined projects in addition to the default platform monitoring. You can monitor your own projects in Red Hat OpenShift Service on AWS without the need for an additional monitoring solution. Using this feature centralizes monitoring for core platform components and user-defined projects.
Versions of Prometheus Operator installed using Operator Lifecycle Manager (OLM) are not compatible with user-defined monitoring. Therefore, custom Prometheus instances installed as a Prometheus custom resource (CR) managed by the OLM Prometheus Operator are not supported in Red Hat OpenShift Service on AWS.
4.1.2.1. Enabling monitoring for user-defined projects
Cluster administrators can enable monitoring for user-defined projects by setting the enableUserWorkload: true field in the cluster monitoring ConfigMap object.
You must remove any custom Prometheus instances before enabling monitoring for user-defined projects.
You must have access to the cluster as a user with the cluster-admin cluster role to enable monitoring for user-defined projects in Red Hat OpenShift Service on AWS. Cluster administrators can then optionally grant users permission to configure the components that are responsible for monitoring user-defined projects.
Prerequisites
-
You have access to the cluster as a user with the
cluster-admincluster role. -
You have installed the OpenShift CLI (
oc). -
You have created the
cluster-monitoring-configConfigMapobject. You have optionally created and configured the
user-workload-monitoring-configConfigMapobject in theopenshift-user-workload-monitoringproject. You can add configuration options to thisConfigMapobject for the components that monitor user-defined projects.NoteEvery time you save configuration changes to the
user-workload-monitoring-configConfigMapobject, the pods in theopenshift-user-workload-monitoringproject are redeployed. It might sometimes take a while for these components to redeploy.
Procedure
Edit the
cluster-monitoring-configConfigMapobject:$ oc -n openshift-monitoring edit configmap cluster-monitoring-configAdd
enableUserWorkload: trueunderdata/config.yaml:apiVersion: v1 kind: ConfigMap metadata: name: cluster-monitoring-config namespace: openshift-monitoring data: config.yaml: | enableUserWorkload: true1 - 1
- When set to
true, theenableUserWorkloadparameter enables monitoring for user-defined projects in a cluster.
Save the file to apply the changes. Monitoring for user-defined projects is then enabled automatically.
NoteIf you enable monitoring for user-defined projects, the
user-workload-monitoring-configConfigMapobject is created by default.Verify that the
prometheus-operator,prometheus-user-workload, andthanos-ruler-user-workloadpods are running in theopenshift-user-workload-monitoringproject. It might take a short while for the pods to start:$ oc -n openshift-user-workload-monitoring get podExample output
NAME                                   READY   STATUS        RESTARTS   AGE
prometheus-operator-6f7b748d5b-t7nbg   2/2     Running       0          3h
prometheus-user-workload-0             4/4     Running       1          3h
prometheus-user-workload-1             4/4     Running       1          3h
thanos-ruler-user-workload-0           3/3     Running       0          3h
thanos-ruler-user-workload-1           3/3     Running       0          3h
4.1.2.2. Granting users permission to configure monitoring for user-defined projects
As a cluster administrator, you can assign the user-workload-monitoring-config-edit role to a user. This grants permission to configure and manage monitoring for user-defined projects without giving them permission to configure and manage core Red Hat OpenShift Service on AWS monitoring components.
Prerequisites
-
You have access to the cluster as a user with the
cluster-admincluster role. - The user account that you are assigning the role to already exists.
-
You have installed the OpenShift CLI (
oc).
Procedure
Assign the
user-workload-monitoring-config-editrole to a user in theopenshift-user-workload-monitoringproject:$ oc -n openshift-user-workload-monitoring adm policy add-role-to-user \ user-workload-monitoring-config-edit <user> \ --role-namespace openshift-user-workload-monitoringVerify that the user is correctly assigned to the
user-workload-monitoring-config-editrole by displaying the related role binding:$ oc describe rolebinding <role_binding_name> -n openshift-user-workload-monitoringExample command
$ oc describe rolebinding user-workload-monitoring-config-edit -n openshift-user-workload-monitoringExample output
Name:         user-workload-monitoring-config-edit
Labels:       <none>
Annotations:  <none>
Role:
  Kind:  Role
  Name:  user-workload-monitoring-config-edit
Subjects:
  Kind  Name  Namespace
  ----  ----  ---------
  User  user1
1 - 1
- In this example,
user1is assigned to theuser-workload-monitoring-config-editrole.
4.1.3. Enabling alert routing for user-defined projects
In Red Hat OpenShift Service on AWS, an administrator can enable alert routing for user-defined projects. This process consists of the following steps:
Enable alert routing for user-defined projects:
- Use the default platform Alertmanager instance.
- Use a separate Alertmanager instance only for user-defined projects.
- Grant users permission to configure alert routing for user-defined projects.
After you complete these steps, developers and other users can configure custom alerts and alert routing for their user-defined projects.
4.1.3.1. Enabling the platform Alertmanager instance for user-defined alert routing
You can allow users to create user-defined alert routing configurations that use the main platform instance of Alertmanager.
Prerequisites
-
You have access to the cluster as a user with the
cluster-admincluster role. - A cluster administrator has enabled monitoring for user-defined projects.
-
You have installed the OpenShift CLI (
oc).
Procedure
Edit the
cluster-monitoring-configConfigMapobject:$ oc -n openshift-monitoring edit configmap cluster-monitoring-configAdd
enableUserAlertmanagerConfig: truein thealertmanagerMainsection underdata/config.yaml:apiVersion: v1 kind: ConfigMap metadata: name: cluster-monitoring-config namespace: openshift-monitoring data: config.yaml: | # ... alertmanagerMain: enableUserAlertmanagerConfig: true1 # ...- 1
- Set the
enableUserAlertmanagerConfigvalue totrueto allow users to create user-defined alert routing configurations that use the main platform instance of Alertmanager.
- Save the file to apply the changes. The new configuration is applied automatically.
4.1.3.2. Enabling a separate Alertmanager instance for user-defined alert routing
In some clusters, you might want to deploy a dedicated Alertmanager instance for user-defined projects, which can help reduce the load on the default platform Alertmanager instance and can better separate user-defined alerts from default platform alerts. In these cases, you can optionally enable a separate instance of Alertmanager to send alerts for user-defined projects only.
Prerequisites
-
You have access to the cluster as a user with the
cluster-admincluster role. - You have enabled monitoring for user-defined projects.
-
You have installed the OpenShift CLI (
oc).
Procedure
Edit the
user-workload-monitoring-configConfigMapobject:$ oc -n openshift-user-workload-monitoring edit configmap user-workload-monitoring-configAdd
enabled: trueandenableAlertmanagerConfig: truein thealertmanagersection underdata/config.yaml:apiVersion: v1 kind: ConfigMap metadata: name: user-workload-monitoring-config namespace: openshift-user-workload-monitoring data: config.yaml: | alertmanager: enabled: true1 enableAlertmanagerConfig: true2 - 1
- Set the
enabledvalue totrueto enable a dedicated instance of the Alertmanager for user-defined projects in a cluster. Set the value tofalseor omit the key entirely to disable the Alertmanager for user-defined projects. If you set this value tofalseor if the key is omitted, user-defined alerts are routed to the default platform Alertmanager instance. - 2
- Set the
enableAlertmanagerConfigvalue totrueto enable users to define their own alert routing configurations withAlertmanagerConfigobjects.
- Save the file to apply the changes. The dedicated instance of Alertmanager for user-defined projects starts automatically.
Verification
Verify that the
user-workloadAlertmanager instance has started:$ oc -n openshift-user-workload-monitoring get alertmanagerExample output
NAME            VERSION   REPLICAS   AGE
user-workload   0.24.0    2          100s
4.1.3.3. Granting users permission to configure alert routing for user-defined projects
You can grant users permission to configure alert routing for user-defined projects.
Prerequisites
-
You have access to the cluster as a user with the
cluster-admincluster role. - You have enabled monitoring for user-defined projects.
- The user account that you are assigning the role to already exists.
-
You have installed the OpenShift CLI (
oc).
Procedure
Assign the
alert-routing-editcluster role to a user in the user-defined project:$ oc -n <namespace> adm policy add-role-to-user alert-routing-edit <user>1 - 1
- For
<namespace>, substitute the namespace for the user-defined project, such asns1. For<user>, substitute the username for the account to which you want to assign the role.
4.1.4. Granting users permissions for monitoring for user-defined projects
As a cluster administrator, you can monitor all core Red Hat OpenShift Service on AWS and user-defined projects.
You can also grant developers and other users different permissions:
- Monitoring user-defined projects
- Configuring the components that monitor user-defined projects
- Configuring alert routing for user-defined projects
- Managing alerts and silences for user-defined projects
You can grant the permissions by assigning one of the following monitoring roles or cluster roles:
| Role name | Description | Project |
|---|---|---|
|
|
Users with this role can edit the |
|
|
| Users with this role have read access to the user-defined Alertmanager API for all projects, if the user-defined Alertmanager is enabled. |
|
|
| Users with this role have read and write access to the user-defined Alertmanager API for all projects, if the user-defined Alertmanager is enabled. |
|
| Cluster role name | Description | Project |
|---|---|---|
|
|
Users with this cluster role have read access to |
Can be bound with |
|
|
Users with this cluster role can create, modify, and delete |
Can be bound with |
|
|
Users with this cluster role have the same privileges as users with the |
Can be bound with |
|
|
Users with this cluster role can create, update, and delete |
Can be bound with |
|
| Users with this cluster role can access Thanos API endpoints for user-defined projects. |
Can be bound with |
4.1.4.1. Granting user permissions by using the web console
You can grant users permissions for the openshift-monitoring project or their own projects, by using the Red Hat OpenShift Service on AWS web console.
Prerequisites
-
You have access to the cluster as a user with the
cluster-admincluster role. - The user account that you are assigning the role to already exists.
Procedure
- In the Red Hat OpenShift Service on AWS web console, go to User Management → RoleBindings → Create binding.
- In the Binding Type section, select the Namespace Role Binding type.
- In the Name field, enter a name for the role binding.
In the Namespace field, select the project where you want to grant the access.
ImportantThe monitoring role or cluster role permissions that you grant to a user by using this procedure apply only to the project that you select in the Namespace field.
- Select a monitoring role or cluster role from the Role Name list.
- In the Subject section, select User.
- In the Subject Name field, enter the name of the user.
- Select Create to apply the role binding.
4.1.4.2. Granting user permissions by using the CLI
You can grant users permissions to monitor their own projects, by using the OpenShift CLI (oc).
Whichever role or cluster role you choose, you must bind it against a specific project as a cluster administrator.
Prerequisites
-
You have access to the cluster as a user with the
cluster-admincluster role. - The user account that you are assigning the role to already exists.
-
You have installed the OpenShift CLI (
oc).
Procedure
To assign a monitoring role to a user for a project, enter the following command:
$ oc adm policy add-role-to-user <role> <user> -n <namespace> --role-namespace <namespace>1 - 1
- Substitute
<role>with the wanted monitoring role,<user>with the user to whom you want to assign the role, and<namespace>with the project where you want to grant the access.
To assign a monitoring cluster role to a user for a project, enter the following command:
$ oc adm policy add-cluster-role-to-user <cluster-role> <user> -n <namespace>1 - 1
- Substitute
<cluster-role>with the wanted monitoring cluster role,<user>with the user to whom you want to assign the cluster role, and<namespace>with the project where you want to grant the access.
4.1.5. Excluding a user-defined project from monitoring
Individual user-defined projects can be excluded from user workload monitoring. To do so, add the openshift.io/user-monitoring label to the project’s namespace with a value of false.
Procedure
Add the label to the project namespace:
$ oc label namespace my-project 'openshift.io/user-monitoring=false'To re-enable monitoring, remove the label from the namespace:
$ oc label namespace my-project 'openshift.io/user-monitoring-'NoteIf there were any active monitoring targets for the project, it can take a few minutes for Prometheus to stop scraping them after adding the label.
4.1.6. Disabling monitoring for user-defined projects
After enabling monitoring for user-defined projects, you can disable it again by setting enableUserWorkload: false in the cluster monitoring ConfigMap object.
Alternatively, you can remove enableUserWorkload: true to disable monitoring for user-defined projects.
Procedure
Edit the
cluster-monitoring-configConfigMapobject:$ oc -n openshift-monitoring edit configmap cluster-monitoring-configSet
enableUserWorkload:tofalseunderdata/config.yaml:apiVersion: v1 kind: ConfigMap metadata: name: cluster-monitoring-config namespace: openshift-monitoring data: config.yaml: | enableUserWorkload: false
- Save the file to apply the changes. Monitoring for user-defined projects is then disabled automatically.
Check that the
prometheus-operator,prometheus-user-workloadandthanos-ruler-user-workloadpods are terminated in theopenshift-user-workload-monitoringproject. This might take a short while:$ oc -n openshift-user-workload-monitoring get podExample output
No resources found in openshift-user-workload-monitoring project.
The user-workload-monitoring-config ConfigMap object in the openshift-user-workload-monitoring project is not automatically deleted when monitoring for user-defined projects is disabled. This is to preserve any custom configurations that you may have created in the ConfigMap object.
4.2. Configuring performance and scalability for user workload monitoring
You can configure the monitoring stack to optimize the performance and scale of your clusters. The following documentation provides information about how to distribute the monitoring components and control the impact of the monitoring stack on CPU and memory resources.
4.2.1. Controlling the placement and distribution of monitoring components
You can move the monitoring stack components to specific nodes:
-
Use the
nodeSelectorconstraint with labeled nodes to move any of the monitoring stack components to specific nodes. - Assign tolerations to enable moving components to tainted nodes.
By doing so, you control the placement and distribution of the monitoring components across a cluster.
By controlling placement and distribution of monitoring components, you can optimize system resource use, improve performance, and separate workloads based on specific requirements or policies.
4.2.1.1. Moving monitoring components to different nodes
You can move any of the components that monitor workloads for user-defined projects to specific worker nodes.
It is not permitted to move components to control plane or infrastructure nodes.
Prerequisites
-
You have access to the cluster as a user with the
cluster-admincluster role or as a user with theuser-workload-monitoring-config-editrole in theopenshift-user-workload-monitoringproject. - A cluster administrator has enabled monitoring for user-defined projects.
-
You have installed the OpenShift CLI (
oc).
Procedure
If you have not done so yet, add a label to the nodes on which you want to run the monitoring components:
$ oc label nodes <node_name> <node_label>1 - 1
- Replace
<node_name>with the name of the node where you want to add the label. Replace<node_label>with the name of the wanted label.
Edit the
user-workload-monitoring-configConfigMapobject in theopenshift-user-workload-monitoringproject:$ oc -n openshift-user-workload-monitoring edit configmap user-workload-monitoring-configSpecify the node labels for the
nodeSelectorconstraint for the component underdata/config.yaml:apiVersion: v1 kind: ConfigMap metadata: name: user-workload-monitoring-config namespace: openshift-user-workload-monitoring data: config.yaml: | # ... <component>:1 nodeSelector: <node_label_1>2 <node_label_2>3 # ...- 1
- Substitute
<component>with the appropriate monitoring stack component name. - 2
- Substitute
<node_label_1>with the label you added to the node. - 3
- Optional: Specify additional labels. If you specify additional labels, the pods for the component are only scheduled on the nodes that contain all of the specified labels.
NoteIf monitoring components remain in a
Pendingstate after configuring thenodeSelectorconstraint, check the pod events for errors relating to taints and tolerations.- Save the file to apply the changes. The components specified in the new configuration are automatically moved to the new nodes, and the pods affected by the new configuration are redeployed.
4.2.1.2. Assigning tolerations to monitoring components
You can assign tolerations to the components that monitor user-defined projects, to enable moving them to tainted worker nodes. Scheduling is not permitted on control plane or infrastructure nodes.
Prerequisites
-
You have access to the cluster as a user with the
cluster-admincluster role, or as a user with theuser-workload-monitoring-config-editrole in theopenshift-user-workload-monitoringproject. - A cluster administrator has enabled monitoring for user-defined projects.
-
You have installed the OpenShift CLI (
oc).
Procedure
Edit the
user-workload-monitoring-configconfig map in theopenshift-user-workload-monitoringproject:$ oc -n openshift-user-workload-monitoring edit configmap user-workload-monitoring-configSpecify
tolerationsfor the component:apiVersion: v1 kind: ConfigMap metadata: name: user-workload-monitoring-config namespace: openshift-user-workload-monitoring data: config.yaml: | <component>: tolerations: <toleration_specification>Substitute
<component>and<toleration_specification>accordingly.For example,
oc adm taint nodes node1 key1=value1:NoScheduleadds a taint tonode1with the keykey1and the valuevalue1. This prevents monitoring components from deploying pods onnode1unless a toleration is configured for that taint. The following example configures thethanosRulercomponent to tolerate the example taint:apiVersion: v1 kind: ConfigMap metadata: name: user-workload-monitoring-config namespace: openshift-user-workload-monitoring data: config.yaml: | thanosRuler: tolerations: - key: "key1" operator: "Equal" value: "value1" effect: "NoSchedule"- Save the file to apply the changes. The pods affected by the new configuration are automatically redeployed.
4.2.2. Managing CPU and memory resources for monitoring components
You can ensure that the containers that run monitoring components have enough CPU and memory resources by specifying values for resource limits and requests for those components.
You can configure these limits and requests for monitoring components that monitor user-defined projects in the openshift-user-workload-monitoring namespace.
4.2.2.1. Specifying limits and requests
To configure CPU and memory resources, specify values for resource limits and requests in the user-workload-monitoring-config ConfigMap object in the openshift-user-workload-monitoring namespace.
Prerequisites
-
You have access to the cluster as a user with the
cluster-admincluster role, or as a user with theuser-workload-monitoring-config-editrole in theopenshift-user-workload-monitoringproject. -
You have installed the OpenShift CLI (
oc).
Procedure
Edit the
user-workload-monitoring-configconfig map in theopenshift-user-workload-monitoringproject:$ oc -n openshift-user-workload-monitoring edit configmap user-workload-monitoring-configAdd values to define resource limits and requests for each component you want to configure.
ImportantEnsure that the value set for a limit is always higher than the value set for a request. Otherwise, an error will occur, and the container will not run.
Example of setting resource limits and requests
apiVersion: v1 kind: ConfigMap metadata: name: user-workload-monitoring-config namespace: openshift-user-workload-monitoring data: config.yaml: | alertmanager: resources: limits: cpu: 500m memory: 1Gi requests: cpu: 200m memory: 500Mi prometheus: resources: limits: cpu: 500m memory: 3Gi requests: cpu: 200m memory: 500Mi thanosRuler: resources: limits: cpu: 500m memory: 1Gi requests: cpu: 200m memory: 500Mi- Save the file to apply the changes. The pods affected by the new configuration are automatically redeployed.
4.2.3. Controlling the impact of unbound metrics attributes in user-defined projects
Cluster administrators can use the following measures to control the impact of unbound metrics attributes in user-defined projects:
- Limit the number of samples that can be accepted per target scrape in user-defined projects
- Limit the number of scraped labels, the length of label names, and the length of label values
- Configure the intervals between consecutive scrapes and between Prometheus rule evaluations
- Create alerts that fire when a scrape sample threshold is reached or when the target cannot be scraped
Limiting scrape samples can help prevent the issues caused by adding many unbound attributes to labels. Developers can also prevent the underlying cause by limiting the number of unbound attributes that they define for metrics. Using attributes that are bound to a limited set of possible values reduces the number of potential key-value pair combinations.
4.2.3.1. Setting scrape intervals, evaluation intervals, and enforced limits for user-defined projects
You can set the following scrape and label limits for user-defined projects:
- Limit the number of samples that can be accepted per target scrape
- Limit the number of scraped labels
- Limit the length of label names and label values
You can also set an interval between consecutive scrapes and between Prometheus rule evaluations.
If you set sample or label limits, no further sample data is ingested for that target scrape after the limit is reached.
Prerequisites
-
You have access to the cluster as a user with the
cluster-admincluster role, or as a user with theuser-workload-monitoring-config-editrole in theopenshift-user-workload-monitoringproject. - A cluster administrator has enabled monitoring for user-defined projects.
-
You have installed the OpenShift CLI (
oc).
Procedure
Edit the
user-workload-monitoring-configConfigMapobject in theopenshift-user-workload-monitoringproject:$ oc -n openshift-user-workload-monitoring edit configmap user-workload-monitoring-configAdd the enforced limit and time interval configurations to
data/config.yaml:apiVersion: v1 kind: ConfigMap metadata: name: user-workload-monitoring-config namespace: openshift-user-workload-monitoring data: config.yaml: | prometheus: enforcedSampleLimit: 500001 enforcedLabelLimit: 5002 enforcedLabelNameLengthLimit: 503 enforcedLabelValueLengthLimit: 6004 scrapeInterval: 1m30s5 evaluationInterval: 1m15s6 - 1
- A value is required if this parameter is specified. This
enforcedSampleLimitexample limits the number of samples that can be accepted per target scrape in user-defined projects to 50,000. - 2
- Specifies the maximum number of labels per scrape. The default value is
0, which specifies no limit. - 3
- Specifies the maximum character length for a label name. The default value is
0, which specifies no limit. - 4
- Specifies the maximum character length for a label value. The default value is
0, which specifies no limit. - 5
- Specifies the interval between consecutive scrapes. The interval must be set between 5 seconds and 5 minutes. The default value is
30s. - 6
- Specifies the interval between Prometheus rule evaluations. The interval must be set between 5 seconds and 5 minutes. The default value for Prometheus is
30s.
NoteYou can also configure the
evaluationIntervalproperty for Thanos Ruler through thedata/config.yaml/thanosRulerfield. The default value for Thanos Ruler is15s.- Save the file to apply the changes. The limits are applied automatically.
4.2.3.2. Creating scrape sample alerts
You can create alerts that notify you when:
-
The target cannot be scraped or is not available for the specified
forduration -
A scrape sample threshold is reached or is exceeded for the specified
forduration
Prerequisites
-
You have access to the cluster as a user with the
cluster-admincluster role, or as a user with theuser-workload-monitoring-config-editrole in theopenshift-user-workload-monitoringproject. - A cluster administrator has enabled monitoring for user-defined projects.
-
You have limited the number of samples that can be accepted per target scrape in user-defined projects, by using
enforcedSampleLimit. -
You have installed the OpenShift CLI (
oc).
Procedure
Create a YAML file with alerts that inform you when the targets are down and when the enforced sample limit is approaching. The file in this example is called
monitoring-stack-alerts.yaml:apiVersion: monitoring.coreos.com/v1 kind: PrometheusRule metadata: labels: prometheus: k8s role: alert-rules name: monitoring-stack-alerts1 namespace: ns12 spec: groups: - name: general.rules rules: - alert: TargetDown3 annotations: message: '{{ printf "%.4g" $value }}% of the {{ $labels.job }}/{{ $labels.service }} targets in {{ $labels.namespace }} namespace are down.'4 expr: 100 * (count(up == 0) BY (job, namespace, service) / count(up) BY (job, namespace, service)) > 10 for: 10m5 labels: severity: warning6 - alert: ApproachingEnforcedSamplesLimit7 annotations: message: '{{ $labels.container }} container of the {{ $labels.pod }} pod in the {{ $labels.namespace }} namespace consumes {{ $value | humanizePercentage }} of the samples limit budget.'8 expr: (scrape_samples_post_metric_relabeling / (scrape_sample_limit > 0)) > 0.99 for: 10m10 labels: severity: warning11 - 1
- Defines the name of the alerting rule.
- 2
- Specifies the user-defined project where the alerting rule is deployed.
- 3
- The
TargetDownalert fires if the target cannot be scraped and is not available for theforduration. - 4
- The message that is displayed when the
TargetDownalert fires. - 5
- The conditions for the
TargetDownalert must be true for this duration before the alert is fired. - 6
- Defines the severity for the
TargetDownalert. - 7
- The
ApproachingEnforcedSamplesLimitalert fires when the defined scrape sample threshold is exceeded and lasts for the specifiedforduration. - 8
- The message that is displayed when the
ApproachingEnforcedSamplesLimitalert fires. - 9
- The threshold for the
ApproachingEnforcedSamplesLimitalert. In this example, the alert fires when the number of ingested samples exceeds 90% of the configured limit. - 10
- The conditions for the
ApproachingEnforcedSamplesLimitalert must be true for this duration before the alert is fired. - 11
- Defines the severity for the
ApproachingEnforcedSamplesLimitalert.
Apply the configuration to the user-defined project:
$ oc apply -f monitoring-stack-alerts.yamlAdditionally, you can check if a target has hit the configured limit:
In the Red Hat OpenShift Service on AWS web console, go to Observe → Targets and select an endpoint with a
Downstatus that you want to check.The Scrape failed: sample limit exceeded message is displayed if the endpoint failed because of an exceeded sample limit.
4.2.4. Configuring pod topology spread constraints
You can configure pod topology spread constraints for all the pods for user-defined monitoring to control how pod replicas are scheduled to nodes across zones. This ensures that the pods are highly available and run more efficiently, because workloads are spread across nodes in different data centers or hierarchical infrastructure zones.
You can configure pod topology spread constraints for monitoring pods by using the user-workload-monitoring-config config map.
Prerequisites
-
You have access to the cluster as a user with the
cluster-admincluster role or as a user with theuser-workload-monitoring-config-editrole in theopenshift-user-workload-monitoringproject. - A cluster administrator has enabled monitoring for user-defined projects.
-
You have installed the OpenShift CLI (
oc).
Procedure
Edit the
user-workload-monitoring-configconfig map in theopenshift-user-workload-monitoringproject:$ oc -n openshift-user-workload-monitoring edit configmap user-workload-monitoring-configAdd the following settings under the
data/config.yamlfield to configure pod topology spread constraints:apiVersion: v1 kind: ConfigMap metadata: name: user-workload-monitoring-config namespace: openshift-user-workload-monitoring data: config.yaml: | <component>:1 topologySpreadConstraints: - maxSkew: <n>2 topologyKey: <key>3 whenUnsatisfiable: <value>4 labelSelector:5 <match_option>- 1
- Specify a name of the component for which you want to set up pod topology spread constraints.
- 2
- Specify a numeric value for
maxSkew, which defines the degree to which pods are allowed to be unevenly distributed. - 3
- Specify a key of node labels for
topologyKey. Nodes that have a label with this key and identical values are considered to be in the same topology. The scheduler tries to put a balanced number of pods into each domain. - 4
- Specify a value for
whenUnsatisfiable. Available options areDoNotScheduleandScheduleAnyway. SpecifyDoNotScheduleif you want themaxSkewvalue to define the maximum difference allowed between the number of matching pods in the target topology and the global minimum. SpecifyScheduleAnywayif you want the scheduler to still schedule the pod but to give higher priority to nodes that might reduce the skew. - 5
- Specify
labelSelectorto find matching pods. Pods that match this label selector are counted to determine the number of pods in their corresponding topology domain.
Example configuration for Thanos Ruler
apiVersion: v1 kind: ConfigMap metadata: name: user-workload-monitoring-config namespace: openshift-user-workload-monitoring data: config.yaml: | thanosRuler: topologySpreadConstraints: - maxSkew: 1 topologyKey: monitoring whenUnsatisfiable: ScheduleAnyway labelSelector: matchLabels: app.kubernetes.io/name: thanos-ruler- Save the file to apply the changes. The pods affected by the new configuration are automatically redeployed.
4.3. Storing and recording data for user workload monitoring
Store and record your metrics and alerting data, configure logs to specify which activities are recorded, control how long Prometheus retains stored data, and set the maximum amount of disk space for the data. These actions help you protect your data and use them for troubleshooting.
4.3.1. Configuring persistent storage
Run cluster monitoring with persistent storage to gain the following benefits:
- Protect your metrics and alerting data from data loss by storing them in a persistent volume (PV). As a result, they can survive pods being restarted or recreated.
- Avoid getting duplicate notifications and losing silences for alerts when the Alertmanager pods are restarted.
In multi-node clusters, you must configure persistent storage for Prometheus, Alertmanager, and Thanos Ruler to ensure high availability.
For production environments, it is highly recommended to configure persistent storage.
4.3.1.1. Persistent storage prerequisites
- Use the block type of storage.
4.3.1.2. Configuring a persistent volume claim
To use a persistent volume (PV) for monitoring components, you must configure a persistent volume claim (PVC).
Prerequisites
-
You have access to the cluster as a user with the
cluster-admincluster role, or as a user with theuser-workload-monitoring-config-editrole in theopenshift-user-workload-monitoringproject. - A cluster administrator has enabled monitoring for user-defined projects.
-
You have installed the OpenShift CLI (
oc).
Procedure
Edit the
user-workload-monitoring-configconfig map in theopenshift-user-workload-monitoringproject:$ oc -n openshift-user-workload-monitoring edit configmap user-workload-monitoring-configAdd your PVC configuration for the component under
data/config.yaml:apiVersion: v1 kind: ConfigMap metadata: name: user-workload-monitoring-config namespace: openshift-user-workload-monitoring data: config.yaml: | <component>:1 volumeClaimTemplate: spec: storageClassName: <storage_class>2 resources: requests: storage: <amount_of_storage>3 The following example configures a PVC that claims persistent storage for Thanos Ruler:
Example PVC configuration
apiVersion: v1 kind: ConfigMap metadata: name: user-workload-monitoring-config namespace: openshift-user-workload-monitoring data: config.yaml: | thanosRuler: volumeClaimTemplate: spec: storageClassName: my-storage-class resources: requests: storage: 10GiNoteStorage requirements for the
thanosRulercomponent depend on the number of rules that are evaluated and how many samples each rule generates.Save the file to apply the changes. The pods affected by the new configuration are automatically redeployed and the new storage configuration is applied.
WarningWhen you update the config map with a PVC configuration, the affected
StatefulSetobject is recreated, resulting in a temporary service outage.
4.3.1.3. Resizing a persistent volume
You can resize a persistent volume (PV) for the instances of Prometheus, Thanos Ruler, and Alertmanager. You need to manually expand a persistent volume claim (PVC), and then update the config map in which the component is configured.
You can only expand the size of the PVC. Shrinking the storage size is not possible.
Prerequisites
-
You have access to the cluster as a user with the
cluster-admincluster role, or as a user with theuser-workload-monitoring-config-editrole in theopenshift-user-workload-monitoringproject. - A cluster administrator has enabled monitoring for user-defined projects.
- You have configured at least one PVC for components that monitor user-defined projects.
-
You have installed the OpenShift CLI (
oc).
Procedure
- Manually expand a PVC with the updated storage request. For more information, see "Expanding persistent volume claims (PVCs) with a file system" in Expanding persistent volumes.
Edit the
user-workload-monitoring-configconfig map in theopenshift-user-workload-monitoringproject:$ oc -n openshift-user-workload-monitoring edit configmap user-workload-monitoring-configAdd a new storage size for the PVC configuration for the component under
data/config.yaml:apiVersion: v1 kind: ConfigMap metadata: name: user-workload-monitoring-config namespace: openshift-user-workload-monitoring data: config.yaml: | <component>:1 volumeClaimTemplate: spec: resources: requests: storage: <amount_of_storage>2 The following example sets the new PVC request to 20 gigabytes for Thanos Ruler:
Example storage configuration for
thanosRulerapiVersion: v1 kind: ConfigMap metadata: name: user-workload-monitoring-config namespace: openshift-user-workload-monitoring data: config.yaml: | thanosRuler: volumeClaimTemplate: spec: resources: requests: storage: 20GiNoteStorage requirements for the
thanosRulercomponent depend on the number of rules that are evaluated and how many samples each rule generates.Save the file to apply the changes. The pods affected by the new configuration are automatically redeployed.
WarningWhen you update the config map with a new storage size, the affected
StatefulSetobject is recreated, resulting in a temporary service outage.
4.3.2. Modifying retention time and size for Prometheus metrics data
By default, Prometheus retains metrics data for 24 hours for monitoring for user-defined projects. You can modify the retention time for the Prometheus instance to change when the data is deleted. You can also set the maximum amount of disk space the retained metrics data uses.
Data compaction occurs every two hours. Therefore, a persistent volume (PV) might fill up before compaction, potentially exceeding the retentionSize limit. In such cases, the KubePersistentVolumeFillingUp alert fires until the space on a PV is lower than the retentionSize limit.
Prerequisites
-
You have access to the cluster as a user with the
cluster-admincluster role, or as a user with theuser-workload-monitoring-config-editrole in theopenshift-user-workload-monitoringproject. - A cluster administrator has enabled monitoring for user-defined projects.
-
You have installed the OpenShift CLI (
oc).
Procedure
Edit the
user-workload-monitoring-configconfig map in theopenshift-user-workload-monitoringproject:$ oc -n openshift-user-workload-monitoring edit configmap user-workload-monitoring-configAdd the retention time and size configuration under
data/config.yaml:apiVersion: v1 kind: ConfigMap metadata: name: user-workload-monitoring-config namespace: openshift-user-workload-monitoring data: config.yaml: | prometheus: retention: <time_specification>1 retentionSize: <size_specification>2 - 1
- The retention time: a number directly followed by
ms(milliseconds),s(seconds),m(minutes),h(hours),d(days),w(weeks), ory(years). You can also combine time values for specific times, such as1h30m15s. - 2
- The retention size: a number directly followed by
B(bytes),KB(kilobytes),MB(megabytes),GB(gigabytes),TB(terabytes),PB(petabytes), andEB(exabytes).
The following example sets the retention time to 24 hours and the retention size to 10 gigabytes for the Prometheus instance:
Example of setting retention time for Prometheus
apiVersion: v1 kind: ConfigMap metadata: name: user-workload-monitoring-config namespace: openshift-user-workload-monitoring data: config.yaml: | prometheus: retention: 24h retentionSize: 10GB- Save the file to apply the changes. The pods affected by the new configuration are automatically redeployed.
4.3.2.1. Modifying the retention time for Thanos Ruler metrics data
By default, for user-defined projects, Thanos Ruler automatically retains metrics data for 24 hours. You can modify the retention time to change how long this data is retained by specifying a time value in the user-workload-monitoring-config config map in the openshift-user-workload-monitoring namespace.
If you configure retention for user-workload Prometheus, Thanos Ruler automatically inherits the same retention time, unless explicitly configured otherwise.
Prerequisites
-
You have access to the cluster as a user with the
cluster-admincluster role or as a user with theuser-workload-monitoring-config-editrole in theopenshift-user-workload-monitoringproject. - A cluster administrator has enabled monitoring for user-defined projects.
-
You have installed the OpenShift CLI (
oc).
Procedure
Edit the
user-workload-monitoring-configConfigMapobject in theopenshift-user-workload-monitoringproject:$ oc -n openshift-user-workload-monitoring edit configmap user-workload-monitoring-configAdd the retention time configuration under
data/config.yaml:apiVersion: v1 kind: ConfigMap metadata: name: user-workload-monitoring-config namespace: openshift-user-workload-monitoring data: config.yaml: | thanosRuler: retention: <time_specification>1 - 1
- Specify the retention time in the following format: a number directly followed by
ms(milliseconds),s(seconds),m(minutes),h(hours),d(days),w(weeks), ory(years). You can also combine time values for specific times, such as1h30m15s. The default is24h.
The following example sets the retention time to 10 days for Thanos Ruler data:
apiVersion: v1 kind: ConfigMap metadata: name: user-workload-monitoring-config namespace: openshift-user-workload-monitoring data: config.yaml: | thanosRuler: retention: 10d- Save the file to apply the changes. The pods affected by the new configuration are automatically redeployed.
4.3.3. Setting log levels for monitoring components
You can configure the log level for Alertmanager, Prometheus Operator, Prometheus, and Thanos Ruler. You can use these settings for troubleshooting and to gain better insight into how the components are functioning.
The following log levels can be applied to the relevant component in the user-workload-monitoring-config ConfigMap object:
-
debug. Log debug, informational, warning, and error messages. -
info(default). Log informational, warning, and error messages. -
warn. Log warning and error messages only. -
error. Log error messages only.
Prerequisites
-
You have access to the cluster as a user with the
cluster-admincluster role or as a user with theuser-workload-monitoring-config-editrole in theopenshift-user-workload-monitoringproject. - A cluster administrator has enabled monitoring for user-defined projects.
-
You have installed the OpenShift CLI (
oc).
Procedure
Edit the
user-workload-monitoring-configconfig map in theopenshift-user-workload-monitoringproject:$ oc -n openshift-user-workload-monitoring edit configmap user-workload-monitoring-configAdd log configuration for a component under
data/config.yaml:apiVersion: v1 kind: ConfigMap metadata: name: user-workload-monitoring-config namespace: openshift-user-workload-monitoring data: config.yaml: | <component>:1 logLevel: <log_level>2 # ...- Save the file to apply the changes. The pods affected by the new configuration are automatically redeployed.
Verify that the log configuration is applied by reviewing the deployment or pod configuration in the related project.
The following example checks the log level for the
prometheus-operatordeployment:$ oc -n openshift-user-workload-monitoring get deploy prometheus-operator -o yaml | grep "log-level"Example output
- --log-level=debug
Verify that the pods for the component are running:
$ oc -n openshift-user-workload-monitoring get podsNoteIf an unrecognized
logLevelvalue is included in theConfigMapobject, the pods for the component might not restart successfully.
4.3.4. Enabling the query log file for Prometheus
You can configure Prometheus to write all queries that have been run by the engine to a log file.
Because log rotation is not supported, only enable this feature temporarily when you need to troubleshoot an issue. After you finish troubleshooting, disable query logging by reverting the changes you made to the ConfigMap object to enable the feature.
Prerequisites
-
You have access to the cluster as a user with the
cluster-admincluster role or as a user with theuser-workload-monitoring-config-editrole in theopenshift-user-workload-monitoringproject. - A cluster administrator has enabled monitoring for user-defined projects.
-
You have installed the OpenShift CLI (
oc).
Procedure
Edit the
user-workload-monitoring-configconfig map in theopenshift-user-workload-monitoringproject:$ oc -n openshift-user-workload-monitoring edit configmap user-workload-monitoring-configAdd the
queryLogFileparameter for Prometheus underdata/config.yaml:apiVersion: v1 kind: ConfigMap metadata: name: user-workload-monitoring-config namespace: openshift-user-workload-monitoring data: config.yaml: | prometheus: queryLogFile: <path>1 - 1
- Add the full path to the file in which queries will be logged.
- Save the file to apply the changes. The pods affected by the new configuration are automatically redeployed.
Verify that the pods for the component are running. The following sample command lists the status of pods:
$ oc -n openshift-user-workload-monitoring get podsExample output
...
prometheus-operator-776fcbbd56-2nbfm   2/2     Running   0          132m
prometheus-user-workload-0             5/5     Running   1          132m
prometheus-user-workload-1             5/5     Running   1          132m
thanos-ruler-user-workload-0           3/3     Running   0          132m
thanos-ruler-user-workload-1           3/3     Running   0          132m
...
Read the query log:
$ oc -n openshift-user-workload-monitoring exec prometheus-user-workload-0 -- cat <path>ImportantRevert the setting in the config map after you have examined the logged query information.
4.4. Configuring metrics for user workload monitoring
Configure the collection of metrics to monitor how cluster components and your own workloads are performing.
You can send ingested metrics to remote systems for long-term storage and add cluster ID labels to the metrics to identify the data coming from different clusters.
4.4.1. Configuring remote write storage
You can configure remote write storage to enable Prometheus to send ingested metrics to remote systems for long-term storage. Doing so has no impact on how or for how long Prometheus stores metrics.
Prerequisites
-
You have access to the cluster as a user with the
cluster-admincluster role or as a user with theuser-workload-monitoring-config-editrole in theopenshift-user-workload-monitoringproject. - A cluster administrator has enabled monitoring for user-defined projects.
-
You have installed the OpenShift CLI (
oc). You have set up a remote write compatible endpoint (such as Thanos) and know the endpoint URL. See the Prometheus remote endpoints and storage documentation for information about endpoints that are compatible with the remote write feature.
ImportantRed Hat only provides information for configuring remote write senders and does not offer guidance on configuring receiver endpoints. Customers are responsible for setting up their own endpoints that are remote-write compatible. Issues with endpoint receiver configurations are not included in Red Hat production support.
You have set up authentication credentials in a
Secretobject for the remote write endpoint. You must create the secret in theopenshift-user-workload-monitoringnamespace.WarningTo reduce security risks, use HTTPS and authentication to send metrics to an endpoint.
Procedure
Edit the
user-workload-monitoring-configconfig map in theopenshift-user-workload-monitoringproject:$ oc -n openshift-user-workload-monitoring edit configmap user-workload-monitoring-configAdd a
remoteWrite:section underdata/config.yaml/prometheus, as shown in the following example:apiVersion: v1 kind: ConfigMap metadata: name: user-workload-monitoring-config namespace: openshift-user-workload-monitoring data: config.yaml: | prometheus: remoteWrite: - url: "https://remote-write-endpoint.example.com"1 <endpoint_authentication_credentials>2 - 1
- The URL of the remote write endpoint.
- 2
- The authentication method and credentials for the endpoint. Currently supported authentication methods are AWS Signature Version 4, authentication using HTTP in an
Authorizationrequest header, Basic authentication, OAuth 2.0, and TLS client. See Supported remote write authentication settings for sample configurations of supported authentication methods.
Add write relabel configuration values after the authentication credentials:
apiVersion: v1 kind: ConfigMap metadata: name: user-workload-monitoring-config namespace: openshift-user-workload-monitoring data: config.yaml: | prometheus: remoteWrite: - url: "https://remote-write-endpoint.example.com" <endpoint_authentication_credentials> writeRelabelConfigs: - <your_write_relabel_configs>1 - 1
- Add configuration for metrics that you want to send to the remote endpoint.
Example of forwarding a single metric called
my_metricapiVersion: v1 kind: ConfigMap metadata: name: user-workload-monitoring-config namespace: openshift-user-workload-monitoring data: config.yaml: | prometheus: remoteWrite: - url: "https://remote-write-endpoint.example.com" writeRelabelConfigs: - sourceLabels: [__name__] regex: 'my_metric' action: keepExample of forwarding metrics called
my_metric_1andmy_metric_2inmy_namespacenamespaceapiVersion: v1 kind: ConfigMap metadata: name: user-workload-monitoring-config namespace: openshift-user-workload-monitoring data: config.yaml: | prometheus: remoteWrite: - url: "https://remote-write-endpoint.example.com" writeRelabelConfigs: - sourceLabels: [__name__,namespace] regex: '(my_metric_1|my_metric_2);my_namespace' action: keep- Save the file to apply the changes. The new configuration is applied automatically.
4.4.1.1. Supported remote write authentication settings
You can use different methods to authenticate with a remote write endpoint. Currently supported authentication methods are AWS Signature Version 4, basic authentication, authorization, OAuth 2.0, and TLS client. The following table provides details about supported authentication methods for use with remote write.
| Authentication method | Config map field | Description |
|---|---|---|
| AWS Signature Version 4 |
| This method uses AWS Signature Version 4 authentication to sign requests. You cannot use this method simultaneously with authorization, OAuth 2.0, or Basic authentication. |
| Basic authentication |
| Basic authentication sets the authorization header on every remote write request with the configured username and password. |
| authorization |
|
Authorization sets the |
| OAuth 2.0 |
|
An OAuth 2.0 configuration uses the client credentials grant type. Prometheus fetches an access token from |
| TLS client |
| A TLS client configuration specifies the CA certificate, the client certificate, and the client key file information used to authenticate with the remote write endpoint server using TLS. The sample configuration assumes that you have already created a CA certificate file, a client certificate file, and a client key file. |
4.4.1.2. Example remote write authentication settings
The following samples show different authentication settings you can use to connect to a remote write endpoint. Each sample also shows how to configure a corresponding Secret object that contains authentication credentials and other relevant settings. Each sample configures authentication for use with monitoring for user-defined projects in the openshift-user-workload-monitoring namespace.
4.4.1.2.1. Sample YAML for AWS Signature Version 4 authentication
The following shows the settings for a sigv4 secret named sigv4-credentials in the openshift-user-workload-monitoring namespace.
apiVersion: v1
kind: Secret
metadata:
  name: sigv4-credentials
  namespace: openshift-user-workload-monitoring
stringData:
  accessKey: <AWS_access_key>
secretKey: <AWS_secret_key>
type: Opaque
The following shows sample AWS Signature Version 4 remote write authentication settings that use a Secret object named sigv4-credentials in the openshift-user-workload-monitoring namespace:
apiVersion: v1
kind: ConfigMap
metadata:
  name: user-workload-monitoring-config
  namespace: openshift-user-workload-monitoring
data:
  config.yaml: |
    prometheus:
      remoteWrite:
      - url: "https://authorization.example.com/api/write"
        sigv4:
          region: <AWS_region>
          accessKey:
            name: sigv4-credentials
key: accessKey
          secretKey:
            name: sigv4-credentials
key: secretKey
profile: <AWS_profile_name>
roleArn: <AWS_role_arn> - 1
- The AWS region.
- 2 4
- The name of the
Secretobject containing the AWS API access credentials. - 3
- The key that contains the AWS API access key in the specified
Secretobject. - 5
- The key that contains the AWS API secret key in the specified
Secretobject. - 6
- The name of the AWS profile that is being used to authenticate.
- 7
- The unique identifier for the Amazon Resource Name (ARN) assigned to your role.
4.4.1.2.2. Sample YAML for Basic authentication
The following shows sample Basic authentication settings for a Secret object named rw-basic-auth in the openshift-user-workload-monitoring namespace:
apiVersion: v1
kind: Secret
metadata:
  name: rw-basic-auth
  namespace: openshift-user-workload-monitoring
stringData:
  user: <basic_username>
password: <basic_password>
type: Opaque
The following sample shows a basicAuth remote write configuration that uses a Secret object named rw-basic-auth in the openshift-user-workload-monitoring namespace. It assumes that you have already set up authentication credentials for the endpoint.
apiVersion: v1
kind: ConfigMap
metadata:
  name: user-workload-monitoring-config
  namespace: openshift-user-workload-monitoring
data:
  config.yaml: |
    prometheus:
      remoteWrite:
      - url: "https://basicauth.example.com/api/write"
        basicAuth:
          username:
            name: rw-basic-auth
key: user
          password:
            name: rw-basic-auth
key: password 4.4.1.2.3. Sample YAML for authentication with a bearer token using a Secret Object
The following shows bearer token settings for a Secret object named rw-bearer-auth in the openshift-user-workload-monitoring namespace:
apiVersion: v1
kind: Secret
metadata:
  name: rw-bearer-auth
  namespace: openshift-user-workload-monitoring
stringData:
  token: <authentication_token>
type: Opaque- 1
- The authentication token.
The following shows sample bearer token config map settings that use a Secret object named rw-bearer-auth in the openshift-user-workload-monitoring namespace:
apiVersion: v1
kind: ConfigMap
metadata:
  name: user-workload-monitoring-config
  namespace: openshift-user-workload-monitoring
data:
  config.yaml: |
    prometheus:
      remoteWrite:
      - url: "https://authorization.example.com/api/write"
        authorization:
          type: Bearer
          credentials:
            name: rw-bearer-auth
key: token 4.4.1.2.4. Sample YAML for OAuth 2.0 authentication
The following shows sample OAuth 2.0 settings for a Secret object named oauth2-credentials in the openshift-user-workload-monitoring namespace:
apiVersion: v1
kind: Secret
metadata:
  name: oauth2-credentials
  namespace: openshift-user-workload-monitoring
stringData:
  id: <oauth2_id>
secret: <oauth2_secret>
type: Opaque
The following shows an oauth2 remote write authentication sample configuration that uses a Secret object named oauth2-credentials in the openshift-user-workload-monitoring namespace:
apiVersion: v1
kind: ConfigMap
metadata:
  name: user-workload-monitoring-config
  namespace: openshift-user-workload-monitoring
data:
  config.yaml: |
    prometheus:
      remoteWrite:
      - url: "https://test.example.com/api/write"
        oauth2:
          clientId:
            secret:
              name: oauth2-credentials
key: id
          clientSecret:
            name: oauth2-credentials
key: secret
tokenUrl: https://example.com/oauth2/token
scopes:
          - <scope_1>
          - <scope_2>
          endpointParams:
            param1: <parameter_1>
param2: <parameter_2>- 1 3
- The name of the corresponding
Secretobject. Note thatClientIdcan alternatively refer to aConfigMapobject, althoughclientSecretmust refer to aSecretobject. - 2 4
- The key that contains the OAuth 2.0 credentials in the specified
Secretobject. - 5
- The URL used to fetch a token with the specified
clientIdandclientSecret. - 6
- The OAuth 2.0 scopes for the authorization request. These scopes limit what data the tokens can access.
- 7
- The OAuth 2.0 authorization request parameters required for the authorization server.
4.4.1.2.5. Sample YAML for TLS client authentication
The following shows sample TLS client settings for a tls Secret object named mtls-bundle in the openshift-user-workload-monitoring namespace.
apiVersion: v1
kind: Secret
metadata:
  name: mtls-bundle
  namespace: openshift-user-workload-monitoring
data:
  ca.crt: <ca_cert>
client.crt: <client_cert>
client.key: <client_key>
type: tls
The following sample shows a tlsConfig remote write authentication configuration that uses a TLS Secret object named mtls-bundle.
apiVersion: v1
kind: ConfigMap
metadata:
  name: user-workload-monitoring-config
  namespace: openshift-user-workload-monitoring
data:
  config.yaml: |
    prometheus:
      remoteWrite:
      - url: "https://remote-write-endpoint.example.com"
        tlsConfig:
          ca:
            secret:
              name: mtls-bundle
key: ca.crt
          cert:
            secret:
              name: mtls-bundle
key: client.crt
          keySecret:
            name: mtls-bundle
key: client.key - 1 3 5
- The name of the corresponding
Secretobject that contains the TLS authentication credentials. Note thatcaandcertcan alternatively refer to aConfigMapobject, thoughkeySecretmust refer to aSecretobject. - 2
- The key in the specified
Secretobject that contains the CA certificate for the endpoint. - 4
- The key in the specified
Secretobject that contains the client certificate for the endpoint. - 6
- The key in the specified
Secretobject that contains the client key secret.
4.4.1.3. Example remote write queue configuration
You can use the queueConfig object for remote write to tune the remote write queue parameters. The following example shows the queue parameters with their default values for monitoring for user-defined projects in the openshift-user-workload-monitoring namespace.
Example configuration of remote write parameters with default values
apiVersion: v1
kind: ConfigMap
metadata:
  name: user-workload-monitoring-config
  namespace: openshift-user-workload-monitoring
data:
  config.yaml: |
    prometheus:
      remoteWrite:
      - url: "https://remote-write-endpoint.example.com"
        <endpoint_authentication_credentials>
        queueConfig:
          capacity: 10000
minShards: 1
maxShards: 50
maxSamplesPerSend: 2000
batchSendDeadline: 5s
minBackoff: 30ms
maxBackoff: 5s
retryOnRateLimit: false
sampleAgeLimit: 0s - 1
- The number of samples to buffer per shard before they are dropped from the queue.
- 2
- The minimum number of shards.
- 3
- The maximum number of shards.
- 4
- The maximum number of samples per send.
- 5
- The maximum time for a sample to wait in buffer.
- 6
- The initial time to wait before retrying a failed request. The time gets doubled for every retry up to the
maxbackofftime. - 7
- The maximum time to wait before retrying a failed request.
- 8
- Set this parameter to
trueto retry a request after receiving a 429 status code from the remote write storage. - 9
- The samples that are older than the
sampleAgeLimitlimit are dropped from the queue. If the value is undefined or set to0s, the parameter is ignored.
4.4.1.4. Table of remote write metrics
The following table contains remote write and remote write-adjacent metrics with further description to help solve issues during remote write configuration.
| Metric | Description |
|---|---|
|
| Shows the newest timestamp that Prometheus stored in the write-ahead log (WAL) for any sample. |
|
| Shows the newest timestamp that the remote write queue successfully sent. |
|
| The number of samples that remote write failed to send and had to resend to remote storage. A steady high rate for this metric indicates problems with the network or remote storage endpoint. |
|
| Shows how many shards are currently running for each remote endpoint. |
|
| Shows the calculated needed number of shards based on the current write throughput and the rate of incoming versus sent samples. |
|
| Shows the maximum number of shards based on the current configuration. |
|
| Shows the minimum number of shards based on the current configuration. |
|
| The WAL segment file that Prometheus is currently writing new data to. |
|
| The WAL segment file that each remote write instance is currently reading from. |
4.4.2. Creating cluster ID labels for metrics
You can create cluster ID labels for metrics by adding the write_relabel settings for remote write storage in the user-workload-monitoring-config config map in the openshift-user-workload-monitoring namespace.
When Prometheus scrapes user workload targets that expose a namespace label, the system stores this label as exported_namespace. This behavior ensures that the final namespace label value is equal to the namespace of the target pod. You cannot override this default configuration by setting the value of the honorLabels field to true for PodMonitor or ServiceMonitor objects.
Prerequisites
-
You have access to the cluster as a user with the
cluster-admincluster role, or as a user with theuser-workload-monitoring-config-editrole in theopenshift-user-workload-monitoringproject. - A cluster administrator has enabled monitoring for user-defined projects.
-
You have installed the OpenShift CLI (
oc). - You have configured remote write storage.
Procedure
Edit the
user-workload-monitoring-configconfig map in theopenshift-user-workload-monitoringproject:$ oc -n openshift-user-workload-monitoring edit configmap user-workload-monitoring-configIn the
writeRelabelConfigs:section underdata/config.yaml/prometheus/remoteWrite, add cluster ID relabel configuration values:apiVersion: v1 kind: ConfigMap metadata: name: user-workload-monitoring-config namespace: openshift-user-workload-monitoring data: config.yaml: | prometheus: remoteWrite: - url: "https://remote-write-endpoint.example.com" <endpoint_authentication_credentials> writeRelabelConfigs:1 - <relabel_config>2 The following sample shows how to forward a metric with the cluster ID label
cluster_id:apiVersion: v1 kind: ConfigMap metadata: name: user-workload-monitoring-config namespace: openshift-user-workload-monitoring data: config.yaml: | prometheus: remoteWrite: - url: "https://remote-write-endpoint.example.com" writeRelabelConfigs: - sourceLabels: - __tmp_openshift_cluster_id__1 targetLabel: cluster_id2 action: replace3 - 1
- The system initially applies a temporary cluster ID source label named
__tmp_openshift_cluster_id__. This temporary label gets replaced by the cluster ID label name that you specify. - 2
- Specify the name of the cluster ID label for metrics sent to remote write storage. If you use a label name that already exists for a metric, that value is overwritten with the name of this cluster ID label. For the label name, do not use
__tmp_openshift_cluster_id__. The final relabeling step removes labels that use this name. - 3
- The
replacewrite relabel action replaces the temporary label with the target label for outgoing metrics. This action is the default and is applied if no action is specified.
- Save the file to apply the changes. The new configuration is applied automatically.
4.4.3. Setting up metrics collection for user-defined projects
You can create a ServiceMonitor resource to scrape metrics from a service endpoint in a user-defined project. This assumes that your application uses a Prometheus client library to expose metrics to the /metrics canonical name.
This section describes how to deploy a sample service in a user-defined project and then create a ServiceMonitor resource that defines how that service should be monitored.
4.4.3.1. Deploying a sample service
To test monitoring of a service in a user-defined project, you can deploy a sample service.
Prerequisites
-
You have access to the cluster as a user with the
cluster-admincluster role or as a user with administrative permissions for the namespace.
Procedure
-
Create a YAML file for the service configuration. In this example, it is called
prometheus-example-app.yaml. Add the following deployment and service configuration details to the file:
apiVersion: v1
kind: Namespace
metadata:
  name: ns1
---
apiVersion: apps/v1
kind: Deployment
metadata:
  labels:
    app: prometheus-example-app
  name: prometheus-example-app
  namespace: ns1
spec:
  replicas: 1
  selector:
    matchLabels:
      app: prometheus-example-app
  template:
    metadata:
      labels:
        app: prometheus-example-app
    spec:
      containers:
      - image: ghcr.io/rhobs/prometheus-example-app:0.4.2
        imagePullPolicy: IfNotPresent
        name: prometheus-example-app
---
apiVersion: v1
kind: Service
metadata:
  labels:
    app: prometheus-example-app
  name: prometheus-example-app
  namespace: ns1
spec:
  ports:
  - port: 8080
    protocol: TCP
    targetPort: 8080
    name: web
  selector:
    app: prometheus-example-app
  type: ClusterIP
This configuration deploys a service named
prometheus-example-appin the user-definedns1project. This service exposes the customversionmetric.Apply the configuration to the cluster:
$ oc apply -f prometheus-example-app.yamlIt takes some time to deploy the service.
You can check that the pod is running:
$ oc -n ns1 get podExample output
NAME                                      READY     STATUS    RESTARTS   AGE
prometheus-example-app-7857545cb7-sbgwq   1/1       Running   0          81m
4.4.3.2. Specifying how a service is monitored
To use the metrics exposed by your service, you must configure Red Hat OpenShift Service on AWS monitoring to scrape metrics from the /metrics endpoint. You can do this using a ServiceMonitor custom resource definition (CRD) that specifies how a service should be monitored, or a PodMonitor CRD that specifies how a pod should be monitored. The former requires a Service object, while the latter does not, allowing Prometheus to directly scrape metrics from the metrics endpoint exposed by a pod.
This procedure shows you how to create a ServiceMonitor resource for a service in a user-defined project.
Prerequisites
-
You have access to the cluster as a user with the
cluster-admincluster role or themonitoring-editcluster role. - You have enabled monitoring for user-defined projects.
For this example, you have deployed the
prometheus-example-appsample service in thens1project.NoteThe
prometheus-example-appsample service does not support TLS authentication.
Procedure
-
Create a new YAML configuration file named
example-app-service-monitor.yaml. Add a
ServiceMonitorresource to the YAML file. The following example creates a service monitor namedprometheus-example-monitorto scrape metrics exposed by theprometheus-example-appservice in thens1namespace:apiVersion: monitoring.coreos.com/v1 kind: ServiceMonitor metadata: name: prometheus-example-monitor namespace: ns11 spec: endpoints: - interval: 30s port: web2 scheme: http selector:3 matchLabels: app: prometheus-example-appNoteA
ServiceMonitorresource in a user-defined namespace can only discover services in the same namespace. That is, thenamespaceSelectorfield of theServiceMonitorresource is always ignored.Apply the configuration to the cluster:
$ oc apply -f example-app-service-monitor.yamlIt takes some time to deploy the
ServiceMonitorresource.Verify that the
ServiceMonitorresource is running:$ oc -n <namespace> get servicemonitorExample output
NAME AGE prometheus-example-monitor 81m
4.4.3.3. Example service endpoint authentication settings
You can configure authentication for service endpoints for user-defined project monitoring by using ServiceMonitor and PodMonitor custom resource definitions (CRDs).
The following samples show different authentication settings for a ServiceMonitor resource. Each sample shows how to configure a corresponding Secret object that contains authentication credentials and other relevant settings.
4.4.3.3.1. Sample YAML authentication with a bearer token
The following sample shows bearer token settings for a Secret object named example-bearer-auth in the ns1 namespace:
Example bearer token secret
apiVersion: v1
kind: Secret
metadata:
name: example-bearer-auth
namespace: ns1
stringData:
token: <authentication_token> - 1
- Specify an authentication token.
The following sample shows bearer token authentication settings for a ServiceMonitor CRD. The example uses a Secret object named example-bearer-auth:
Example bearer token authentication settings
apiVersion: monitoring.coreos.com/v1
kind: ServiceMonitor
metadata:
  name: prometheus-example-monitor
  namespace: ns1
spec:
endpoints:
- authorization:
credentials:
key: token
name: example-bearer-auth
port: web
selector:
    matchLabels:
      app: prometheus-example-app
Do not use bearerTokenFile to configure bearer token. If you use the bearerTokenFile configuration, the ServiceMonitor resource is rejected.
4.4.3.3.2. Sample YAML for Basic authentication
The following sample shows Basic authentication settings for a Secret object named example-basic-auth in the ns1 namespace:
Example Basic authentication secret
apiVersion: v1
kind: Secret
metadata:
name: example-basic-auth
namespace: ns1
stringData:
user: <basic_username>
password: <basic_password>
The following sample shows Basic authentication settings for a ServiceMonitor CRD. The example uses a Secret object named example-basic-auth:
Example Basic authentication settings
apiVersion: monitoring.coreos.com/v1
kind: ServiceMonitor
metadata:
name: prometheus-example-monitor
namespace: ns1
spec:
endpoints:
- basicAuth:
username:
key: user
name: example-basic-auth
password:
key: password
name: example-basic-auth
    port: web
  selector:
    matchLabels:
app: prometheus-example-app4.4.3.3.3. Sample YAML authentication with OAuth 2.0
The following sample shows OAuth 2.0 settings for a Secret object named example-oauth2 in the ns1 namespace:
Example OAuth 2.0 secret
apiVersion: v1
kind: Secret
metadata:
name: example-oauth2
namespace: ns1
stringData:
id: <oauth2_id>
secret: <oauth2_secret>
The following sample shows OAuth 2.0 authentication settings for a ServiceMonitor CRD. The example uses a Secret object named example-oauth2:
Example OAuth 2.0 authentication settings
apiVersion: monitoring.coreos.com/v1
kind: ServiceMonitor
metadata:
name: prometheus-example-monitor
namespace: ns1
spec:
endpoints:
- oauth2:
clientId:
secret:
key: id
name: example-oauth2
clientSecret:
key: secret
name: example-oauth2
tokenUrl: https://example.com/oauth2/token
    port: web
  selector:
    matchLabels:
app: prometheus-example-app- 1
- The key that contains the OAuth 2.0 ID in the specified
Secretobject. - 2 4
- The name of the
Secretobject that contains the OAuth 2.0 credentials. - 3
- The key that contains the OAuth 2.0 secret in the specified
Secretobject. - 5
- The URL used to fetch a token with the specified
clientIdandclientSecret.
4.5. Configuring alerts and notifications for user workload monitoring
You can configure a local or external Alertmanager instance to route alerts from Prometheus to endpoint receivers. You can also attach custom labels to all time series and alerts to add useful metadata information.
4.5.1. Configuring external Alertmanager instances
The Red Hat OpenShift Service on AWS monitoring stack includes a local Alertmanager instance that routes alerts from Prometheus.
You can add external Alertmanager instances to route alerts for user-defined projects.
If you add the same external Alertmanager configuration for multiple clusters and disable the local instance for each cluster, you can then manage alert routing for multiple clusters by using a single external Alertmanager instance.
Prerequisites
-
You have access to the cluster as a user with the
cluster-admincluster role or as a user with theuser-workload-monitoring-config-editrole in theopenshift-user-workload-monitoringproject. - A cluster administrator has enabled monitoring for user-defined projects.
-
You have installed the OpenShift CLI (
oc).
Procedure
Edit the
user-workload-monitoring-configconfig map in theopenshift-user-workload-monitoringproject:$ oc -n openshift-user-workload-monitoring edit configmap user-workload-monitoring-configAdd an
additionalAlertmanagerConfigssection with configuration details underdata/config.yaml/<component>:apiVersion: v1 kind: ConfigMap metadata: name: user-workload-monitoring-config namespace: openshift-user-workload-monitoring data: config.yaml: | <component>:1 additionalAlertmanagerConfigs: - <alertmanager_specification>2 - 2
- Substitute
<alertmanager_specification>with authentication and other configuration details for additional Alertmanager instances. Currently supported authentication methods are bearer token (bearerToken) and client TLS (tlsConfig). - 1
- Substitute
<component>for one of two supported external Alertmanager components:prometheusorthanosRuler.
The following sample config map configures an additional Alertmanager for Thanos Ruler by using a bearer token with client TLS authentication:
apiVersion: v1 kind: ConfigMap metadata: name: user-workload-monitoring-config namespace: openshift-user-workload-monitoring data: config.yaml: | thanosRuler: additionalAlertmanagerConfigs: - scheme: https pathPrefix: / timeout: "30s" apiVersion: v1 bearerToken: name: alertmanager-bearer-token key: token tlsConfig: key: name: alertmanager-tls key: tls.key cert: name: alertmanager-tls key: tls.crt ca: name: alertmanager-tls key: tls.ca staticConfigs: - external-alertmanager1-remote.com - external-alertmanager1-remote2.com- Save the file to apply the changes. The pods affected by the new configuration are automatically redeployed.
4.5.2. Configuring secrets for Alertmanager
The Red Hat OpenShift Service on AWS monitoring stack includes Alertmanager, which routes alerts from Prometheus to endpoint receivers. If you need to authenticate with a receiver so that Alertmanager can send alerts to it, you can configure Alertmanager to use a secret that contains authentication credentials for the receiver.
For example, you can configure Alertmanager to use a secret to authenticate with an endpoint receiver that requires a certificate issued by a private Certificate Authority (CA). You can also configure Alertmanager to use a secret to authenticate with a receiver that requires a password file for Basic HTTP authentication. In either case, authentication details are contained in the Secret object rather than in the ConfigMap object.
4.5.2.1. Adding a secret to the Alertmanager configuration
You can add secrets to the Alertmanager configuration by editing the user-workload-monitoring-config config map in the openshift-user-workload-monitoring project.
After you add a secret to the config map, the secret is mounted as a volume at /etc/alertmanager/secrets/<secret_name> within the alertmanager container for the Alertmanager pods.
Prerequisites
-
You have access to the cluster as a user with the
cluster-admincluster role or as a user with theuser-workload-monitoring-config-editrole in theopenshift-user-workload-monitoringproject. - A cluster administrator has enabled monitoring for user-defined projects.
-
You have created the secret to be configured in Alertmanager in the
openshift-user-workload-monitoringproject. -
You have installed the OpenShift CLI (
oc).
Procedure
Edit the
user-workload-monitoring-configconfig map in theopenshift-user-workload-monitoringproject:$ oc -n openshift-user-workload-monitoring edit configmap user-workload-monitoring-configAdd a
secrets:section underdata/config.yaml/alertmanagerwith the following configuration:apiVersion: v1 kind: ConfigMap metadata: name: user-workload-monitoring-config namespace: openshift-user-workload-monitoring data: config.yaml: | alertmanager: secrets:1 - <secret_name_1>2 - <secret_name_2>- 1
- This section contains the secrets to be mounted into Alertmanager. The secrets must be located within the same namespace as the Alertmanager object.
- 2
- The name of the
Secretobject that contains authentication credentials for the receiver. If you add multiple secrets, place each one on a new line.
The following sample config map settings configure Alertmanager to use two
Secretobjects namedtest-secret-basic-authandtest-secret-api-token:apiVersion: v1 kind: ConfigMap metadata: name: user-workload-monitoring-config namespace: openshift-user-workload-monitoring data: config.yaml: | alertmanager: secrets: - test-secret-basic-auth - test-secret-api-token- Save the file to apply the changes. The new configuration is applied automatically.
4.5.3. Attaching additional labels to your time series and alerts
You can attach custom labels to all time series and alerts leaving Prometheus by using the external labels feature of Prometheus.
Prerequisites
-
You have access to the cluster as a user with the
cluster-admincluster role or as a user with theuser-workload-monitoring-config-editrole in theopenshift-user-workload-monitoringproject. - A cluster administrator has enabled monitoring for user-defined projects.
-
You have installed the OpenShift CLI (
oc).
Procedure
Edit the
user-workload-monitoring-configconfig map in theopenshift-user-workload-monitoringproject:$ oc -n openshift-user-workload-monitoring edit configmap user-workload-monitoring-configDefine labels you want to add for every metric under
data/config.yaml:apiVersion: v1 kind: ConfigMap metadata: name: user-workload-monitoring-config namespace: openshift-user-workload-monitoring data: config.yaml: | prometheus: externalLabels: <key>: <value>1 - 1
- Substitute
<key>: <value>with key-value pairs where<key>is a unique name for the new label and<value>is its value.
Warning-
Do not use
prometheusorprometheus_replicaas key names, because they are reserved and will be overwritten. -
Do not use
clusteras a key name. Using it can cause issues where you are unable to see data in the developer dashboards.
NoteIn the
openshift-user-workload-monitoringproject, Prometheus handles metrics and Thanos Ruler handles alerting and recording rules. SettingexternalLabelsforprometheusin theuser-workload-monitoring-configConfigMapobject will only configure external labels for metrics and not for any rules.For example, to add metadata about the region and environment to all time series and alerts, use the following example:
apiVersion: v1 kind: ConfigMap metadata: name: user-workload-monitoring-config namespace: openshift-user-workload-monitoring data: config.yaml: | prometheus: externalLabels: region: eu environment: prod- Save the file to apply the changes. The pods affected by the new configuration are automatically redeployed.
4.5.4. Configuring alert notifications
In Red Hat OpenShift Service on AWS, an administrator can enable alert routing for user-defined projects with one of the following methods:
- Use the default platform Alertmanager instance.
- Use a separate Alertmanager instance only for user-defined projects.
Developers and other users with the alert-routing-edit cluster role can configure custom alert notifications for their user-defined projects by configuring alert receivers.
Review the following limitations of alert routing for user-defined projects:
-
User-defined alert routing is scoped to the namespace in which the resource is defined. For example, a routing configuration in namespace
ns1only applies toPrometheusRulesresources in the same namespace. -
When a namespace is excluded from user-defined monitoring,
AlertmanagerConfigresources in the namespace cease to be part of the Alertmanager configuration.
4.5.4.1. Configuring alert routing for user-defined projects
If you are a non-administrator user who has been given the alert-routing-edit cluster role, you can create or edit alert routing for user-defined projects.
Prerequisites
- A cluster administrator has enabled monitoring for user-defined projects.
- A cluster administrator has enabled alert routing for user-defined projects.
-
You are logged in as a user that has the
alert-routing-editcluster role for the project for which you want to create alert routing. -
You have installed the OpenShift CLI (
oc).
Procedure
-
Create a YAML file for alert routing. The example in this procedure uses a file called
example-app-alert-routing.yaml. Add an
AlertmanagerConfigYAML definition to the file. For example:apiVersion: monitoring.coreos.com/v1beta1 kind: AlertmanagerConfig metadata: name: example-routing namespace: ns1 spec: route: receiver: default groupBy: [job] receivers: - name: default webhookConfigs: - url: https://example.org/post- Save the file.
Apply the resource to the cluster:
$ oc apply -f example-app-alert-routing.yamlThe configuration is automatically applied to the Alertmanager pods.
4.5.4.2. Configuring alert routing for user-defined projects with the Alertmanager secret
If you have enabled a separate instance of Alertmanager that is dedicated to user-defined alert routing, you can customize where and how the instance sends notifications by editing the alertmanager-user-workload secret in the openshift-user-workload-monitoring namespace.
All features of a supported version of upstream Alertmanager are also supported in an Red Hat OpenShift Service on AWS Alertmanager configuration. To check all the configuration options of a supported version of upstream Alertmanager, see Alertmanager configuration (Prometheus documentation).
Prerequisites
-
You have access to the cluster as a user with the
cluster-admincluster role. - You have enabled a separate instance of Alertmanager for user-defined alert routing.
-
You have installed the OpenShift CLI (
oc).
Procedure
Print the currently active Alertmanager configuration into the file
alertmanager.yaml:$ oc -n openshift-user-workload-monitoring get secret alertmanager-user-workload --template='{{ index .data "alertmanager.yaml" }}' | base64 --decode > alertmanager.yamlEdit the configuration in
alertmanager.yaml:global: http_config: proxy_from_environment: true1 route: receiver: Default group_by: - name: Default routes: - matchers: - "service = prometheus-example-monitor"2 receiver: <receiver>3 receivers: - name: Default - name: <receiver> <receiver_configuration>4 - 1
- If you configured an HTTP cluster-wide proxy, set the
proxy_from_environmentparameter totrueto enable proxying for all alert receivers. - 2
- Specify labels to match your alerts. This example targets all alerts that have the
service="prometheus-example-monitor"label. - 3
- Specify the name of the receiver to use for the alerts group.
- 4
- Specify the receiver configuration.
Apply the new configuration in the file:
$ oc -n openshift-user-workload-monitoring create secret generic alertmanager-user-workload --from-file=alertmanager.yaml --dry-run=client -o=yaml | oc -n openshift-user-workload-monitoring replace secret --filename=-
4.5.4.3. Configuring different alert receivers for default platform alerts and user-defined alerts
You can configure different alert receivers for default platform alerts and user-defined alerts to ensure the following results:
- All default platform alerts are sent to a receiver owned by the team in charge of these alerts.
- All user-defined alerts are sent to another receiver so that the team can focus only on platform alerts.
You can achieve this by using the openshift_io_alert_source="platform" label that is added by the Cluster Monitoring Operator to all platform alerts:
-
Use the
openshift_io_alert_source="platform"matcher to match default platform alerts. -
Use the
openshift_io_alert_source!="platform"or'openshift_io_alert_source=""'matcher to match user-defined alerts.
This configuration does not apply if you have enabled a separate instance of Alertmanager dedicated to user-defined alerts.
Chapter 5. Accessing metrics
5.1. Accessing metrics as an administrator
You can access metrics to monitor the performance of cluster components and your workloads.
5.1.1. Viewing a list of available metrics
As a cluster administrator or as a user with view permissions for all projects, you can view a list of metrics available in a cluster and output the list in JSON format.
Prerequisites
-
You are a cluster administrator, or you have access to the cluster as a user with the
cluster-monitoring-viewcluster role. -
You have installed the Red Hat OpenShift Service on AWS CLI (
oc). - You have obtained the Red Hat OpenShift Service on AWS API route for Thanos Querier.
You are able to get a bearer token by using the
oc whoami -tcommand.ImportantYou can only use bearer token authentication to access the Thanos Querier API route.
Procedure
If you have not obtained the Red Hat OpenShift Service on AWS API route for Thanos Querier, run the following command:
$ oc get routes -n openshift-monitoring thanos-querier -o jsonpath='{.status.ingress[0].host}'Retrieve a list of metrics in JSON format from the Thanos Querier API route by running the following command. This command uses
octo authenticate with a bearer token.$ curl -k -H "Authorization: Bearer $(oc whoami -t)" https://<thanos_querier_route>/api/v1/metadata1 - 1
- Replace
<thanos_querier_route>with the Red Hat OpenShift Service on AWS API route for Thanos Querier.
5.1.2. Querying metrics for all projects with the Red Hat OpenShift Service on AWS web console
Monitor the state of a cluster and any user-defined workloads by using the Red Hat OpenShift Service on AWS metrics query browser. The query browser uses Prometheus Query Language (PromQL) queries to examine metrics visualized on a plot.
As a cluster administrator or as a user with view permissions for all projects, you can access metrics for all default Red Hat OpenShift Service on AWS and user-defined projects in the Metrics UI.
Prerequisites
-
You have access to the cluster as a user with the
cluster-admincluster role or with view permissions for all projects. -
You have installed the OpenShift CLI (
oc).
Procedure
- In the Red Hat OpenShift Service on AWS web console, click Observe → Metrics.
To add one or more queries, perform any of the following actions:
Expand Option Description Select an existing query.
From the Select query drop-down list, select an existing query.
Create a custom query.
Add your Prometheus Query Language (PromQL) query to the Expression field.
As you type a PromQL expression, autocomplete suggestions appear in a drop-down list. These suggestions include functions, metrics, labels, and time tokens. Use the keyboard arrows to select one of these suggested items and then press Enter to add the item to your expression. Move your mouse pointer over a suggested item to view a brief description of that item.
Add multiple queries.
Click Add query.
Duplicate an existing query.
Click the options menu
 next to the query, then choose Duplicate query.
Disable a query from being run.
Click the options menu
next to the query and choose Disable query.
To run queries that you created, click Run queries. The metrics from the queries are visualized on the plot. If a query is invalid, the UI shows an error message.
Note- When drawing time series graphs, queries that operate on large amounts of data might time out or overload the browser. To avoid this, click Hide graph and calibrate your query by using only the metrics table. Then, after finding a feasible query, enable the plot to draw the graphs.
- By default, the query table shows an expanded view that lists every metric and its current value. Click the ˅ down arrowhead to minimize the expanded view for a query.
- Optional: Save the page URL to use this set of queries again in the future.
Explore the visualized metrics. Initially, all metrics from all enabled queries are shown on the plot. Select which metrics are shown by performing any of the following actions:
Expand Option Description Hide all metrics from a query.
Click the options menu
for the query and click Hide all series.
Hide a specific metric.
Go to the query table and click the colored square near the metric name.
Zoom into the plot and change the time range.
Perform one of the following actions:
- Visually select the time range by clicking and dragging on the plot horizontally.
- Use the menu to select the time range.
Reset the time range.
Click Reset zoom.
Display outputs for all queries at a specific point in time.
Hover over the plot at the point you are interested in. The query outputs appear in a pop-up box.
Hide the plot.
Click Hide graph.
5.1.3. Getting detailed information about a metrics target
You can use the Red Hat OpenShift Service on AWS web console to view, search, and filter the endpoints that are currently targeted for scraping, which helps you to identify and troubleshoot problems. For example, you can view the current status of targeted endpoints to see when Red Hat OpenShift Service on AWS monitoring is not able to scrape metrics from a targeted component.
The Metrics targets page shows targets for default Red Hat OpenShift Service on AWS projects and for user-defined projects.
Prerequisites
- You have access to the cluster as an administrator for the project for which you want to view metrics targets.
Procedure
In the Red Hat OpenShift Service on AWS web console, go to Observe → Targets. The Metrics targets page opens with a list of all service endpoint targets that are being scraped for metrics.
This page shows details about targets for default Red Hat OpenShift Service on AWS and user-defined projects. This page lists the following information for each target:
- Service endpoint URL being scraped
-
The
ServiceMonitorresource being monitored - The up or down status of the target
- Namespace
- Last scrape time
- Duration of the last scrape
Optional: To find a specific target, perform any of the following actions:
Expand Option Description Filter the targets by status and source.
Choose filters in the Filter list.
The following filtering options are available:
Status filters:
- Up. The target is currently up and being actively scraped for metrics.
- Down. The target is currently down and not being scraped for metrics.
Source filters:
- Platform. Platform-level targets relate only to default Red Hat OpenShift Service on AWS projects. These projects provide core Red Hat OpenShift Service on AWS functionality.
- User. User targets relate to user-defined projects. These projects are user-created and can be customized.
Search for a target by name or label.
Enter a search term in the Text or Label field next to the search box.
Sort the targets.
Click one or more of the Endpoint Status, Namespace, Last Scrape, and Scrape Duration column headers.
Click the URL in the Endpoint column for a target to go to its Target details page. This page provides information about the target, including the following information:
- The endpoint URL being scraped for metrics
- The current Up or Down status of the target
- A link to the namespace
-
A link to the
ServiceMonitorresource details - Labels attached to the target
- The most recent time that the target was scraped for metrics
5.1.4. Reviewing monitoring dashboards as a cluster administrator
As an administrator, you can view dashboards relating to core Red Hat OpenShift Service on AWS cluster components.
Starting with Red Hat OpenShift Service on AWS 4.19, the perspectives in the web console have unified. The Developer perspective is no longer enabled by default.
All users can interact with all Red Hat OpenShift Service on AWS web console features. However, if you are not the cluster owner, you might need to request permission to access certain features from the cluster owner.
You can still enable the Developer perspective. On the Getting Started pane in the web console, you can take a tour of the console, find information on setting up your cluster, view a quick start for enabling the Developer perspective, and follow links to explore new features and capabilities.
Prerequisites
-
You have access to the cluster as a user with the
cluster-admincluster role.
Procedure
- In the Red Hat OpenShift Service on AWS web console, go to Observe → Dashboards.
- Choose a dashboard in the Dashboard list. Some dashboards, such as etcd and Prometheus dashboards, produce additional sub-menus when selected.
Optional: Select a time range for the graphs in the Time range list.
- Select a predefined time period.
Set a custom time range by clicking Custom time range in the Time range list.
- Input or select the From and To dates and times.
- Click Save to save the custom time range.
- Optional: Select a Refresh interval.
- Hover over each of the graphs within a dashboard to display detailed information about specific items.
5.2. Accessing metrics as a developer
You can access metrics to monitor the performance of your cluster workloads.
5.2.1. Viewing a list of available metrics
As a cluster administrator or as a user with view permissions for all projects, you can view a list of metrics available in a cluster and output the list in JSON format.
Prerequisites
-
You are a cluster administrator, or you have access to the cluster as a user with the
cluster-monitoring-viewcluster role. -
You have installed the Red Hat OpenShift Service on AWS CLI (
oc). - You have obtained the Red Hat OpenShift Service on AWS API route for Thanos Querier.
You are able to get a bearer token by using the
oc whoami -tcommand.ImportantYou can only use bearer token authentication to access the Thanos Querier API route.
Procedure
If you have not obtained the Red Hat OpenShift Service on AWS API route for Thanos Querier, run the following command:
$ oc get routes -n openshift-monitoring thanos-querier -o jsonpath='{.status.ingress[0].host}'Retrieve a list of metrics in JSON format from the Thanos Querier API route by running the following command. This command uses
octo authenticate with a bearer token.$ curl -k -H "Authorization: Bearer $(oc whoami -t)" https://<thanos_querier_route>/api/v1/metadata1 - 1
- Replace
<thanos_querier_route>with the Red Hat OpenShift Service on AWS API route for Thanos Querier.
5.2.2. Querying metrics for user-defined projects with the Red Hat OpenShift Service on AWS web console
Monitor user-defined workloads by using the Red Hat OpenShift Service on AWS metrics query browser. The query browser uses Prometheus Query Language (PromQL) queries to examine metrics visualized on a plot.
As a developer, you must specify a project name when querying metrics. You must have the required privileges to view metrics for the selected project.
Developers cannot access the third-party UIs provided with Red Hat OpenShift Service on AWS monitoring.
Prerequisites
- You have access to the cluster as a developer or as a user with view permissions for the project that you are viewing metrics for.
- You have enabled monitoring for user-defined projects.
- You have deployed a service in a user-defined project.
-
You have created a
ServiceMonitorcustom resource definition (CRD) for the service to define how the service is monitored.
Procedure
- In the Red Hat OpenShift Service on AWS web console, click Observe → Metrics.
To add one or more queries, perform any of the following actions:
Expand Option Description Select an existing query.
From the Select query drop-down list, select an existing query.
Create a custom query.
Add your Prometheus Query Language (PromQL) query to the Expression field.
As you type a PromQL expression, autocomplete suggestions appear in a drop-down list. These suggestions include functions, metrics, labels, and time tokens. Use the keyboard arrows to select one of these suggested items and then press Enter to add the item to your expression. Move your mouse pointer over a suggested item to view a brief description of that item.
Add multiple queries.
Click Add query.
Duplicate an existing query.
Click the options menu
next to the query, then choose Duplicate query.
Disable a query from being run.
Click the options menu
next to the query and choose Disable query.
To run queries that you created, click Run queries. The metrics from the queries are visualized on the plot. If a query is invalid, the UI shows an error message.
Note- When drawing time series graphs, queries that operate on large amounts of data might time out or overload the browser. To avoid this, click Hide graph and calibrate your query by using only the metrics table. Then, after finding a feasible query, enable the plot to draw the graphs.
- By default, the query table shows an expanded view that lists every metric and its current value. Click the ˅ down arrowhead to minimize the expanded view for a query.
- Optional: Save the page URL to use this set of queries again in the future.
Explore the visualized metrics. Initially, all metrics from all enabled queries are shown on the plot. Select which metrics are shown by performing any of the following actions:
Expand Option Description Hide all metrics from a query.
Click the options menu
for the query and click Hide all series.
Hide a specific metric.
Go to the query table and click the colored square near the metric name.
Zoom into the plot and change the time range.
Perform one of the following actions:
- Visually select the time range by clicking and dragging on the plot horizontally.
- Use the menu to select the time range.
Reset the time range.
Click Reset zoom.
Display outputs for all queries at a specific point in time.
Hover over the plot at the point you are interested in. The query outputs appear in a pop-up box.
Hide the plot.
Click Hide graph.
5.2.3. Reviewing monitoring dashboards as a developer
As a developer, you can view dashboards relating to projects you have permissions for.
Starting with Red Hat OpenShift Service on AWS 4.19, the perspectives in the web console have unified. The Developer perspective is no longer enabled by default.
All users can interact with all Red Hat OpenShift Service on AWS web console features. However, if you are not the cluster owner, you might need to request permission to access certain features from the cluster owner.
You can still enable the Developer perspective. On the Getting Started pane in the web console, you can take a tour of the console, find information on setting up your cluster, view a quick start for enabling the Developer perspective, and follow links to explore new features and capabilities.
Prerequisites
- You have access to the cluster as a developer or as a user.
- You have view permissions for the project that you are viewing the dashboard for.
- A cluster administrator has enabled the Developer perspective in the web console.
Procedure
- In the Developer perspective of the Red Hat OpenShift Service on AWS web console, click Observe and go to the Dashboards tab.
- Select a project from the Project: drop-down list.
- Select a dashboard from the Dashboard drop-down list to see the filtered metrics.
Optional: Select a time range for the graphs in the Time range list.
- Select a predefined time period.
Set a custom time range by clicking Custom time range in the Time range list.
- Input or select the From and To dates and times.
- Click Save to save the custom time range.
- Optional: Select a Refresh interval.
- Hover over each of the graphs within a dashboard to display detailed information about specific items.
5.3. Accessing monitoring APIs by using the CLI
In Red Hat OpenShift Service on AWS, you can access web service APIs for some monitoring components from the command-line interface (CLI).
In certain situations, accessing API endpoints can degrade the performance and scalability of your cluster, especially if you use endpoints to retrieve, send, or query large amounts of metrics data.
To avoid these issues, consider the following recommendations:
- Avoid querying endpoints frequently. Limit queries to a maximum of one every 30 seconds.
-
Do not retrieve all metrics data through the
/federateendpoint for Prometheus. Query the endpoint only when you want to retrieve a limited, aggregated data set. For example, retrieving fewer than 1,000 samples for each request helps minimize the risk of performance degradation.
5.3.1. About accessing monitoring web service APIs
To interact with the monitoring stack by using the command line, you can access web service API endpoints for Prometheus, Alertmanager, Thanos Ruler, and Thanos Querier. Direct API access requires bearer token authentication and the correct namespace permissions.
To access Thanos Ruler and Thanos Querier service APIs, the requesting account must have get permission on the namespaces resource, which can be granted by binding the cluster-monitoring-view cluster role to the account.
When you access web service API endpoints for monitoring components, be aware of the following limitations:
- You can only use bearer token authentication to access API endpoints.
-
You can only access endpoints in the
/apipath for a route. If you try to access an API endpoint in a web browser, anApplication is not availableerror occurs. To access monitoring features in a web browser, use the Red Hat OpenShift Service on AWS web console to review monitoring dashboards.
5.3.2. Accessing a monitoring web service API
The following example shows how to query the service API receivers for the Alertmanager service used in core platform monitoring. You can use a similar method to access the prometheus-k8s service for core platform Prometheus and the thanos-ruler service for Thanos Ruler.
Prerequisites
-
You are logged in to an account that is bound against the
monitoring-alertmanager-editrole in theopenshift-monitoringnamespace. You are logged in to an account that has permission to get the Alertmanager API route.
NoteIf your account does not have permission to get the Alertmanager API route, a cluster administrator can provide the URL for the route.
Procedure
Extract an authentication token by running the following command:
$ TOKEN=$(oc whoami -t)Extract the
alertmanager-mainAPI route URL by running the following command:$ HOST=$(oc -n openshift-monitoring get route alertmanager-main -ojsonpath='{.status.ingress[].host}')Query the service API receivers for Alertmanager by running the following command:
$ curl -H "Authorization: Bearer $TOKEN" -k "https://$HOST/api/v2/receivers"
5.3.3. Querying metrics by using the federation endpoint for Prometheus
You can use the federation endpoint for Prometheus to scrape platform and user-defined metrics from a network location outside the cluster. To do so, access the Prometheus /federate endpoint for the cluster via a Red Hat OpenShift Service on AWS route.
A delay in retrieving metrics data occurs when you use federation. This delay can affect the accuracy and timeliness of the scraped metrics.
Using the federation endpoint can also degrade the performance and scalability of your cluster, especially if you use the federation endpoint to retrieve large amounts of metrics data. To avoid these issues, follow these recommendations:
- Do not try to retrieve all metrics data via the federation endpoint for Prometheus. Query it only when you want to retrieve a limited, aggregated data set. For example, retrieving fewer than 1,000 samples for each request helps minimize the risk of performance degradation.
- Avoid frequent querying of the federation endpoint for Prometheus. Limit queries to a maximum of one every 30 seconds.
If you need to forward large amounts of data outside the cluster, use remote write instead. For more information, see the Configuring remote write storage section.
Prerequisites
-
You have installed the OpenShift CLI (
oc). You have access to the cluster as a user with the
cluster-monitoring-viewcluster role or have obtained a bearer token withgetpermission on thenamespacesresource.NoteYou can only use bearer token authentication to access the Prometheus federation endpoint.
You are logged in to an account that has permission to get the Prometheus federation route.
NoteIf your account does not have permission to get the Prometheus federation route, a cluster administrator can provide the URL for the route.
Procedure
Retrieve the bearer token by running the following the command:
$ TOKEN=$(oc whoami -t)Get the Prometheus federation route URL by running the following command:
$ HOST=$(oc -n openshift-monitoring get route prometheus-k8s-federate -ojsonpath='{.status.ingress[].host}')Query metrics from the
/federateroute. The following example command queriesupmetrics:$ curl -G -k -H "Authorization: Bearer $TOKEN" https://$HOST/federate --data-urlencode 'match[]=up'Example output
# TYPE up untyped
up{apiserver="kube-apiserver",endpoint="https",instance="10.0.143.148:6443",job="apiserver",namespace="default",service="kubernetes",prometheus="openshift-monitoring/k8s",prometheus_replica="prometheus-k8s-0"} 1 1657035322214
up{apiserver="kube-apiserver",endpoint="https",instance="10.0.148.166:6443",job="apiserver",namespace="default",service="kubernetes",prometheus="openshift-monitoring/k8s",prometheus_replica="prometheus-k8s-0"} 1 1657035338597
up{apiserver="kube-apiserver",endpoint="https",instance="10.0.173.16:6443",job="apiserver",namespace="default",service="kubernetes",prometheus="openshift-monitoring/k8s",prometheus_replica="prometheus-k8s-0"} 1 1657035343834
...
5.3.4. Accessing metrics from outside the cluster for custom applications
You can query Prometheus metrics from outside the cluster when monitoring your own services with user-defined projects. Access this data from outside the cluster by using the thanos-querier route.
This access only supports using a bearer token for authentication.
Prerequisites
- You have deployed your own service, following the "Enabling monitoring for user-defined projects" procedure.
-
You are logged in to an account with the
cluster-monitoring-viewcluster role, which provides permission to access the Thanos Querier API. You are logged in to an account that has permission to get the Thanos Querier API route.
NoteIf your account does not have permission to get the Thanos Querier API route, a cluster administrator can provide the URL for the route.
Procedure
Extract an authentication token to connect to Prometheus by running the following command:
$ TOKEN=$(oc whoami -t)Extract the
thanos-querierAPI route URL by running the following command:$ HOST=$(oc -n openshift-monitoring get route thanos-querier -ojsonpath='{.status.ingress[].host}')Set the namespace to the namespace in which your service is running by using the following command:
$ NAMESPACE=ns1Query the metrics of your own services in the command line by running the following command:
$ curl -H "Authorization: Bearer $TOKEN" -k "https://$HOST/api/v1/query?" --data-urlencode "query=up{namespace='$NAMESPACE'}"The output shows the status for each application pod that Prometheus is scraping:
The formatted example output
{ "status": "success", "data": { "resultType": "vector", "result": [ { "metric": { "__name__": "up", "endpoint": "web", "instance": "10.129.0.46:8080", "job": "prometheus-example-app", "namespace": "ns1", "pod": "prometheus-example-app-68d47c4fb6-jztp2", "service": "prometheus-example-app" }, "value": [ 1591881154.748, "1" ] } ], } }Note-
The formatted example output uses a filtering tool, such as
jq, to provide the formatted indented JSON. See the jq Manual (jq documentation) for more information about usingjq. - The command requests an instant query endpoint of the Thanos Querier service, which evaluates selectors at one point in time.
-
The formatted example output uses a filtering tool, such as
5.3.5. Resources reference for the Cluster Monitoring Operator
This document describes the following resources deployed and managed by the Cluster Monitoring Operator (CMO):
Use this information when you want to configure API endpoint connections to retrieve, send, or query metrics data.
In certain situations, accessing endpoints can degrade the performance and scalability of your cluster, especially if you use endpoints to retrieve, send, or query large amounts of metrics data.
To avoid these issues, follow these recommendations:
- Avoid querying endpoints frequently. Limit queries to a maximum of one every 30 seconds.
-
Do not try to retrieve all metrics data via the
/federateendpoint. Query it only when you want to retrieve a limited, aggregated data set. For example, retrieving fewer than 1,000 samples for each request helps minimize the risk of performance degradation.
5.3.5.1. CMO routes resources
5.3.5.1.1. openshift-monitoring/alertmanager-main
Expose the /api endpoints of the alertmanager-main service via a router.
5.3.5.1.2. openshift-monitoring/prometheus-k8s
Expose the /api endpoints of the prometheus-k8s service via a router.
5.3.5.1.3. openshift-monitoring/prometheus-k8s-federate
Expose the /federate endpoint of the prometheus-k8s service via a router.
5.3.5.1.4. openshift-user-workload-monitoring/federate
Expose the /federate endpoint of the prometheus-user-workload service via a router.
5.3.5.1.5. openshift-monitoring/thanos-querier
Expose the /api endpoints of the thanos-querier service via a router.
5.3.5.1.6. openshift-user-workload-monitoring/thanos-ruler
Expose the /api endpoints of the thanos-ruler service via a router.
5.3.5.2. CMO services resources
5.3.5.2.1. openshift-monitoring/prometheus-operator-admission-webhook
Expose the admission webhook service which validates PrometheusRules and AlertmanagerConfig custom resources on port 8443.
5.3.5.2.2. openshift-user-workload-monitoring/alertmanager-user-workload
Expose the user-defined Alertmanager web server within the cluster on the following ports:
-
Port 9095 provides access to the Alertmanager endpoints. Granting access requires binding a user to the
monitoring-alertmanager-api-readerrole (for read-only operations) or themonitoring-alertmanager-api-writerrole in theopenshift-user-workload-monitoringproject. -
Port 9092 provides access to the Alertmanager endpoints restricted to a given project. Granting access requires binding a user to the
monitoring-rules-editcluster role ormonitoring-editcluster role in the project. -
Port 9097 provides access to the
/metricsendpoint only. This port is for internal use, and no other usage is guaranteed.
5.3.5.2.3. openshift-monitoring/alertmanager-main
Expose the Alertmanager web server within the cluster on the following ports:
Port 9094 provides access to all the Alertmanager endpoints. Granting access requires binding a user to the
monitoring-alertmanager-viewrole (for read-only operations) or themonitoring-alertmanager-editrole in theopenshift-monitoringproject.- Example monitoring-alertmanager-view permissions
The following example exercises permissions granted by the
monitoring-alertmanager-viewrole. The binding commands must be run by a user with the necessary privileges.Create a test namespace and a service account.
$ oc create namespace test-alertmanager-web-monitoring-alertmanager-view$ oc create serviceaccount am-client --namespace=test-alertmanager-web-monitoring-alertmanager-viewBind the role to the service account. The binding in this example is applied to a service account but can also be applied to any user.
$ oc create rolebinding test-alertmanager-web-monitoring-alertmanager-view \
  --namespace=openshift-monitoring \
  --role=monitoring-alertmanager-view \
  --serviceaccount=test-alertmanager-web-monitoring-alertmanager-view:am-client
Generate a token to access the endpoints.
$ TOKEN=$(oc create token am-client --namespace=test-alertmanager-web-monitoring-alertmanager-view)Access Alertmanager endpoints externally.
$ ROUTE=$(oc get route alertmanager-main --namespace=openshift-monitoring -ojsonpath={.spec.host})$ curl -k -H "Authorization: Bearer $TOKEN" "https://$ROUTE/api/v2/alerts?filter=alertname=Watchdog"Access Alertmanager endpoints from within the cluster.
$ curl -k -H "Authorization: Bearer $TOKEN" "https://alertmanager-main.openshift-monitoring:9094/api/v2/alerts?filter=alertname=Watchdog"
- Example monitoring-alertmanager-edit permissions
The following example exercises permissions granted by the
monitoring-alertmanager-editrole. The binding commands must be run by a user with the necessary privileges.Create a test namespace and a service account.
$ oc create namespace test-alertmanager-web-monitoring-alertmanager-edit$ oc create serviceaccount am-client --namespace=test-alertmanager-web-monitoring-alertmanager-editBind the role to the service account. The binding in this example is applied to a service account but can also be applied to any user.
$ oc create rolebinding test-alertmanager-web-monitoring-alertmanager-edit \
  --namespace=openshift-monitoring \
  --role=monitoring-alertmanager-edit \
  --serviceaccount=test-alertmanager-web-monitoring-alertmanager-edit:am-client
Generate a token to access the endpoints.
$ TOKEN=$(oc create token am-client --namespace=test-alertmanager-web-monitoring-alertmanager-edit)Access Alertmanager endpoints externally.
$ ROUTE=$(oc get route alertmanager-main --namespace=openshift-monitoring -ojsonpath={.spec.host})$ curl -k -X POST "https://$ROUTE/api/v2/silences" \ -H "Authorization: Bearer $TOKEN" -H "Content-Type: application/json" \ -d '{ "matchers": [ { "name": "alertname", "value": "MyTestAlert1", "isRegex": false } ], "startsAt": "2044-01-01T00:00:00Z", "endsAt": "2044-01-01T00:00:01Z", "createdBy": "test-alertmanager-web-monitoring-alertmanager-edit/am-client", "comment": "Silence test" }'Access Alertmanager endpoints from within the cluster.
$ curl -k -X POST  "https://alertmanager-main.openshift-monitoring:9094/api/v2/silences" \
  -H "Authorization: Bearer $TOKEN" -H "Content-Type: application/json" \
  -d '{
    "matchers": [
      {
        "name": "alertname",
        "value": "MyTestAlert2",
        "isRegex": false
      }
    ],
    "startsAt": "2044-01-01T00:00:00Z",
    "endsAt": "2044-01-01T00:00:01Z",
    "createdBy": "test-alertmanager-web-monitoring-alertmanager-edit/am-client",
    "comment": "Silence test"
  }'
Port 9092 provides access to the Alertmanager endpoints restricted to a given project. Granting access requires binding a user to the
monitoring-rules-editcluster role ormonitoring-editcluster role in the project.- Example monitoring-rules-edit permissions
The following example exercises permissions granted by the
monitoring-rules-editcluster role. The binding commands must be run by a user with the necessary privileges.Create a test namespace and a service account.
$ oc create namespace test-alertmanager-tenancy-monitoring-rules-edit$ oc create serviceaccount am-client --namespace=test-alertmanager-tenancy-monitoring-rules-editBind the role to the service account. The binding in this example is applied to a service account but can also be applied to any user.
$ oc create rolebinding test-alertmanager-tenancy-monitoring-rules-edit \
  --namespace=test-alertmanager-tenancy-monitoring-rules-edit \
  --clusterrole=monitoring-rules-edit \
  --serviceaccount=test-alertmanager-tenancy-monitoring-rules-edit:am-client
Generate a token to access the endpoints.
$ TOKEN=$(oc create token am-client --namespace=test-alertmanager-tenancy-monitoring-rules-edit)Access Alertmanager endpoints from within the cluster. The port is not exposed externally by default.
$ curl -k -f -H "Authorization: Bearer $TOKEN" "https://alertmanager-main.openshift-monitoring:9092/api/v2/alerts?namespace=test-alertmanager-tenancy-monitoring-rules-edit"$ curl -k -X POST -f "https://alertmanager-main.openshift-monitoring:9092/api/v2/silences?namespace=test-alertmanager-tenancy-monitoring-rules-edit" \ -H "Authorization: Bearer $TOKEN" -H "Content-Type: application/json" \ -d '{ "matchers": [ { "name": "alertname", "value": "MyTestAlert", "isRegex": false } ], "startsAt": "2044-01-01T00:00:00Z", "endsAt": "2044-01-01T00:00:01Z", "createdBy": "test-alertmanager-tenancy-monitoring-rules-edit/am-client", "comment": "Silence test" }'
- Example monitoring-edit permissions
The following example exercises permissions granted by the
monitoring-editcluster role. The binding commands must be run by a user with the necessary privileges.Create a test namespace and a service account.
$ oc create namespace test-alertmanager-tenancy-monitoring-edit$ oc create serviceaccount am-client --namespace=test-alertmanager-tenancy-monitoring-editBind the role to the service account. The binding in this example is applied to a service account but can also be applied to any user.
$ oc create rolebinding test-alertmanager-tenancy-monitoring-edit \
  --namespace=test-alertmanager-tenancy-monitoring-edit \
  --clusterrole=monitoring-edit \
  --serviceaccount=test-alertmanager-tenancy-monitoring-edit:am-client
Generate a token to access the endpoints.
$ TOKEN=$(oc create token am-client --namespace=test-alertmanager-tenancy-monitoring-edit)Access Alertmanager endpoints from within the cluster. The port is not exposed externally by default.
$ curl -k -f -H "Authorization: Bearer $TOKEN" "https://alertmanager-main.openshift-monitoring:9092/api/v2/alerts?namespace=test-alertmanager-tenancy-monitoring-edit"$ curl -k -X POST -f "https://alertmanager-main.openshift-monitoring:9092/api/v2/silences?namespace=test-alertmanager-tenancy-monitoring-edit" \ -H "Authorization: Bearer $TOKEN" -H "Content-Type: application/json" \ -d '{ "matchers": [ { "name": "alertname", "value": "MyTestAlert", "isRegex": false } ], "startsAt": "2044-01-01T00:00:00Z", "endsAt": "2044-01-01T00:00:01Z", "createdBy": "test-alertmanager-tenancy-monitoring-edit/am-client", "comment": "Silence test" }'
-
Port 9097 provides access to the
/metricsendpoint only. This port is for internal use, and no other usage is guaranteed.
5.3.5.2.4. openshift-monitoring/kube-state-metrics
Expose kube-state-metrics /metrics endpoints within the cluster on the following ports:
- Port 8443 provides access to the Kubernetes resource metrics. This port is for internal use, and no other usage is guaranteed.
- Port 9443 provides access to the internal kube-state-metrics metrics. This port is for internal use, and no other usage is guaranteed.
5.3.5.2.5. openshift-monitoring/metrics-server
Expose the metrics-server web server on port 443. This port is for internal use, and no other usage is guaranteed.
5.3.5.2.6. openshift-monitoring/monitoring-plugin
Expose the monitoring plugin service on port 9443. This port is for internal use, and no other usage is guaranteed.
5.3.5.2.7. openshift-monitoring/node-exporter
Expose the /metrics endpoint on port 9100. This port is for internal use, and no other usage is guaranteed.
5.3.5.2.8. openshift-monitoring/openshift-state-metrics
Expose openshift-state-metrics /metrics endpoints within the cluster on the following ports:
- Port 8443 provides access to the OpenShift resource metrics. This port is for internal use, and no other usage is guaranteed.
-
Port 9443 provides access to the internal
openshift-state-metricsmetrics. This port is for internal use, and no other usage is guaranteed.
5.3.5.2.9. openshift-monitoring/prometheus-k8s
Expose the Prometheus web server within the cluster on the following ports:
Port 9091 provides access to all the Prometheus endpoints. Granting access requires binding a user to the
cluster-monitoring-viewcluster role orcluster-monitoring-metrics-apicluster role in theopenshift-monitoringproject.- Example cluster-monitoring-view permissions
The following example exercises permissions granted by the
cluster-monitoring-viewcluster role. The binding commands must be run by a user with the necessary privileges.Create a test namespace and a service account.
$ oc create namespace test-prometheus-web-cluster-monitoring-view$ oc create serviceaccount prom-client --namespace=test-prometheus-web-cluster-monitoring-viewBind the role to the service account. The binding in this example is applied to a service account but can also be applied to any user.
$ oc create rolebinding test-prometheus-web-cluster-monitoring-view \
  --namespace=openshift-monitoring \
  --clusterrole=cluster-monitoring-view \
  --serviceaccount=test-prometheus-web-cluster-monitoring-view:prom-client
Generate a token to access the endpoints.
$ TOKEN=$(oc create token prom-client --namespace=test-prometheus-web-cluster-monitoring-view)Access Prometheus endpoints externally.
$ ROUTE=$(oc get route prometheus-k8s --namespace=openshift-monitoring -ojsonpath={.spec.host})$ curl -k -H "Authorization: Bearer $TOKEN" "https://$ROUTE/api/v1/query?query=up"Access Prometheus endpoints from within the cluster.
$ curl -k -H "Authorization: Bearer $TOKEN" "https://prometheus-k8s.openshift-monitoring:9091/api/v1/query?query=up"
- Example cluster-monitoring-metrics-api permissions
The following example exercises permissions granted by the
cluster-monitoring-metrics-apirole. The binding commands must be run by a user with the necessary privileges.Create a test namespace and a service account.
$ oc create namespace test-prometheus-web-cluster-monitoring-metrics-api$ oc create serviceaccount prom-client --namespace=test-prometheus-web-cluster-monitoring-metrics-apiBind the role to the service account. The binding in this example is applied to a service account but can also be applied to any user.
$ oc create rolebinding test-prometheus-web-cluster-monitoring-metrics-api \
  --namespace=openshift-monitoring \
  --role=cluster-monitoring-metrics-api  \
  --serviceaccount=test-prometheus-web-cluster-monitoring-metrics-api:prom-client
Generate a token to access the endpoints.
$ TOKEN=$(oc create token prom-client --namespace=test-prometheus-web-cluster-monitoring-metrics-api)Access Prometheus endpoints externally.
$ ROUTE=$(oc get route prometheus-k8s --namespace=openshift-monitoring -ojsonpath={.spec.host})$ curl -k -H "Authorization: Bearer $TOKEN" "https://$ROUTE/api/v1/query?query=up"Access Prometheus endpoints from within the cluster.
$ curl -k -H "Authorization: Bearer $TOKEN" "https://prometheus-k8s.openshift-monitoring:9091/api/v1/query?query=up"
-
Port 9092 provides access to the
/metricsand/federateendpoints only. This port is for internal use, and no other usage is guaranteed.
5.3.5.2.10. openshift-user-workload-monitoring/prometheus-operator
Expose the /metrics endpoint on port 8443. This port is for internal use, and no other usage is guaranteed.
5.3.5.2.11. openshift-monitoring/prometheus-operator
Expose the /metrics endpoint on port 8443. This port is for internal use, and no other usage is guaranteed.
5.3.5.2.12. openshift-user-workload-monitoring/prometheus-user-workload
Expose the Prometheus web server within the cluster on the following ports:
-
Port 9091 provides access to the
/metricsendpoint only. This port is for internal use, and no other usage is guaranteed. -
Port 9092 provides access to the
/federateendpoint only. Granting access requires binding a user to thecluster-monitoring-viewcluster role.
This also exposes the /metrics endpoint of the Thanos sidecar web server on port 10902. This port is for internal use, and no other usage is guaranteed.
5.3.5.2.13. openshift-monitoring/telemeter-client
Expose the /metrics endpoint on port 8443. This port is for internal use, and no other usage is guaranteed.
5.3.5.2.14. openshift-monitoring/thanos-querier
Expose the Thanos Querier web server within the cluster on the following ports:
Port 9091 provides access to all the Thanos Querier endpoints. Granting access requires binding a user to the
cluster-monitoring-viewcluster role orcluster-monitoring-metrics-apicluster role in theopenshift-monitoringproject.- Example cluster-monitoring-view permissions
The following example exercises permissions granted by the
cluster-monitoring-viewcluster role. The binding commands must be run by a user with the necessary privileges.Create a test namespace and a service account.
$ oc create namespace test-thanos-querier-web-cluster-monitoring-view$ oc create serviceaccount thanos-client --namespace=test-thanos-querier-web-cluster-monitoring-viewBind the role to the service account. The binding in this example is applied to a service account but can also be applied to any user.
$ oc create rolebinding test-thanos-querier-web-cluster-monitoring-view \
  --namespace=openshift-monitoring \
  --clusterrole=cluster-monitoring-view \
  --serviceaccount=test-thanos-querier-web-cluster-monitoring-view:thanos-client
Generate a token to access the endpoints.
$ TOKEN=$(oc create token thanos-client --namespace=test-thanos-querier-web-cluster-monitoring-view)Access Thanos Querier endpoints externally.
$ ROUTE=$(oc get route thanos-querier --namespace=openshift-monitoring -ojsonpath={.spec.host})$ curl -k -H "Authorization: Bearer $TOKEN" "https://$ROUTE/api/v1/query?query=up"Access Thanos Querier endpoints from within the cluster.
$ curl -k -H "Authorization: Bearer $TOKEN" "https://thanos-querier.openshift-monitoring:9091/api/v1/query?query=up"
- Example cluster-monitoring-metrics-api permissions
The following example exercises permissions granted by the
cluster-monitoring-metrics-apirole. The binding commands must be run by a user with the necessary privileges.Create a test namespace and a service account.
$ oc create namespace test-thanos-querier-web-cluster-monitoring-metrics-api$ oc create serviceaccount thanos-client --namespace=test-thanos-querier-web-cluster-monitoring-metrics-apiBind the role to the service account. The binding in this example is applied to a service account but can also be applied to any user.
$ oc create rolebinding test-thanos-querier-web-cluster-monitoring-metrics-api \
  --namespace=openshift-monitoring \
  --role=cluster-monitoring-metrics-api  \
  --serviceaccount=test-thanos-querier-web-cluster-monitoring-metrics-api:thanos-client
Generate a token to access the endpoints.
$ TOKEN=$(oc create token thanos-client --namespace=test-thanos-querier-web-cluster-monitoring-metrics-api)Access Thanos Querier endpoints externally.
$ ROUTE=$(oc get route thanos-querier --namespace=openshift-monitoring -ojsonpath={.spec.host})$ curl -k -H "Authorization: Bearer $TOKEN" "https://$ROUTE/api/v1/query?query=up"Access Thanos Querier endpoints from within the cluster.
$ curl -k -H "Authorization: Bearer $TOKEN" "https://thanos-querier.openshift-monitoring:9091/api/v1/query?query=up"
Port 9092 provides access to the
/api/v1/query,/api/v1/query_range/,/api/v1/labels,/api/v1/label/*/values, and/api/v1/seriesendpoints restricted to a given project. Granting access requires binding a user to theviewcluster role in the project.- Example view permissions
The following example exercises permissions granted by the
viewcluster role. The binding commands must be run by a user with the necessary privileges.Create a test namespace and a service account.
$ oc create namespace test-thanos-querier-tenancy-view$ oc create serviceaccount thanos-client --namespace=test-thanos-querier-tenancy-viewBind the role to the service account. The binding in this example is applied to a service account but can also be applied to any user.
$ oc create rolebinding test-thanos-querier-tenancy-view \
  --namespace=test-thanos-querier-tenancy-view \
  --clusterrole=view \
  --serviceaccount=test-thanos-querier-tenancy-view:thanos-client
Generate a token to access the endpoints.
$ TOKEN=$(oc create token thanos-client --namespace=test-thanos-querier-tenancy-view)Access Thanos Querier endpoints from within the cluster. The port is not exposed externally by default.
$ curl -k -f -H "Authorization: Bearer $TOKEN" "https://thanos-querier.openshift-monitoring:9092/api/v1/query?query=up&namespace=test-thanos-querier-tenancy-view"
Port 9093 provides access to the
/api/v1/alerts, and/api/v1/rulesendpoints restricted to a given project. Granting access requires binding a user to themonitoring-rules-edit,monitoring-edit, ormonitoring-rules-viewcluster role in the project.- Example monitoring-rules-edit permissions
The following example exercises permissions granted by the
monitoring-rules-editcluster role. The binding commands must be run by a user with the necessary privileges.Create a test namespace and a service account.
$ oc create namespace test-thanos-querier-tenancy-rules-monitoring-rules-edit$ oc create serviceaccount thanos-client --namespace=test-thanos-querier-tenancy-rules-monitoring-rules-editBind the role to the service account. The binding in this example is applied to a service account but can also be applied to any user.
$ oc create rolebinding test-thanos-querier-tenancy-rules-monitoring-rules-edit \
  --namespace=test-thanos-querier-tenancy-rules-monitoring-rules-edit \
  --clusterrole=monitoring-rules-edit \
  --serviceaccount=test-thanos-querier-tenancy-rules-monitoring-rules-edit:thanos-client
Generate a token to access the endpoints.
$ TOKEN=$(oc create token thanos-client --namespace=test-thanos-querier-tenancy-rules-monitoring-rules-edit)Access Thanos Querier endpoints from within the cluster. The port is not exposed externally by default.
$ curl -k -f -H "Authorization: Bearer $TOKEN" "https://thanos-querier.openshift-monitoring:9093/api/v1/rules?namespace=test-thanos-querier-tenancy-rules-monitoring-rules-edit"$ curl -k -f -H "Authorization: Bearer $TOKEN" "https://thanos-querier.openshift-monitoring:9093/api/v1/alerts?namespace=test-thanos-querier-tenancy-rules-monitoring-rules-edit"
- Example monitoring-edit permissions
The following example exercises permissions granted by the
monitoring-editcluster role. The binding commands must be run by a user with the necessary privileges.Create a test namespace and a service account.
$ oc create namespace test-thanos-querier-tenancy-rules-monitoring-edit$ oc create serviceaccount thanos-client --namespace=test-thanos-querier-tenancy-rules-monitoring-editBind the role to the service account. The binding in this example is applied to a service account but can also be applied to any user.
$ oc create rolebinding test-thanos-querier-tenancy-rules-monitoring-edit \
  --namespace=test-thanos-querier-tenancy-rules-monitoring-edit \
  --clusterrole=monitoring-edit \
  --serviceaccount=test-thanos-querier-tenancy-rules-monitoring-edit:thanos-client
Generate a token to access the endpoints.
$ TOKEN=$(oc create token thanos-client --namespace=test-thanos-querier-tenancy-rules-monitoring-edit)Access Thanos Querier endpoints from within the cluster. The port is not exposed externally by default.
$ curl -k -f -H "Authorization: Bearer $TOKEN" "https://thanos-querier.openshift-monitoring:9093/api/v1/rules?namespace=test-thanos-querier-tenancy-rules-monitoring-edit"$ curl -k -f -H "Authorization: Bearer $TOKEN" "https://thanos-querier.openshift-monitoring:9093/api/v1/alerts?namespace=test-thanos-querier-tenancy-rules-monitoring-edit"
- Example monitoring-rules-view permissions
The following example exercises permissions granted by the
monitoring-rules-viewcluster role. The binding commands must be run by a user with the necessary privileges.Create a test namespace and a service account.
$ oc create namespace test-thanos-querier-tenancy-rules-monitoring-rules-view$ oc create serviceaccount thanos-client --namespace=test-thanos-querier-tenancy-rules-monitoring-rules-viewBind the role to the service account. The binding in this example is applied to a service account but can also be applied to any user.
$ oc create rolebinding test-thanos-querier-tenancy-rules-monitoring-rules-view \
  --namespace=test-thanos-querier-tenancy-rules-monitoring-rules-view \
  --clusterrole=monitoring-rules-view \
  --serviceaccount=test-thanos-querier-tenancy-rules-monitoring-rules-view:thanos-client
Generate a token to access the endpoints.
$ TOKEN=$(oc create token thanos-client --namespace=test-thanos-querier-tenancy-rules-monitoring-rules-view)Access Thanos Querier endpoints from within the cluster. The port is not exposed externally by default.
$ curl -k -f -H "Authorization: Bearer $TOKEN" "https://thanos-querier.openshift-monitoring:9093/api/v1/rules?namespace=test-thanos-querier-tenancy-rules-monitoring-rules-view"$ curl -k -f -H "Authorization: Bearer $TOKEN" "https://thanos-querier.openshift-monitoring:9093/api/v1/alerts?namespace=test-thanos-querier-tenancy-rules-monitoring-rules-view"
-
Port 9094 provides access to the
/metricsendpoint only. This port is for internal use, and no other usage is guaranteed.
5.3.5.2.15. openshift-user-workload-monitoring/thanos-ruler
Expose the Thanos Ruler web server within the cluster on the following ports:
-
Port 9091 provides access to all Thanos Ruler endpoints. Granting access requires binding a user to the
cluster-monitoring-viewcluster role. -
Port 9092 provides access to the
/metricsendpoint only. This port is for internal use, and no other usage is guaranteed.
This also exposes the gRPC endpoints on port 10901. This port is for internal use, and no other usage is guaranteed.
5.3.5.2.16. openshift-monitoring/cluster-monitoring-operator
Expose the /metrics and /validate-webhook endpoints on port 8443. This port is for internal use, and no other usage is guaranteed.
Chapter 6. Managing alerts
6.1. Managing alerts as an Administrator
In Red Hat OpenShift Service on AWS, the Alerting UI enables you to manage alerts, silences, and alerting rules.
Starting with Red Hat OpenShift Service on AWS 4.19, the perspectives in the web console have unified. The Developer perspective is no longer enabled by default.
All users can interact with all Red Hat OpenShift Service on AWS web console features. However, if you are not the cluster owner, you might need to request permission to access certain features from the cluster owner.
You can still enable the Developer perspective. On the Getting Started pane in the web console, you can take a tour of the console, find information on setting up your cluster, view a quick start for enabling the Developer perspective, and follow links to explore new features and capabilities.
The alerts, silences, and alerting rules that are available in the Alerting UI relate to the projects that you have access to. For example, if you are logged in as an administrator, you can access all alerts, silences, and alerting rules.
6.1.1. Accessing the Alerting UI
The Alerting UI is accessible in the Red Hat OpenShift Service on AWS web console.
- In the Red Hat OpenShift Service on AWS web console, go to Observe → Alerting. The three main pages in the Alerting UI in this perspective are the Alerts, Silences, and Alerting rules pages.
6.1.2. Getting information about alerts, silences, and alerting rules
The Alerting UI provides detailed information about alerts and their governing alerting rules and silences.
Prerequisites
- You have access to the cluster as a user with view permissions for the project that you are viewing alerts for.
Procedure
To obtain information about alerts:
- In the Red Hat OpenShift Service on AWS web console, go to the Observe → Alerting → Alerts page.
- Optional: Search for alerts by name by using the Name field in the search list.
- Optional: Filter alerts by state, severity, and source by selecting filters in the Filter list.
- Optional: Sort the alerts by clicking one or more of the Name, Severity, State, and Source column headers.
Click the name of an alert to view its Alert details page. The page includes a graph that illustrates alert time series data. It also provides the following information about the alert:
- A description of the alert
- Messages associated with the alert
- A link to the runbook page on GitHub for the alert, if the page exists
- Labels attached to the alert
- A link to its governing alerting rule
- Silences for the alert, if any exist
To obtain information about silences:
- In the Red Hat OpenShift Service on AWS web console, go to the Observe → Alerting → Silences page.
- Optional: Filter the silences by name using the Search by name field.
- Optional: Filter silences by state by selecting filters in the Filter list. By default, Active and Pending filters are applied.
- Optional: Sort the silences by clicking one or more of the Name, Firing alerts, State, and Creator column headers.
Select the name of a silence to view its Silence details page. The page includes the following details:
- Alert specification
- Start time
- End time
- Silence state
- Number and list of firing alerts
To obtain information about alerting rules:
- In the Red Hat OpenShift Service on AWS web console, go to the Observe → Alerting → Alerting rules page.
- Optional: Filter alerting rules by state, severity, and source by selecting filters in the Filter list.
- Optional: Sort the alerting rules by clicking one or more of the Name, Severity, Alert state, and Source column headers.
Select the name of an alerting rule to view its Alerting rule details page. The page provides the following details about the alerting rule:
- Alerting rule name, severity, and description.
- The expression that defines the condition for firing the alert.
- The time for which the condition should be true for an alert to fire.
- A graph for each alert governed by the alerting rule, showing the value with which the alert is firing.
- A table of all alerts governed by the alerting rule.
6.1.3. Managing silences
You can create a silence for an alert in the Red Hat OpenShift Service on AWS web console. After you create silences, you can view, edit, and expire them. You also do not receive notifications about a silenced alert when the alert fires.
When you create silences, they are replicated across Alertmanager pods. However, if you do not configure persistent storage for Alertmanager, silences might be lost. This can happen, for example, if all Alertmanager pods restart at the same time.
6.1.3.1. Silencing alerts
You can silence a specific alert or silence alerts that match a specification that you define.
Prerequisites
-
If you are a cluster administrator, you have access to the cluster as a user with the
cluster-adminrole. If you are a non-administrator user, you have access to the cluster as a user with the following user roles:
-
The
cluster-monitoring-viewcluster role, which allows you to access Alertmanager. -
The
monitoring-alertmanager-editrole, which permits you to create and silence alerts.
-
The
Procedure
To silence a specific alert:
- In the Red Hat OpenShift Service on AWS web console, go to Observe → Alerting → Alerts.
-
For the alert that you want to silence, click
and select Silence alert to open the Silence alert page with a default configuration for the chosen alert.
Optional: Change the default configuration details for the silence.
NoteYou must add a comment before saving a silence.
- To save the silence, click Silence.
To silence a set of alerts:
- In the Red Hat OpenShift Service on AWS web console, go to Observe → Alerting → Silences.
- Click Create silence.
On the Create silence page, set the schedule, duration, and label details for an alert.
NoteYou must add a comment before saving a silence.
- To create silences for alerts that match the labels that you entered, click Silence.
6.1.3.2. Editing silences
You can edit a silence, which expires the existing silence and creates a new one with the changed configuration.
Prerequisites
-
If you are a cluster administrator, you have access to the cluster as a user with the
cluster-adminrole. If you are a non-administrator user, you have access to the cluster as a user with the following user roles:
-
The
cluster-monitoring-viewcluster role, which allows you to access Alertmanager. -
The
monitoring-alertmanager-editrole, which permits you to create and silence alerts.
-
The
Procedure
- In the Red Hat OpenShift Service on AWS web console, go to Observe → Alerting → Silences.
For the silence you want to modify, click
and select Edit silence.
Alternatively, you can click Actions and select Edit silence on the Silence details page for a silence.
- On the Edit silence page, make changes and click Silence. Doing so expires the existing silence and creates one with the updated configuration.
6.1.3.3. Expiring silences
You can expire a single silence or multiple silences. Expiring a silence deactivates it permanently.
You cannot delete expired, silenced alerts. Expired silences older than 120 hours are garbage collected.
Prerequisites
-
If you are a cluster administrator, you have access to the cluster as a user with the
cluster-adminrole. If you are a non-administrator user, you have access to the cluster as a user with the following user roles:
-
The
cluster-monitoring-viewcluster role, which allows you to access Alertmanager. -
The
monitoring-alertmanager-editrole, which permits you to create and silence alerts.
-
The
Procedure
- Go to Observe → Alerting → Silences.
- For the silence or silences you want to expire, select the checkbox in the corresponding row.
Click Expire 1 silence to expire a single selected silence or Expire <n> silences to expire multiple selected silences, where <n> is the number of silences you selected.
Alternatively, to expire a single silence you can click Actions and select Expire silence on the Silence details page for a silence.
6.1.4. Managing alerting rules for core platform monitoring
The Red Hat OpenShift Service on AWS monitoring includes a large set of default alerting rules for platform metrics. As a cluster administrator, you can customize this set of rules in two ways:
-
Modify the settings for existing platform alerting rules by adjusting thresholds or by adding and modifying labels. For example, you can change the
severitylabel for an alert fromwarningtocriticalto help you route and triage issues flagged by an alert. -
Define and add new custom alerting rules by constructing a query expression based on core platform metrics in the
openshift-monitoringproject.
6.1.4.1. Creating new alerting rules
As a cluster administrator, you can create new alerting rules based on platform metrics. These alerting rules trigger alerts based on the values of chosen metrics.
-
If you create a customized
AlertingRuleresource based on an existing platform alerting rule, silence the original alert to avoid receiving conflicting alerts. - To help users understand the impact and cause of the alert, ensure that your alerting rule contains an alert message and severity value.
Prerequisites
-
You have access to the cluster as a user that has the
cluster-admincluster role. -
You have installed the OpenShift CLI (
oc).
Procedure
-
Create a new YAML configuration file named
example-alerting-rule.yaml. Add an
AlertingRuleresource to the YAML file. The following example creates a new alerting rule namedexample, similar to the defaultWatchdogalert:apiVersion: monitoring.openshift.io/v1 kind: AlertingRule metadata: name: example namespace: openshift-monitoring1 spec: groups: - name: example-rules rules: - alert: ExampleAlert2 for: 1m3 expr: vector(1)4 labels: severity: warning5 annotations: message: This is an example alert.6 - 1
- Ensure that the namespace is
openshift-monitoring. - 2
- The name of the alerting rule you want to create.
- 3
- The duration for which the condition should be true before an alert is fired.
- 4
- The PromQL query expression that defines the new rule.
- 5
- The severity that alerting rule assigns to the alert.
- 6
- The message associated with the alert.
ImportantYou must create the
AlertingRuleobject in theopenshift-monitoringnamespace. Otherwise, the alerting rule is not accepted.Apply the configuration file to the cluster:
$ oc apply -f example-alerting-rule.yaml
6.1.4.2. Modifying core platform alerting rules
As a cluster administrator, you can modify core platform alerts before Alertmanager routes them to a receiver. For example, you can change the severity label of an alert, add a custom label, or exclude an alert from being sent to Alertmanager.
Prerequisites
-
You have access to the cluster as a user with the
cluster-admincluster role. -
You have installed the OpenShift CLI (
oc).
Procedure
-
Create a new YAML configuration file named
example-modified-alerting-rule.yaml. Add an
AlertRelabelConfigresource to the YAML file. The following example modifies theseveritysetting tocriticalfor the default platformwatchdogalerting rule:apiVersion: monitoring.openshift.io/v1 kind: AlertRelabelConfig metadata: name: watchdog namespace: openshift-monitoring1 spec: configs: - sourceLabels: [alertname,severity]2 regex: "Watchdog;none"3 targetLabel: severity4 replacement: critical5 action: Replace6 - 1
- Ensure that the namespace is
openshift-monitoring. - 2
- The source labels for the values you want to modify.
- 3
- The regular expression against which the value of
sourceLabelsis matched. - 4
- The target label of the value you want to modify.
- 5
- The new value to replace the target label.
- 6
- The relabel action that replaces the old value based on regex matching. The default action is
Replace. Other possible values areKeep,Drop,HashMod,LabelMap,LabelDrop, andLabelKeep.
ImportantYou must create the
AlertRelabelConfigobject in theopenshift-monitoringnamespace. Otherwise, the alert label will not change.Apply the configuration file to the cluster:
$ oc apply -f example-modified-alerting-rule.yaml
6.1.5. Managing alerting rules for user-defined projects
In Red Hat OpenShift Service on AWS, you can create, view, edit, and remove alerting rules for user-defined projects. Those alerting rules will trigger alerts based on the values of the chosen metrics.
6.1.5.1. Creating alerting rules for user-defined projects
You can create alerting rules for user-defined projects. Those alerting rules will trigger alerts based on the values of the chosen metrics.
To help users understand the impact and cause of the alert, ensure that your alerting rule contains an alert message and severity value.
Prerequisites
- You have enabled monitoring for user-defined projects.
-
You are logged in as a cluster administrator or as a user that has the
monitoring-rules-editcluster role for the project where you want to create an alerting rule. -
You have installed the OpenShift CLI (
oc).
Procedure
-
Create a YAML file for alerting rules. In this example, it is called
example-app-alerting-rule.yaml. Add an alerting rule configuration to the YAML file. The following example creates a new alerting rule named
example-alert. The alerting rule fires an alert when theversionmetric exposed by the sample service becomes0:apiVersion: monitoring.coreos.com/v1 kind: PrometheusRule metadata: name: example-alert namespace: ns1 spec: groups: - name: example rules: - alert: VersionAlert1 for: 1m2 expr: version{job="prometheus-example-app"} == 03 labels: severity: warning4 annotations: message: This is an example alert.5 Apply the configuration file to the cluster:
$ oc apply -f example-app-alerting-rule.yaml
6.1.5.2. Creating cross-project alerting rules for user-defined projects
You can create alerting rules that are not bound to their project of origin by configuring a project in the user-workload-monitoring-config config map. The PrometheusRule objects created in these projects are then applicable to all projects.
Therefore, you can have generic alerting rules that apply to multiple user-defined projects instead of having individual PrometheusRule objects in each user project. You can filter which projects are included or excluded from the alerting rule by using PromQL queries in the PrometheusRule object.
Prerequisites
-
If you are a cluster administrator, you have access to the cluster as a user with the
cluster-admincluster role. If you are a non-administrator user, you have access to the cluster as a user with the following user roles:
-
The
user-workload-monitoring-config-editrole in theopenshift-user-workload-monitoringproject to edit theuser-workload-monitoring-configconfig map. -
The
monitoring-rules-editcluster role for the project where you want to create an alerting rule.
-
The
- A cluster administrator has enabled monitoring for user-defined projects.
-
You have installed the OpenShift CLI (
oc).
Procedure
Edit the
user-workload-monitoring-configconfig map in theopenshift-user-workload-monitoringproject:$ oc -n openshift-user-workload-monitoring edit configmap user-workload-monitoring-configConfigure projects in which you want to create alerting rules that are not bound to a specific project:
apiVersion: v1
kind: ConfigMap
metadata:
  name: user-workload-monitoring-config
  namespace: openshift-user-workload-monitoring
data:
  config.yaml: |
    namespacesWithoutLabelEnforcement: [ <namespace1>, <namespace2> ]
1 # ...- 1
- Specify one or more projects in which you want to create cross-project alerting rules. Prometheus and Thanos Ruler for user-defined monitoring do not enforce the
namespacelabel inPrometheusRuleobjects created in these projects, making thePrometheusRuleobjects applicable to all projects.
-
Create a YAML file for alerting rules. In this example, it is called
example-cross-project-alerting-rule.yaml. Add an alerting rule configuration to the YAML file. The following example creates a new cross-project alerting rule called
example-security. The alerting rule fires when a user project does not enforce the restricted pod security policy:Example cross-project alerting rule
apiVersion: monitoring.coreos.com/v1
kind: PrometheusRule
metadata:
  name: example-security
  namespace: ns1
1 spec: groups: - name: pod-security-policy rules: - alert: "ProjectNotEnforcingRestrictedPolicy"2 for: 5m3 expr: kube_namespace_labels{namespace!~"(openshift|kube).*|default",label_pod_security_kubernetes_io_enforce!="restricted"}4 annotations: message: "Restricted policy not enforced. Project {{ $labels.namespace }} does not enforce the restricted pod security policy."5 labels: severity: warning6 - 1
- Ensure that you specify the project that you defined in the
namespacesWithoutLabelEnforcementfield. - 2
- The name of the alerting rule you want to create.
- 3
- The duration for which the condition should be true before an alert is fired.
- 4
- The PromQL query expression that defines the new rule. You can use label matchers on the
namespacelabel to filter which projects are included or excluded from the alerting rule. - 5
- The message associated with the alert.
- 6
- The severity that alerting rule assigns to the alert.
ImportantEnsure that you create a specific cross-project alerting rule in only one of the projects that you specified in the
namespacesWithoutLabelEnforcementfield. If you create the same cross-project alerting rule in multiple projects, it results in repeated alerts.Apply the configuration file to the cluster:
$ oc apply -f example-cross-project-alerting-rule.yaml
6.1.5.3. Listing alerting rules for all projects in a single view
As a cluster administrator, you can list alerting rules for core Red Hat OpenShift Service on AWS and user-defined projects together in a single view.
Prerequisites
-
You have access to the cluster as a user with the
cluster-adminrole. -
You have installed the OpenShift CLI (
oc).
Procedure
- In the Red Hat OpenShift Service on AWS web console, go to Observe → Alerting → Alerting rules.
Select the Platform and User sources in the Filter drop-down menu.
NoteThe Platform source is selected by default.
6.1.5.4. Removing alerting rules for user-defined projects
You can remove alerting rules for user-defined projects.
Prerequisites
- You have enabled monitoring for user-defined projects.
-
You are logged in as a cluster administrator or as a user that has the
monitoring-rules-editcluster role for the project where you want to create an alerting rule. -
You have installed the OpenShift CLI (
oc).
Procedure
To remove rule
<alerting_rule>in<namespace>, run the following:$ oc -n <namespace> delete prometheusrule <alerting_rule>
6.1.5.5. Disabling cross-project alerting rules for user-defined projects
Creating cross-project alerting rules for user-defined projects is enabled by default. Cluster administrators can disable the capability in the cluster-monitoring-config config map for the following reasons:
- To prevent user-defined monitoring from overloading the cluster monitoring stack.
- To prevent buggy alerting rules from being applied to the cluster without having to identify the rule that causes the issue.
Prerequisites
-
You have access to the cluster as a user with the
cluster-admincluster role. -
You have installed the OpenShift CLI (
oc).
Procedure
Edit the
cluster-monitoring-configconfig map in theopenshift-monitoringproject:$ oc -n openshift-monitoring edit configmap cluster-monitoring-configIn the
cluster-monitoring-configconfig map, disable the option to create cross-project alerting rules by setting therulesWithoutLabelEnforcementAllowedvalue underdata/config.yaml/userWorkloadtofalse:kind: ConfigMap apiVersion: v1 metadata: name: cluster-monitoring-config namespace: openshift-monitoring data: config.yaml: | userWorkload: rulesWithoutLabelEnforcementAllowed: false # ...- Save the file to apply the changes.
6.2. Managing alerts as a Developer
In Red Hat OpenShift Service on AWS, the Alerting UI enables you to manage alerts, silences, and alerting rules.
Starting with Red Hat OpenShift Service on AWS 4.19, the perspectives in the web console have unified. The Developer perspective is no longer enabled by default.
All users can interact with all Red Hat OpenShift Service on AWS web console features. However, if you are not the cluster owner, you might need to request permission to access certain features from the cluster owner.
You can still enable the Developer perspective. On the Getting Started pane in the web console, you can take a tour of the console, find information on setting up your cluster, view a quick start for enabling the Developer perspective, and follow links to explore new features and capabilities.
The alerts, silences, and alerting rules that are available in the Alerting UI relate to the projects that you have access to.
6.2.1. Accessing the Alerting UI
The Alerting UI is accessible in the Red Hat OpenShift Service on AWS web console.
- In the Red Hat OpenShift Service on AWS web console, go to Observe → Alerting. The three main pages in the Alerting UI in this perspective are the Alerts, Silences, and Alerting rules pages.
6.2.2. Getting information about alerts, silences, and alerting rules
The Alerting UI provides detailed information about alerts and their governing alerting rules and silences.
Prerequisites
- You have access to the cluster as a user with view permissions for the project that you are viewing alerts for.
Procedure
To obtain information about alerts:
- In the Red Hat OpenShift Service on AWS web console, go to the Observe → Alerting → Alerts page.
- Optional: Search for alerts by name by using the Name field in the search list.
- Optional: Filter alerts by state, severity, and source by selecting filters in the Filter list.
- Optional: Sort the alerts by clicking one or more of the Name, Severity, State, and Source column headers.
Click the name of an alert to view its Alert details page. The page includes a graph that illustrates alert time series data. It also provides the following information about the alert:
- A description of the alert
- Messages associated with the alert
- A link to the runbook page on GitHub for the alert, if the page exists
- Labels attached to the alert
- A link to its governing alerting rule
- Silences for the alert, if any exist
To obtain information about silences:
- In the Red Hat OpenShift Service on AWS web console, go to the Observe → Alerting → Silences page.
- Optional: Filter the silences by name using the Search by name field.
- Optional: Filter silences by state by selecting filters in the Filter list. By default, Active and Pending filters are applied.
- Optional: Sort the silences by clicking one or more of the Name, Firing alerts, State, and Creator column headers.
Select the name of a silence to view its Silence details page. The page includes the following details:
- Alert specification
- Start time
- End time
- Silence state
- Number and list of firing alerts
To obtain information about alerting rules:
- In the Red Hat OpenShift Service on AWS web console, go to the Observe → Alerting → Alerting rules page.
- Optional: Filter alerting rules by state, severity, and source by selecting filters in the Filter list.
- Optional: Sort the alerting rules by clicking one or more of the Name, Severity, Alert state, and Source column headers.
Select the name of an alerting rule to view its Alerting rule details page. The page provides the following details about the alerting rule:
- Alerting rule name, severity, and description.
- The expression that defines the condition for firing the alert.
- The time for which the condition should be true for an alert to fire.
- A graph for each alert governed by the alerting rule, showing the value with which the alert is firing.
- A table of all alerts governed by the alerting rule.
6.2.3. Managing silences
You can create a silence for an alert in the Red Hat OpenShift Service on AWS web console. After you create silences, you can view, edit, and expire them. You also do not receive notifications about a silenced alert when the alert fires.
When you create silences, they are replicated across Alertmanager pods. However, if you do not configure persistent storage for Alertmanager, silences might be lost. This can happen, for example, if all Alertmanager pods restart at the same time.
6.2.3.1. Silencing alerts
You can silence a specific alert or silence alerts that match a specification that you define.
Prerequisites
-
If you are a cluster administrator, you have access to the cluster as a user with the
cluster-adminrole. If you are a non-administrator user, you have access to the cluster as a user with the following user roles:
-
The
cluster-monitoring-viewcluster role, which allows you to access Alertmanager. -
The
monitoring-alertmanager-editrole, which permits you to create and silence alerts.
-
The
Procedure
To silence a specific alert:
- In the Red Hat OpenShift Service on AWS web console, go to Observe → Alerting → Alerts.
-
For the alert that you want to silence, click
and select Silence alert to open the Silence alert page with a default configuration for the chosen alert.
Optional: Change the default configuration details for the silence.
NoteYou must add a comment before saving a silence.
- To save the silence, click Silence.
To silence a set of alerts:
- In the Red Hat OpenShift Service on AWS web console, go to Observe → Alerting → Silences.
- Click Create silence.
On the Create silence page, set the schedule, duration, and label details for an alert.
NoteYou must add a comment before saving a silence.
- To create silences for alerts that match the labels that you entered, click Silence.
6.2.3.2. Editing silences
You can edit a silence, which expires the existing silence and creates a new one with the changed configuration.
Prerequisites
-
If you are a cluster administrator, you have access to the cluster as a user with the
cluster-adminrole. If you are a non-administrator user, you have access to the cluster as a user with the following user roles:
-
The
cluster-monitoring-viewcluster role, which allows you to access Alertmanager. -
The
monitoring-alertmanager-editrole, which permits you to create and silence alerts.
-
The
Procedure
- In the Red Hat OpenShift Service on AWS web console, go to Observe → Alerting → Silences.
For the silence you want to modify, click
and select Edit silence.
Alternatively, you can click Actions and select Edit silence on the Silence details page for a silence.
- On the Edit silence page, make changes and click Silence. Doing so expires the existing silence and creates one with the updated configuration.
6.2.3.3. Expiring silences
You can expire a single silence or multiple silences. Expiring a silence deactivates it permanently.
You cannot delete expired, silenced alerts. Expired silences older than 120 hours are garbage collected.
Prerequisites
-
If you are a cluster administrator, you have access to the cluster as a user with the
cluster-adminrole. If you are a non-administrator user, you have access to the cluster as a user with the following user roles:
-
The
cluster-monitoring-viewcluster role, which allows you to access Alertmanager. -
The
monitoring-alertmanager-editrole, which permits you to create and silence alerts.
-
The
Procedure
- Go to Observe → Alerting → Silences.
- For the silence or silences you want to expire, select the checkbox in the corresponding row.
Click Expire 1 silence to expire a single selected silence or Expire <n> silences to expire multiple selected silences, where <n> is the number of silences you selected.
Alternatively, to expire a single silence you can click Actions and select Expire silence on the Silence details page for a silence.
6.2.4. Managing alerting rules for user-defined projects
In Red Hat OpenShift Service on AWS, you can create, view, edit, and remove alerting rules for user-defined projects. Those alerting rules will trigger alerts based on the values of the chosen metrics.
6.2.4.1. Creating alerting rules for user-defined projects
You can create alerting rules for user-defined projects. Those alerting rules will trigger alerts based on the values of the chosen metrics.
To help users understand the impact and cause of the alert, ensure that your alerting rule contains an alert message and severity value.
Prerequisites
- You have enabled monitoring for user-defined projects.
-
You are logged in as a cluster administrator or as a user that has the
monitoring-rules-editcluster role for the project where you want to create an alerting rule. -
You have installed the OpenShift CLI (
oc).
Procedure
-
Create a YAML file for alerting rules. In this example, it is called
example-app-alerting-rule.yaml. Add an alerting rule configuration to the YAML file. The following example creates a new alerting rule named
example-alert. The alerting rule fires an alert when theversionmetric exposed by the sample service becomes0:apiVersion: monitoring.coreos.com/v1 kind: PrometheusRule metadata: name: example-alert namespace: ns1 spec: groups: - name: example rules: - alert: VersionAlert1 for: 1m2 expr: version{job="prometheus-example-app"} == 03 labels: severity: warning4 annotations: message: This is an example alert.5 Apply the configuration file to the cluster:
$ oc apply -f example-app-alerting-rule.yaml
6.2.4.2. Creating cross-project alerting rules for user-defined projects
You can create alerting rules that are not bound to their project of origin by configuring a project in the user-workload-monitoring-config config map. The PrometheusRule objects created in these projects are then applicable to all projects.
Therefore, you can have generic alerting rules that apply to multiple user-defined projects instead of having individual PrometheusRule objects in each user project. You can filter which projects are included or excluded from the alerting rule by using PromQL queries in the PrometheusRule object.
Prerequisites
-
If you are a cluster administrator, you have access to the cluster as a user with the
cluster-admincluster role. If you are a non-administrator user, you have access to the cluster as a user with the following user roles:
-
The
user-workload-monitoring-config-editrole in theopenshift-user-workload-monitoringproject to edit theuser-workload-monitoring-configconfig map. -
The
monitoring-rules-editcluster role for the project where you want to create an alerting rule.
-
The
- A cluster administrator has enabled monitoring for user-defined projects.
-
You have installed the OpenShift CLI (
oc).
Procedure
Edit the
user-workload-monitoring-configconfig map in theopenshift-user-workload-monitoringproject:$ oc -n openshift-user-workload-monitoring edit configmap user-workload-monitoring-configConfigure projects in which you want to create alerting rules that are not bound to a specific project:
apiVersion: v1 kind: ConfigMap metadata: name: user-workload-monitoring-config namespace: openshift-user-workload-monitoring data: config.yaml: | namespacesWithoutLabelEnforcement: [ <namespace1>, <namespace2> ]1 # ...- 1
- Specify one or more projects in which you want to create cross-project alerting rules. Prometheus and Thanos Ruler for user-defined monitoring do not enforce the
namespacelabel inPrometheusRuleobjects created in these projects, making thePrometheusRuleobjects applicable to all projects.
-
Create a YAML file for alerting rules. In this example, it is called
example-cross-project-alerting-rule.yaml. Add an alerting rule configuration to the YAML file. The following example creates a new cross-project alerting rule called
example-security. The alerting rule fires when a user project does not enforce the restricted pod security policy:Example cross-project alerting rule
apiVersion: monitoring.coreos.com/v1 kind: PrometheusRule metadata: name: example-security namespace: ns11 spec: groups: - name: pod-security-policy rules: - alert: "ProjectNotEnforcingRestrictedPolicy"2 for: 5m3 expr: kube_namespace_labels{namespace!~"(openshift|kube).*|default",label_pod_security_kubernetes_io_enforce!="restricted"}4 annotations: message: "Restricted policy not enforced. Project {{ $labels.namespace }} does not enforce the restricted pod security policy."5 labels: severity: warning6 - 1
- Ensure that you specify the project that you defined in the
namespacesWithoutLabelEnforcementfield. - 2
- The name of the alerting rule you want to create.
- 3
- The duration for which the condition should be true before an alert is fired.
- 4
- The PromQL query expression that defines the new rule. You can use label matchers on the
namespacelabel to filter which projects are included or excluded from the alerting rule. - 5
- The message associated with the alert.
- 6
- The severity that alerting rule assigns to the alert.
ImportantEnsure that you create a specific cross-project alerting rule in only one of the projects that you specified in the
namespacesWithoutLabelEnforcementfield. If you create the same cross-project alerting rule in multiple projects, it results in repeated alerts.Apply the configuration file to the cluster:
$ oc apply -f example-cross-project-alerting-rule.yaml
6.2.4.3. Accessing alerting rules for user-defined projects
To list alerting rules for a user-defined project, you must have been assigned the monitoring-rules-view cluster role for the project.
Prerequisites
- You have enabled monitoring for user-defined projects.
-
You are logged in as a user that has the
monitoring-rules-viewcluster role for your project. -
You have installed the OpenShift CLI (
oc).
Procedure
To list alerting rules in
<project>:$ oc -n <project> get prometheusruleTo list the configuration of an alerting rule, run the following:
$ oc -n <project> get prometheusrule <rule> -o yaml
6.2.4.4. Removing alerting rules for user-defined projects
You can remove alerting rules for user-defined projects.
Prerequisites
- You have enabled monitoring for user-defined projects.
-
You are logged in as a cluster administrator or as a user that has the
monitoring-rules-editcluster role for the project where you want to create an alerting rule. -
You have installed the OpenShift CLI (
oc).
Procedure
To remove rule
<alerting_rule>in<namespace>, run the following:$ oc -n <namespace> delete prometheusrule <alerting_rule>
Chapter 7. Troubleshooting monitoring issues
Find troubleshooting steps for common issues with core platform and user-defined project monitoring.
7.2. Determining why Prometheus is consuming a lot of disk space
Developers can create labels to define attributes for metrics in the form of key-value pairs. The number of potential key-value pairs corresponds to the number of possible values for an attribute. An attribute that has an unlimited number of potential values is called an unbound attribute. For example, a customer_id attribute is unbound because it has an infinite number of possible values.
Every assigned key-value pair has a unique time series. The use of many unbound attributes in labels can result in an exponential increase in the number of time series created. This can impact Prometheus performance and can consume a lot of disk space.
You can use the following measures when Prometheus consumes a lot of disk:
- Check the time series database (TSDB) status using the Prometheus HTTP API for more information about which labels are creating the most time series data. Doing so requires cluster administrator privileges.
- Check the number of scrape samples that are being collected.
Reduce the number of unique time series that are created by reducing the number of unbound attributes that are assigned to user-defined metrics.
NoteUsing attributes that are bound to a limited set of possible values reduces the number of potential key-value pair combinations.
- Enforce limits on the number of samples that can be scraped across user-defined projects. This requires cluster administrator privileges.
Prerequisites
-
You have access to the cluster as a user with the
cluster-admincluster role. -
You have installed the OpenShift CLI (
oc).
Procedure
- In the Red Hat OpenShift Service on AWS web console, go to Observe → Metrics.
Enter a Prometheus Query Language (PromQL) query in the Expression field. The following example queries help to identify high cardinality metrics that might result in high disk space consumption:
By running the following query, you can identify the ten jobs that have the highest number of scrape samples:
topk(10, max by(namespace, job) (topk by(namespace, job) (1, scrape_samples_post_metric_relabeling)))By running the following query, you can pinpoint time series churn by identifying the ten jobs that have created the most time series data in the last hour:
topk(10, sum by(namespace, job) (sum_over_time(scrape_series_added[1h])))
Investigate the number of unbound label values assigned to metrics with higher than expected scrape sample counts:
- If the metrics relate to a user-defined project, review the metrics key-value pairs assigned to your workload. These are implemented through Prometheus client libraries at the application level. Try to limit the number of unbound attributes referenced in your labels.
- If the metrics relate to a core Red Hat OpenShift Service on AWS project, create a Red Hat support case on the Red Hat Customer Portal.
Review the TSDB status using the Prometheus HTTP API by following these steps when logged in as a cluster administrator:
Get the Prometheus API route URL by running the following command:
$ HOST=$(oc -n openshift-monitoring get route prometheus-k8s -ojsonpath='{.status.ingress[].host}')Extract an authentication token by running the following command:
$ TOKEN=$(oc whoami -t)Query the TSDB status for Prometheus by running the following command:
$ curl -H "Authorization: Bearer $TOKEN" -k "https://$HOST/api/v1/status/tsdb"Example output
"status": "success","data":{"headStats":{"numSeries":507473, "numLabelPairs":19832,"chunkCount":946298,"minTime":1712253600010, "maxTime":1712257935346},"seriesCountByMetricName": [{"name":"etcd_request_duration_seconds_bucket","value":51840}, {"name":"apiserver_request_sli_duration_seconds_bucket","value":47718}, ...
7.3. Resolving the KubePersistentVolumeFillingUp alert firing for Prometheus
As a cluster administrator, you can resolve the KubePersistentVolumeFillingUp alert being triggered for Prometheus.
The critical alert fires when a persistent volume (PV) claimed by a prometheus-k8s-* pod in the openshift-monitoring project has less than 3% total space remaining. This can cause Prometheus to function abnormally.
There are two KubePersistentVolumeFillingUp alerts:
-
Critical alert: The alert with the
severity="critical"label is triggered when the mounted PV has less than 3% total space remaining. -
Warning alert: The alert with the
severity="warning"label is triggered when the mounted PV has less than 15% total space remaining and is expected to fill up within four days.
To address this issue, you can remove Prometheus time-series database (TSDB) blocks to create more space for the PV.
Prerequisites
-
You have access to the cluster as a user with the
cluster-admincluster role. -
You have installed the OpenShift CLI (
oc).
Procedure
List the size of all TSDB blocks, sorted from oldest to newest, by running the following command:
$ oc debug <prometheus_k8s_pod_name> -n openshift-monitoring \ -c prometheus --image=$(oc get po -n openshift-monitoring <prometheus_k8s_pod_name> \ -o jsonpath='{.spec.containers[?(@.name=="prometheus")].image}') \ -- sh -c 'cd /prometheus/;du -hs $(ls -dtr */ | grep -Eo "[0-9|A-Z]{26}")'Replace
<prometheus_k8s_pod_name>with the pod mentioned in theKubePersistentVolumeFillingUpalert description.Example output
308M 01HVKMPKQWZYWS8WVDAYQHNMW6 52M 01HVK64DTDA81799TBR9QDECEZ 102M 01HVK64DS7TRZRWF2756KHST5X 140M 01HVJS59K11FBVAPVY57K88Z11 90M 01HVH2A5Z58SKT810EM6B9AT50 152M 01HV8ZDVQMX41MKCN84S32RRZ1 354M 01HV6Q2N26BK63G4RYTST71FBF 156M 01HV664H9J9Z1FTZD73RD1563E 216M 01HTHXB60A7F239HN7S2TENPNS 104M 01HTHMGRXGS0WXA3WATRXHR36BIdentify which and how many blocks could be removed, then remove the blocks. The following example command removes the three oldest Prometheus TSDB blocks from the
prometheus-k8s-0pod:$ oc debug prometheus-k8s-0 -n openshift-monitoring \ -c prometheus --image=$(oc get po -n openshift-monitoring prometheus-k8s-0 \ -o jsonpath='{.spec.containers[?(@.name=="prometheus")].image}') \ -- sh -c 'ls -latr /prometheus/ | egrep -o "[0-9|A-Z]{26}" | head -3 | \ while read BLOCK; do rm -r /prometheus/$BLOCK; done'Verify the usage of the mounted PV and ensure there is enough space available by running the following command:
$ oc debug <prometheus_k8s_pod_name> -n openshift-monitoring \ --image=$(oc get po -n openshift-monitoring <prometheus_k8s_pod_name> \ -o jsonpath='{.spec.containers[?(@.name=="prometheus")].image}') -- df -h /prometheus/Replace
<prometheus_k8s_pod_name>with the pod mentioned in theKubePersistentVolumeFillingUpalert description.The following example output shows the mounted PV claimed by the
prometheus-k8s-0pod that has 63% of space remaining:Example output
Starting pod/prometheus-k8s-0-debug-j82w4 ... Filesystem Size Used Avail Use% Mounted on /dev/nvme0n1p4 40G 15G 40G 37% /prometheus Removing debug pod ...
7.4. Resolving the AlertmanagerReceiversNotConfigured alert
Every cluster that is deployed has the AlertmanagerReceiversNotConfigured alert firing by default. To resolve the issue, you must configure alert receivers.
- For default platform monitoring, follow the steps in "Configuring alert notifications" in Configuring core platform monitoring.
- For user workload monitoring, follow the steps in "Configuring alert notifications" in Configuring user workload monitoring.
Chapter 8. Config map reference for the Cluster Monitoring Operator
8.1. Cluster Monitoring Operator configuration reference
Parts of Red Hat OpenShift Service on AWS cluster monitoring are configurable. The API is accessible by setting parameters defined in various config maps.
-
To configure monitoring components, edit the
ConfigMapobject namedcluster-monitoring-configin theopenshift-monitoringnamespace. These configurations are defined by ClusterMonitoringConfiguration. -
To configure monitoring components that monitor user-defined projects, edit the
ConfigMapobject nameduser-workload-monitoring-configin theopenshift-user-workload-monitoringnamespace. These configurations are defined by UserWorkloadConfiguration.
The configuration file is always defined under the config.yaml key in the config map data.
- Not all configuration parameters for the monitoring stack are exposed. Only the parameters and fields listed in this reference are supported for configuration. For more information about supported configurations, see Maintenance and support for monitoring.
- Configuring cluster monitoring is optional.
- If a configuration does not exist or is empty, default values are used.
-
If the configuration has invalid YAML data, or if it contains unsupported or duplicated fields that bypassed early validation, the Cluster Monitoring Operator stops reconciling the resources and reports the
Degraded=Truestatus in the status conditions of the Operator.
8.2. AdditionalAlertmanagerConfig
8.2.1. Description
The AdditionalAlertmanagerConfig resource defines settings for how a component communicates with additional Alertmanager instances.
8.2.2. Required
-
apiVersion
Appears in: PrometheusK8sConfig, PrometheusRestrictedConfig, ThanosRulerConfig
| Property | Type | Description |
|---|---|---|
| apiVersion | string |
Defines the API version of Alertmanager. |
| bearerToken | *v1.SecretKeySelector | Defines the secret key reference containing the bearer token to use when authenticating to Alertmanager. |
| pathPrefix | string | Defines the path prefix to add in front of the push endpoint path. |
| scheme | string |
Defines the URL scheme to use when communicating with Alertmanager instances. Possible values are |
| staticConfigs | []string |
A list of statically configured Alertmanager endpoints in the form of |
| timeout | *string | Defines the timeout value used when sending alerts. |
| tlsConfig | Defines the TLS settings to use for Alertmanager connections. |
8.3. AlertmanagerMainConfig
8.3.1. Description
The AlertmanagerMainConfig resource defines settings for the Alertmanager component in the openshift-monitoring namespace.
Appears in: ClusterMonitoringConfiguration
| Property | Type | Description |
|---|---|---|
| enabled | *bool |
A Boolean flag that enables or disables the main Alertmanager instance in the |
| enableUserAlertmanagerConfig | bool |
A Boolean flag that enables or disables user-defined namespaces to be selected for |
| logLevel | string |
Defines the log level setting for Alertmanager. The possible values are: |
| nodeSelector | map[string]string | Defines the nodes on which the Pods are scheduled. |
| resources | *v1.ResourceRequirements | Defines resource requests and limits for the Alertmanager container. |
| secrets | []string |
Defines a list of secrets to be mounted into Alertmanager. The secrets must reside within the same namespace as the Alertmanager object. They are added as volumes named |
| tolerations | []v1.Toleration | Defines tolerations for the pods. |
| topologySpreadConstraints | []v1.TopologySpreadConstraint | Defines a pod’s topology spread constraints. |
| volumeClaimTemplate | *monv1.EmbeddedPersistentVolumeClaim | Defines persistent storage for Alertmanager. Use this setting to configure the persistent volume claim, including storage class, volume size, and name. |
8.4. AlertmanagerUserWorkloadConfig
8.4.1. Description
The AlertmanagerUserWorkloadConfig resource defines the settings for the Alertmanager instance used for user-defined projects.
Appears in: UserWorkloadConfiguration
| Property | Type | Description |
|---|---|---|
| enabled | bool |
A Boolean flag that enables or disables a dedicated instance of Alertmanager for user-defined alerts in the |
| enableAlertmanagerConfig | bool |
A Boolean flag to enable or disable user-defined namespaces to be selected for |
| logLevel | string |
Defines the log level setting for Alertmanager for user workload monitoring. The possible values are |
| resources | *v1.ResourceRequirements | Defines resource requests and limits for the Alertmanager container. |
| secrets | []string |
Defines a list of secrets to be mounted into Alertmanager. The secrets must be located within the same namespace as the Alertmanager object. They are added as volumes named |
| nodeSelector | map[string]string | Defines the nodes on which the pods are scheduled. |
| tolerations | []v1.Toleration | Defines tolerations for the pods. |
| topologySpreadConstraints | []v1.TopologySpreadConstraint | Defines a pod’s topology spread constraints. |
| volumeClaimTemplate | *monv1.EmbeddedPersistentVolumeClaim | Defines persistent storage for Alertmanager. Use this setting to configure the persistent volume claim, including storage class, volume size and name. |
8.5. ClusterMonitoringConfiguration
8.5.1. Description
The ClusterMonitoringConfiguration resource defines settings that customize the default platform monitoring stack through the cluster-monitoring-config config map in the openshift-monitoring namespace.
| Property | Type | Description |
|---|---|---|
| alertmanagerMain |
| |
| enableUserWorkload | *bool |
|
| userWorkload |
| |
| kubeStateMetrics |
| |
| metricsServer |
| |
| prometheusK8s |
| |
| prometheusOperator |
| |
| prometheusOperatorAdmissionWebhook |
| |
| openshiftStateMetrics |
| |
| telemeterClient |
| |
| thanosQuerier |
| |
| nodeExporter |
| |
| monitoringPlugin |
|
8.6. KubeStateMetricsConfig
8.6.1. Description
The KubeStateMetricsConfig resource defines settings for the kube-state-metrics agent.
Appears in: ClusterMonitoringConfiguration
| Property | Type | Description |
|---|---|---|
| nodeSelector | map[string]string | Defines the nodes on which the pods are scheduled. |
| resources | *v1.ResourceRequirements |
Defines resource requests and limits for the |
| tolerations | []v1.Toleration | Defines tolerations for the pods. |
| topologySpreadConstraints | []v1.TopologySpreadConstraint | Defines a pod’s topology spread constraints. |
8.7. MetricsServerConfig
8.7.1. Description
The MetricsServerConfig resource defines settings for the Metrics Server component.
Appears in: ClusterMonitoringConfiguration
| Property | Type | Description |
|---|---|---|
| audit | *Audit |
Defines the audit configuration used by the Metrics Server instance. Possible profile values are |
| nodeSelector | map[string]string | Defines the nodes on which the pods are scheduled. |
| tolerations | []v1.Toleration | Defines tolerations for the pods. |
| verbosity | uint8 |
Defines the verbosity of log messages for Metrics Server. Valid values are positive integers, values over 10 are usually unnecessary. The default value is |
| resources | *v1.ResourceRequirements | Defines resource requests and limits for the Metrics Server container. |
| topologySpreadConstraints | []v1.TopologySpreadConstraint | Defines a pod’s topology spread constraints. |
8.8. MonitoringPluginConfig
8.8.1. Description
The MonitoringPluginConfig resource defines settings for the web console plugin component in the openshift-monitoring namespace.
Appears in: ClusterMonitoringConfiguration
| Property | Type | Description |
|---|---|---|
| nodeSelector | map[string]string | Defines the nodes on which the pods are scheduled. |
| resources | *v1.ResourceRequirements |
Defines resource requests and limits for the |
| tolerations | []v1.Toleration | Defines tolerations for the pods. |
| topologySpreadConstraints | []v1.TopologySpreadConstraint | Defines a pod’s topology spread constraints. |
8.9. NodeExporterCollectorBuddyInfoConfig
8.9.1. Description
The NodeExporterCollectorBuddyInfoConfig resource works as an on/off switch for the buddyinfo collector of the node-exporter agent. By default, the buddyinfo collector is disabled.
Appears in: NodeExporterCollectorConfig
| Property | Type | Description |
|---|---|---|
| enabled | bool |
A Boolean flag that enables or disables the |
8.10. NodeExporterCollectorConfig
8.10.1. Description
The NodeExporterCollectorConfig resource defines settings for individual collectors of the node-exporter agent.
Appears in: NodeExporterConfig
| Property | Type | Description |
|---|---|---|
| cpufreq |
Defines the configuration of the | |
| tcpstat |
Defines the configuration of the | |
| netdev |
Defines the configuration of the | |
| netclass |
Defines the configuration of the | |
| buddyinfo |
Defines the configuration of the | |
| mountstats |
Defines the configuration of the | |
| ksmd |
Defines the configuration of the | |
| processes |
Defines the configuration of the | |
| systemd |
Defines the configuration of the |
8.11. NodeExporterCollectorCpufreqConfig
8.11.1. Description
Use the NodeExporterCollectorCpufreqConfig resource to enable or disable the cpufreq collector of the node-exporter agent. By default, the cpufreq collector is disabled. Under certain circumstances, enabling the cpufreq collector increases CPU usage on machines with many cores. If you enable this collector and have machines with many cores, monitor your systems closely for excessive CPU usage.
Appears in: NodeExporterCollectorConfig
| Property | Type | Description |
|---|---|---|
| enabled | bool |
A Boolean flag that enables or disables the |
8.12. NodeExporterCollectorKSMDConfig
8.12.1. Description
Use the NodeExporterCollectorKSMDConfig resource to enable or disable the ksmd collector of the node-exporter agent. By default, the ksmd collector is disabled.
Appears in: NodeExporterCollectorConfig
| Property | Type | Description |
|---|---|---|
| enabled | bool |
A Boolean flag that enables or disables the |
8.13. NodeExporterCollectorMountStatsConfig
8.13.1. Description
Use the NodeExporterCollectorMountStatsConfig resource to enable or disable the mountstats collector of the node-exporter agent. By default, the mountstats collector is disabled. If you enable the collector, the following metrics become available: node_mountstats_nfs_read_bytes_total, node_mountstats_nfs_write_bytes_total, and node_mountstats_nfs_operations_requests_total. Be aware that these metrics can have a high cardinality. If you enable this collector, closely monitor any increases in memory usage for the prometheus-k8s pods.
Appears in: NodeExporterCollectorConfig
| Property | Type | Description |
|---|---|---|
| enabled | bool |
A Boolean flag that enables or disables the |
8.14. NodeExporterCollectorNetClassConfig
8.14.1. Description
Use the NodeExporterCollectorNetClassConfig resource to enable or disable the netclass collector of the node-exporter agent. By default, the netclass collector is enabled. If you disable this collector, these metrics become unavailable: node_network_info, node_network_address_assign_type, node_network_carrier, node_network_carrier_changes_total, node_network_carrier_up_changes_total, node_network_carrier_down_changes_total, node_network_device_id, node_network_dormant, node_network_flags, node_network_iface_id, node_network_iface_link, node_network_iface_link_mode, node_network_mtu_bytes, node_network_name_assign_type, node_network_net_dev_group, node_network_speed_bytes, node_network_transmit_queue_length, and node_network_protocol_type.
Appears in: NodeExporterCollectorConfig
| Property | Type | Description |
|---|---|---|
| enabled | bool |
A Boolean flag that enables or disables the |
| useNetlink | bool |
A Boolean flag that activates the |
8.15. NodeExporterCollectorNetDevConfig
8.15.1. Description
Use the NodeExporterCollectorNetDevConfig resource to enable or disable the netdev collector of the node-exporter agent. By default, the netdev collector is enabled. If disabled, these metrics become unavailable: node_network_receive_bytes_total, node_network_receive_compressed_total, node_network_receive_drop_total, node_network_receive_errs_total, node_network_receive_fifo_total, node_network_receive_frame_total, node_network_receive_multicast_total, node_network_receive_nohandler_total, node_network_receive_packets_total, node_network_transmit_bytes_total, node_network_transmit_carrier_total, node_network_transmit_colls_total, node_network_transmit_compressed_total, node_network_transmit_drop_total, node_network_transmit_errs_total, node_network_transmit_fifo_total, and node_network_transmit_packets_total.
Appears in: NodeExporterCollectorConfig
| Property | Type | Description |
|---|---|---|
| enabled | bool |
A Boolean flag that enables or disables the |
8.16. NodeExporterCollectorProcessesConfig
8.16.1. Description
Use the NodeExporterCollectorProcessesConfig resource to enable or disable the processes collector of the node-exporter agent. If the collector is enabled, the following metrics become available: node_processes_max_processes, node_processes_pids, node_processes_state, node_processes_threads, node_processes_threads_state. The metric node_processes_state and node_processes_threads_state can have up to five series each, depending on the state of the processes and threads. The possible states of a process or a thread are: D (UNINTERRUPTABLE_SLEEP), R (RUNNING & RUNNABLE), S (INTERRUPTABLE_SLEEP), T (STOPPED), or Z (ZOMBIE). By default, the processes collector is disabled.
Appears in: NodeExporterCollectorConfig
| Property | Type | Description |
|---|---|---|
| enabled | bool |
A Boolean flag that enables or disables the |
8.17. NodeExporterCollectorSystemdConfig
8.17.1. Description
Use the NodeExporterCollectorSystemdConfig resource to enable or disable the systemd collector of the node-exporter agent. By default, the systemd collector is disabled. If enabled, the following metrics become available: node_systemd_system_running, node_systemd_units, node_systemd_version. If the unit uses a socket, it also generates the following metrics: node_systemd_socket_accepted_connections_total, node_systemd_socket_current_connections, node_systemd_socket_refused_connections_total. You can use the units parameter to select the systemd units to be included by the systemd collector. The selected units are used to generate the node_systemd_unit_state metric, which shows the state of each systemd unit. However, this metric’s cardinality might be high (at least five series per unit per node). If you enable this collector with a long list of selected units, closely monitor the prometheus-k8s deployment for excessive memory usage. Note that the node_systemd_timer_last_trigger_seconds metric is only shown if you have configured the value of the units parameter as logrotate.timer.
Appears in: NodeExporterCollectorConfig
| Property | Type | Description |
|---|---|---|
| enabled | bool |
A Boolean flag that enables or disables the |
| units | []string |
A list of regular expression (regex) patterns that match systemd units to be included by the |
8.18. NodeExporterCollectorTcpStatConfig
8.18.1. Description
The NodeExporterCollectorTcpStatConfig resource works as an on/off switch for the tcpstat collector of the node-exporter agent. By default, the tcpstat collector is disabled.
Appears in: NodeExporterCollectorConfig
| Property | Type | Description |
|---|---|---|
| enabled | bool |
A Boolean flag that enables or disables the |
8.19. NodeExporterConfig
8.19.1. Description
The NodeExporterConfig resource defines settings for the node-exporter agent.
Appears in: ClusterMonitoringConfiguration
| Property | Type | Description |
|---|---|---|
| collectors | Defines which collectors are enabled and their additional configuration parameters. | |
| maxProcs | uint32 |
The target number of CPUs on which the node-exporter’s process will run. The default value is |
| ignoredNetworkDevices | *[]string |
A list of network devices, defined as regular expressions, that you want to exclude from the relevant collector configuration such as |
| resources | *v1.ResourceRequirements |
Defines resource requests and limits for the |
8.20. OpenShiftStateMetricsConfig
8.20.1. Description
The OpenShiftStateMetricsConfig resource defines settings for the openshift-state-metrics agent.
Appears in: ClusterMonitoringConfiguration
| Property | Type | Description |
|---|---|---|
| nodeSelector | map[string]string | Defines the nodes on which the pods are scheduled. |
| resources | *v1.ResourceRequirements |
Defines resource requests and limits for the |
| tolerations | []v1.Toleration | Defines tolerations for the pods. |
| topologySpreadConstraints | []v1.TopologySpreadConstraint | Defines the pod’s topology spread constraints. |
8.21. PrometheusK8sConfig
8.21.1. Description
The PrometheusK8sConfig resource defines settings for the Prometheus component.
Appears in: ClusterMonitoringConfiguration
| Property | Type | Description |
|---|---|---|
| additionalAlertmanagerConfigs | Configures additional Alertmanager instances that receive alerts from the Prometheus component. By default, no additional Alertmanager instances are configured. | |
| enforcedBodySizeLimit | string |
Enforces a body size limit for Prometheus scraped metrics. If a scraped target’s body response is larger than the limit, the scrape will fail. The following values are valid: an empty value to specify no limit, a numeric value in Prometheus size format (such as |
| externalLabels | ExternalLabels | Defines labels to be added to any time series or alerts when communicating with external systems such as federation, remote storage, and Alertmanager. The type is map[string]string. By default, no labels are added. |
| logLevel | string |
Defines the log level setting for Prometheus. The possible values are: |
| nodeSelector | map[string]string | Defines the nodes on which the pods are scheduled. |
| queryLogFile | string |
Specifies the file to which PromQL queries are logged. This setting can be either a filename, in which case the queries are saved to an |
| remoteWrite | Defines the remote write configuration, including URL, authentication, and relabeling settings. | |
| resources | *v1.ResourceRequirements |
Defines resource requests and limits for the |
| retention | string |
Defines the duration for which Prometheus retains data. This definition must be specified using the following regular expression pattern: |
| retentionSize | string |
Defines the maximum amount of disk space used by data blocks plus the write-ahead log (WAL). Supported values are |
| tolerations | []v1.Toleration | Defines tolerations for the pods. |
| topologySpreadConstraints | []v1.TopologySpreadConstraint | Defines the pod’s topology spread constraints. |
| collectionProfile | CollectionProfile |
Defines the metrics collection profile that Prometheus uses to collect metrics from the platform components. Supported values are |
| volumeClaimTemplate | *monv1.EmbeddedPersistentVolumeClaim | Defines persistent storage for Prometheus. Use this setting to configure the persistent volume claim, including storage class, volume size and name. |
8.22. PrometheusOperatorConfig
8.22.1. Description
The PrometheusOperatorConfig resource defines settings for the Prometheus Operator component.
Appears in: ClusterMonitoringConfiguration, UserWorkloadConfiguration
| Property | Type | Description |
|---|---|---|
| logLevel | string |
Defines the log level settings for Prometheus Operator. The possible values are |
| nodeSelector | map[string]string | Defines the nodes on which the pods are scheduled. |
| resources | *v1.ResourceRequirements |
Defines resource requests and limits for the |
| tolerations | []v1.Toleration | Defines tolerations for the pods. |
| topologySpreadConstraints | []v1.TopologySpreadConstraint | Defines the pod’s topology spread constraints. |
8.23. PrometheusOperatorAdmissionWebhookConfig
8.23.1. Description
The PrometheusOperatorAdmissionWebhookConfig resource defines settings for the admission webhook workload for Prometheus Operator.
Appears in: ClusterMonitoringConfiguration
| Property | Type | Description |
|---|---|---|
| resources | *v1.ResourceRequirements |
Defines resource requests and limits for the |
| topologySpreadConstraints | []v1.TopologySpreadConstraint | Defines a pod’s topology spread constraints. |
8.24. PrometheusRestrictedConfig
8.24.1. Description
The PrometheusRestrictedConfig resource defines the settings for the Prometheus component that monitors user-defined projects.
Appears in: UserWorkloadConfiguration
| Property | Type | Description |
|---|---|---|
| scrapeInterval | string |
Configures the default interval between consecutive scrapes in case the |
| evaluationInterval | string |
Configures the default interval between rule evaluations in case the |
| additionalAlertmanagerConfigs | Configures additional Alertmanager instances that receive alerts from the Prometheus component. By default, no additional Alertmanager instances are configured. | |
| enforcedLabelLimit | *uint64 |
Specifies a per-scrape limit on the number of labels accepted for a sample. If the number of labels exceeds this limit after metric relabeling, the entire scrape is treated as failed. The default value is |
| enforcedLabelNameLengthLimit | *uint64 |
Specifies a per-scrape limit on the length of a label name for a sample. If the length of a label name exceeds this limit after metric relabeling, the entire scrape is treated as failed. The default value is |
| enforcedLabelValueLengthLimit | *uint64 |
Specifies a per-scrape limit on the length of a label value for a sample. If the length of a label value exceeds this limit after metric relabeling, the entire scrape is treated as failed. The default value is |
| enforcedSampleLimit | *uint64 |
Specifies a global limit on the number of scraped samples that will be accepted. This setting overrides the |
| enforcedTargetLimit | *uint64 |
Specifies a global limit on the number of scraped targets. This setting overrides the |
| externalLabels | ExternalLabels | Defines labels to be added to any time series or alerts when communicating with external systems such as federation, remote storage, and Alertmanager. The type is map[string]string. By default, no labels are added. |
| logLevel | string |
Defines the log level setting for Prometheus. The possible values are |
| nodeSelector | map[string]string | Defines the nodes on which the pods are scheduled. |
| queryLogFile | string |
Specifies the file to which PromQL queries are logged. This setting can be either a filename, in which case the queries are saved to an |
| remoteWrite | Defines the remote write configuration, including URL, authentication, and relabeling settings. | |
| resources | *v1.ResourceRequirements | Defines resource requests and limits for the Prometheus container. |
| retention | string |
Defines the duration for which Prometheus retains data. This definition must be specified using the following regular expression pattern: |
| retentionSize | string |
Defines the maximum amount of disk space used by data blocks plus the write-ahead log (WAL). Supported values are |
| tolerations | []v1.Toleration | Defines tolerations for the pods. |
| topologySpreadConstraints | []v1.TopologySpreadConstraint | Defines the pod’s topology spread constraints. |
| volumeClaimTemplate | *monv1.EmbeddedPersistentVolumeClaim | Defines persistent storage for Prometheus. Use this setting to configure the storage class and size of a volume. |
8.25. RemoteWriteSpec
8.25.1. Description
The RemoteWriteSpec resource defines the settings for remote write storage.
8.25.2. Required
-
url
Appears in: PrometheusK8sConfig, PrometheusRestrictedConfig
| Property | Type | Description |
|---|---|---|
| authorization | *monv1.SafeAuthorization | Defines the authorization settings for remote write storage. |
| basicAuth | *monv1.BasicAuth | Defines Basic authentication settings for the remote write endpoint URL. |
| bearerTokenFile | string | Defines the file that contains the bearer token for the remote write endpoint. However, because you cannot mount secrets in a pod, in practice you can only reference the token of the service account. |
| headers | map[string]string | Specifies the custom HTTP headers to be sent along with each remote write request. Headers set by Prometheus cannot be overwritten. |
| metadataConfig | *monv1.MetadataConfig | Defines settings for sending series metadata to remote write storage. |
| name | string | Defines the name of the remote write queue. This name is used in metrics and logging to differentiate queues. If specified, this name must be unique. |
| oauth2 | *monv1.OAuth2 | Defines OAuth2 authentication settings for the remote write endpoint. |
| proxyUrl | string | Defines an optional proxy URL. If the cluster-wide proxy is enabled, it replaces the proxyUrl setting. The cluster-wide proxy supports both HTTP and HTTPS proxies, with HTTPS taking precedence. |
| queueConfig | *monv1.QueueConfig | Allows tuning configuration for remote write queue parameters. |
| remoteTimeout | string | Defines the timeout value for requests to the remote write endpoint. |
| sendExemplars | *bool | Enables sending exemplars via remote write. When enabled, this setting configures Prometheus to store a maximum of 100,000 exemplars in memory. This setting only applies to user-defined monitoring and is not applicable to core platform monitoring. |
| sigv4 | *monv1.Sigv4 | Defines AWS Signature Version 4 authentication settings. |
| tlsConfig | *monv1.SafeTLSConfig | Defines TLS authentication settings for the remote write endpoint. |
| url | string | Defines the URL of the remote write endpoint to which samples will be sent. |
| writeRelabelConfigs | []monv1.RelabelConfig | Defines the list of remote write relabel configurations. |
8.26. TLSConfig
8.26.1. Description
The TLSConfig resource configures the settings for TLS connections.
8.26.2. Required
-
insecureSkipVerify
Appears in: AdditionalAlertmanagerConfig
| Property | Type | Description |
|---|---|---|
| ca | *v1.SecretKeySelector | Defines the secret key reference containing the Certificate Authority (CA) to use for the remote host. |
| cert | *v1.SecretKeySelector | Defines the secret key reference containing the public certificate to use for the remote host. |
| key | *v1.SecretKeySelector | Defines the secret key reference containing the private key to use for the remote host. |
| serverName | string | Used to verify the hostname on the returned certificate. |
| insecureSkipVerify | bool |
When set to |
8.27. TelemeterClientConfig
8.27.1. Description
TelemeterClientConfig defines settings for the Telemeter Client component.
8.27.2. Required
-
nodeSelector -
tolerations
Appears in: ClusterMonitoringConfiguration
| Property | Type | Description |
|---|---|---|
| nodeSelector | map[string]string | Defines the nodes on which the pods are scheduled. |
| resources | *v1.ResourceRequirements |
Defines resource requests and limits for the |
| tolerations | []v1.Toleration | Defines tolerations for the pods. |
| topologySpreadConstraints | []v1.TopologySpreadConstraint | Defines the pod’s topology spread constraints. |
8.28. ThanosQuerierConfig
8.28.1. Description
The ThanosQuerierConfig resource defines settings for the Thanos Querier component.
Appears in: ClusterMonitoringConfiguration
| Property | Type | Description |
|---|---|---|
| enableRequestLogging | bool |
A Boolean flag that enables or disables request logging. The default value is |
| logLevel | string |
Defines the log level setting for Thanos Querier. The possible values are |
| enableCORS | bool |
A Boolean flag that enables setting CORS headers. The headers allow access from any origin. The default value is |
| nodeSelector | map[string]string | Defines the nodes on which the pods are scheduled. |
| resources | *v1.ResourceRequirements | Defines resource requests and limits for the Thanos Querier container. |
| tolerations | []v1.Toleration | Defines tolerations for the pods. |
| topologySpreadConstraints | []v1.TopologySpreadConstraint | Defines the pod’s topology spread constraints. |
8.29. ThanosRulerConfig
8.29.1. Description
The ThanosRulerConfig resource defines configuration for the Thanos Ruler instance for user-defined projects.
Appears in: UserWorkloadConfiguration
| Property | Type | Description |
|---|---|---|
| additionalAlertmanagerConfigs |
Configures how the Thanos Ruler component communicates with additional Alertmanager instances. The Cluster Monitoring Operator reads the cluster-wide proxy settings and configures the appropriate proxy URL for the Alertmanager endpoints. All Alertmanager endpoints in this group are expected to use the same proxy URL. Endpoints that bypass the cluster proxy should be placed in a separate group. The default value is | |
| evaluationInterval | string |
Configures the default interval between Prometheus rule evaluations in case the |
| logLevel | string |
Defines the log level setting for Thanos Ruler. The possible values are |
| nodeSelector | map[string]string | Defines the nodes on which the Pods are scheduled. |
| resources | *v1.ResourceRequirements | Defines resource requests and limits for the Alertmanager container. |
| retention | string |
Defines the duration for which Prometheus retains data. This definition must be specified using the following regular expression pattern: |
| tolerations | []v1.Toleration | Defines tolerations for the pods. |
| topologySpreadConstraints | []v1.TopologySpreadConstraint | Defines the pod’s topology spread constraints. |
| volumeClaimTemplate | *monv1.EmbeddedPersistentVolumeClaim | Defines persistent storage for Thanos Ruler. Use this setting to configure the storage class and size of a volume. |
8.30. UserWorkloadConfig
8.30.1. Description
The UserWorkloadConfig resource defines settings for the monitoring of user-defined projects.
Appears in: ClusterMonitoringConfiguration
| Property | Type | Description |
|---|---|---|
| rulesWithoutLabelEnforcementAllowed | *bool |
A Boolean flag that enables or disables the ability to deploy user-defined |
8.31. UserWorkloadConfiguration
8.31.1. Description
The UserWorkloadConfiguration resource defines the settings responsible for user-defined projects in the user-workload-monitoring-config config map in the openshift-user-workload-monitoring namespace. You can only enable UserWorkloadConfiguration after you have set enableUserWorkload to true in the cluster-monitoring-config config map under the openshift-monitoring namespace.
| Property | Type | Description |
|---|---|---|
| alertmanager | Defines the settings for the Alertmanager component in user workload monitoring. | |
| prometheus | Defines the settings for the Prometheus component in user workload monitoring. | |
| prometheusOperator | Defines the settings for the Prometheus Operator component in user workload monitoring. | |
| thanosRuler | Defines the settings for the Thanos Ruler component in user workload monitoring. | |
| namespacesWithoutLabelEnforcement | []string |
Defines the list of namespaces for which Prometheus and Thanos Ruler in user-defined monitoring do not enforce the
The
To make the resulting alerts and metrics visible to project users, the query expressions should return a |
Legal Notice
Copyright © Red Hat
OpenShift documentation is licensed under the Apache License 2.0 (https://www.apache.org/licenses/LICENSE-2.0).
Modified versions must remove all Red Hat trademarks.
Portions adapted from https://github.com/kubernetes-incubator/service-catalog/ with modifications by Red Hat.
Red Hat, Red Hat Enterprise Linux, the Red Hat logo, the Shadowman logo, JBoss, OpenShift, Fedora, the Infinity logo, and RHCE are trademarks of Red Hat, Inc., registered in the United States and other countries.
Linux® is the registered trademark of Linus Torvalds in the United States and other countries.
Java® is a registered trademark of Oracle and/or its affiliates.
XFS® is a trademark of Silicon Graphics International Corp. or its subsidiaries in the United States and/or other countries.
MySQL® is a registered trademark of MySQL AB in the United States, the European Union and other countries.
Node.js® is an official trademark of the OpenJS Foundation.
The OpenStack® Word Mark and OpenStack logo are either registered trademarks/service marks or trademarks/service marks of the OpenStack Foundation, in the United States and other countries and are used with the OpenStack Foundation’s permission. We are not affiliated with, endorsed or sponsored by the OpenStack Foundation, or the OpenStack community.
All other trademarks are the property of their respective owners.