Este contenido no está disponible en el idioma seleccionado.
Chapter 21. System Monitoring Tools
In order to configure the system, system administrators often need to determine the amount of free memory, how much free disk space is available, how the hard drive is partitioned, or what processes are running.
21.1. Viewing System Processes
21.1.1. Using the ps Command
The ps command allows you to display information about running processes. It produces a static list, that is, a snapshot of what is running when you execute the command. If you want a constantly updated list of running processes, use the top command or the System Monitor application instead.
To list all processes that are currently running on the system including processes owned by other users, type the following at a shell prompt:
ps ax
ps ax
For each listed process, the ps ax command displays the process ID (PID), the terminal that is associated with it (TTY), the current status (STAT), the cumulated CPU time (TIME), and the name of the executable file (COMMAND). For example:
To display the owner alongside each process, use the following command:
ps aux
ps aux
Apart from the information provided by the ps ax command, ps aux displays the effective user name of the process owner (USER), the percentage of the CPU (%CPU) and memory (%MEM) usage, the virtual memory size in kilobytes (VSZ), the non-swapped physical memory size in kilobytes (RSS), and the time or date the process was started. For example:
You can also use the ps command in a combination with grep to see if a particular process is running. For example, to determine if Emacs is running, type:
ps ax | grep emacs
~]$ ps ax | grep emacs
12056 pts/3  S+   0:00 emacs
12060 pts/2 S+ 0:00 grep --color=auto emacsFor a complete list of available command line options, see the ps(1) manual page.
21.1.2. Using the top Command
The top command displays a real-time list of processes that are running on the system. It also displays additional information about the system uptime, current CPU and memory usage, or total number of running processes, and allows you to perform actions such as sorting the list or killing a process.
To run the top command, type the following at a shell prompt:
top
top
For each listed process, the top command displays the process ID (PID), the effective user name of the process owner (USER), the priority (PR), the nice value (NI), the amount of virtual memory the process uses (VIRT), the amount of non-swapped physical memory the process uses (RES), the amount of shared memory the process uses (SHR), the process status field S), the percentage of the CPU (%CPU) and memory (%MEM) usage, the cumulated CPU time (TIME+), and the name of the executable file (COMMAND). For example:
Table 21.1, “Interactive top commands” contains useful interactive commands that you can use with top. For more information, see the top(1) manual page.
| Command | Description |
|---|---|
| Enter, Space | Immediately refreshes the display. |
| h | Displays a help screen for interactive commands. |
| h, ? | Displays a help screen for windows and field groups. |
| k | Kills a process. You are prompted for the process ID and the signal to send to it. |
| n | Changes the number of displayed processes. You are prompted to enter the number. |
| u | Sorts the list by user. |
| M | Sorts the list by memory usage. |
| P | Sorts the list by CPU usage. |
| q | Terminates the utility and returns to the shell prompt. |
21.1.3. Using the System Monitor Tool
The Processes tab of the System Monitor tool allows you to view, search for, change the priority of, and kill processes from the graphical user interface.
To start the System Monitor tool from the command line, type gnome-system-monitor at a shell prompt. The System Monitor tool appears. Alternatively, if using the GNOME desktop, press the Super key to enter the Activities Overview, type System Monitor and then press Enter. The System Monitor tool appears. The Super key appears in a variety of guises, depending on the keyboard and other hardware, but often as either the Windows or Command key, and typically to the left of the Spacebar.
Click the Processes tab to view the list of running processes.
Figure 21.1. System Monitor — Processes
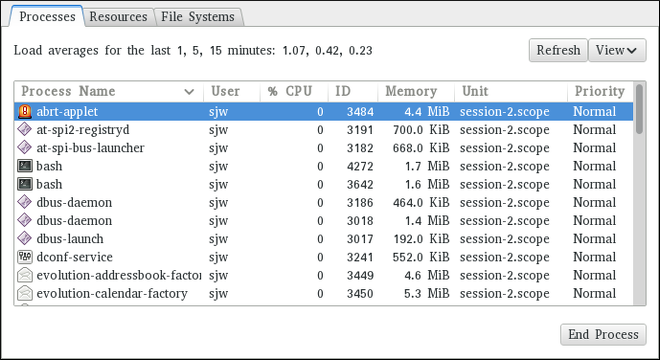
For each listed process, the System Monitor tool displays its name (Process Name), current status (Status), percentage of the CPU usage (% CPU), nice value (Nice), process ID (ID), memory usage (Memory), the channel the process is waiting in (Waiting Channel), and additional details about the session (Session). To sort the information by a specific column in ascending order, click the name of that column. Click the name of the column again to toggle the sort between ascending and descending order.
By default, the System Monitor tool displays a list of processes that are owned by the current user. Selecting various options from the View menu allows you to:
- view only active processes,
- view all processes,
- view your processes,
- view process dependencies,
Additionally, two buttons enable you to:
- refresh the list of processes,
- end a process by selecting it from the list and then clicking the button.
21.2. Viewing Memory Usage
21.2.1. Using the free Command
The free command allows you to display the amount of free and used memory on the system. To do so, type the following at a shell prompt:
free
free
The free command provides information about both the physical memory (Mem) and swap space (Swap). It displays the total amount of memory (total), as well as the amount of memory that is in use (used), free (free), shared (shared), sum of buffers and cached (buff/cache), and available (available). For example:
free
~]$ free
       total    used    free   shared buff/cache  available
Mem:    1016800   727300    84684    3500   204816   124068
Swap:    839676    66920   772756
By default, free displays the values in kilobytes. To display the values in megabytes, supply the -m command line option:
free -m
free -mFor instance:
free -m
~]$ free -m
       total    used    free   shared buff/cache  available
Mem:      992     711     81      3     200     120
Swap: 819 65 754For a complete list of available command line options, see the free(1) manual page.
21.2.2. Using the System Monitor Tool
The Resources tab of the System Monitor tool allows you to view the amount of free and used memory on the system.
To start the System Monitor tool from the command line, type gnome-system-monitor at a shell prompt. The System Monitor tool appears. Alternatively, if using the GNOME desktop, press the Super key to enter the Activities Overview, type System Monitor and then press Enter. The System Monitor tool appears. The Super key appears in a variety of guises, depending on the keyboard and other hardware, but often as either the Windows or Command key, and typically to the left of the Spacebar.
Click the Resources tab to view the system’s memory usage.
Figure 21.2. System Monitor — Resources
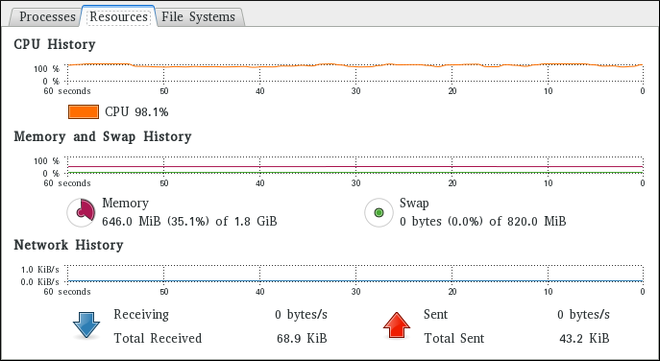
In the Memory and Swap History section, the System Monitor tool displays a graphical representation of the memory and swap usage history, as well as the total amount of the physical memory (Memory) and swap space (Swap) and how much of it is in use.
21.3. Viewing CPU Usage
21.3.1. Using the System Monitor Tool
The Resources tab of the System Monitor tool allows you to view the current CPU usage on the system.
To start the System Monitor tool from the command line, type gnome-system-monitor at a shell prompt. The System Monitor tool appears. Alternatively, if using the GNOME desktop, press the Super key to enter the Activities Overview, type System Monitor and then press Enter. The System Monitor tool appears. The Super key appears in a variety of guises, depending on the keyboard and other hardware, but often as either the Windows or Command key, and typically to the left of the Spacebar.
Click the Resources tab to view the system’s CPU usage.
In the CPU History section, the System Monitor tool displays a graphical representation of the CPU usage history and shows the percentage of how much CPU is currently in use.
21.4. Viewing Block Devices and File Systems
21.4.1. Using the lsblk Command
The lsblk command allows you to display a list of available block devices. It provides more information and better control on output formatting than the blkid command. It reads information from udev, therefore it is usable by non-root users. To display a list of block devices, type the following at a shell prompt:
lsblk
lsblk
For each listed block device, the lsblk command displays the device name (NAME), major and minor device number (MAJ:MIN), if the device is removable (RM), its size (SIZE), if the device is read-only (RO), what type it is (TYPE), and where the device is mounted (MOUNTPOINT). For example:
By default, lsblk lists block devices in a tree-like format. To display the information as an ordinary list, add the -l command line option:
lsblk -l
lsblk -lFor instance:
For a complete list of available command line options, see the lsblk(8) manual page.
21.4.2. Using the blkid Command
The blkid command allows you to display low-level information about available block devices. It requires root privileges, therefore non-root users should use the lsblk command. To do so, type the following at a shell prompt as root:
blkid
blkid
For each listed block device, the blkid command displays available attributes such as its universally unique identifier (UUID), file system type (TYPE), or volume label (LABEL). For example:
blkid
~]# blkid
/dev/vda1: UUID="7fa9c421-0054-4555-b0ca-b470a97a3d84" TYPE="ext4"
/dev/vda2: UUID="7IvYzk-TnnK-oPjf-ipdD-cofz-DXaJ-gPdgBW" TYPE="LVM2_member"
/dev/mapper/vg_kvm-lv_root: UUID="a07b967c-71a0-4925-ab02-aebcad2ae824" TYPE="ext4"
/dev/mapper/vg_kvm-lv_swap: UUID="d7ef54ca-9c41-4de4-ac1b-4193b0c1ddb6" TYPE="swap"
By default, the blkid command lists all available block devices. To display information about a particular device only, specify the device name on the command line:
blkid device_name
blkid device_name
For instance, to display information about /dev/vda1, type as root:
blkid /dev/vda1
~]# blkid /dev/vda1
/dev/vda1: UUID="7fa9c421-0054-4555-b0ca-b470a97a3d84" TYPE="ext4"
You can also use the above command with the -p and -o udev command line options to obtain more detailed information. Note that root privileges are required to run this command:
blkid -po udev device_name
blkid -po udev device_nameFor example:
For a complete list of available command line options, see the blkid(8) manual page.
21.4.3. Using the findmnt Command
The findmnt command allows you to display a list of currently mounted file systems. To do so, type the following at a shell prompt:
findmnt
findmnt
For each listed file system, the findmnt command displays the target mount point (TARGET), source device (SOURCE), file system type (FSTYPE), and relevant mount options (OPTIONS). For example:
By default, findmnt lists file systems in a tree-like format. To display the information as an ordinary list, add the -l command line option:
findmnt -l
findmnt -lFor instance:
You can also choose to list only file systems of a particular type. To do so, add the -t command line option followed by a file system type:
findmnt -t type
findmnt -t type
For example, to all list xfs file systems, type:
findmnt -t xfs
~]$ findmnt -t xfs
TARGET SOURCE        FSTYPE OPTIONS
/    /dev/mapper/rhel-root xfs  rw,relatime,seclabel,attr2,inode64,noquota
└─/boot /dev/vda1 xfs rw,relatime,seclabel,attr2,inode64,noquotaFor a complete list of available command line options, see the findmnt(8) manual page.
21.4.4. Using the df Command
The df command allows you to display a detailed report on the system’s disk space usage. To do so, type the following at a shell prompt:
df
df
For each listed file system, the df command displays its name (Filesystem), size (1K-blocks or Size), how much space is used (Used), how much space is still available (Available), the percentage of space usage (Use%), and where is the file system mounted (Mounted on). For example:
df
~]$ df
Filesystem         1K-blocks   Used Available Use% Mounted on
/dev/mapper/vg_kvm-lv_root 18618236  4357360 13315112 25% /
tmpfs             380376    288  380088  1% /dev/shm
/dev/vda1           495844   77029  393215 17% /boot
By default, the df command shows the partition size in 1 kilobyte blocks and the amount of used and available disk space in kilobytes. To view the information in megabytes and gigabytes, supply the -h command line option, which causes df to display the values in a human-readable format:
df -h
df -hFor instance:
df -h
~]$ df -h
Filesystem         Size Used Avail Use% Mounted on
/dev/mapper/vg_kvm-lv_root  18G 4.2G  13G 25% /
tmpfs            372M 288K 372M  1% /dev/shm
/dev/vda1 485M 76M 384M 17% /bootFor a complete list of available command line options, see the df(1) manual page.
21.4.5. Using the du Command
The du command allows you to displays the amount of space that is being used by files in a directory. To display the disk usage for each of the subdirectories in the current working directory, run the command with no additional command line options:
du
duFor example:
By default, the du command displays the disk usage in kilobytes. To view the information in megabytes and gigabytes, supply the -h command line option, which causes the utility to display the values in a human-readable format:
du -h
du -hFor instance:
At the end of the list, the du command always shows the grand total for the current directory. To display only this information, supply the -s command line option:
du -sh
du -shFor example:
du -sh
~]$ du -sh
15M .For a complete list of available command line options, see the du(1) manual page.
21.4.6. Using the System Monitor Tool
The File Systems tab of the System Monitor tool allows you to view file systems and disk space usage in the graphical user interface.
To start the System Monitor tool from the command line, type gnome-system-monitor at a shell prompt. The System Monitor tool appears. Alternatively, if using the GNOME desktop, press the Super key to enter the Activities Overview, type System Monitor and then press Enter. The System Monitor tool appears. The Super key appears in a variety of guises, depending on the keyboard and other hardware, but often as either the Windows or Command key, and typically to the left of the Spacebar.
Click the File Systems tab to view a list of file systems.
Figure 21.3. System Monitor — File Systems
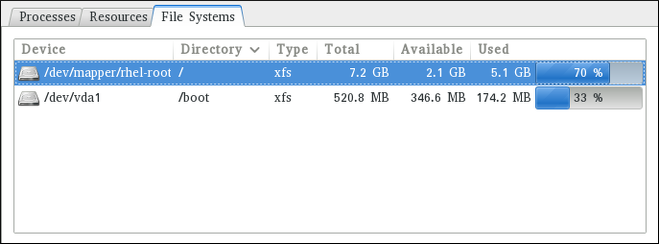
For each listed file system, the System Monitor tool displays the source device (Device), target mount point (Directory), and file system type (Type), as well as its size (Total), and how much space is available (Available), and used (Used).
21.5. Viewing Hardware Information
21.5.1. Using the lspci Command
The lspci command allows you to display information about PCI buses and devices that are attached to them. To list all PCI devices that are in the system, type the following at a shell prompt:
lspci
lspciThis displays a simple list of devices, for example:
You can also use the -v command line option to display more verbose output, or -vv for very verbose output:
lspci -v|-vv
lspci -v|-vvFor instance, to determine the manufacturer, model, and memory size of a system’s video card, type:
For a complete list of available command line options, see the lspci(8) manual page.
21.5.2. Using the lsusb Command
The lsusb command allows you to display information about USB buses and devices that are attached to them. To list all USB devices that are in the system, type the following at a shell prompt:
lsusb
lsusbThis displays a simple list of devices, for example:
You can also use the -v command line option to display more verbose output:
lsusb -v
lsusb -vFor instance:
For a complete list of available command line options, see the lsusb(8) manual page.
21.5.3. Using the lscpu Command
The lscpu command allows you to list information about CPUs that are present in the system, including the number of CPUs, their architecture, vendor, family, model, CPU caches, etc. To do so, type the following at a shell prompt:
lscpu
lscpuFor example:
For a complete list of available command line options, see the lscpu(1) manual page.
21.6. Checking for Hardware Errors
Red Hat Enterprise Linux 7 introduced the new hardware event report mechanism (HERM.) This mechanism gathers system-reported memory errors as well as errors reported by the error detection and correction (EDAC) mechanism for dual in-line memory modules (DIMMs) and reports them to user space. The user-space daemon rasdaemon, catches and handles all reliability, availability, and serviceability (RAS) error events that come from the kernel tracing mechanism, and logs them. The functions previously provided by edac-utils are now replaced by rasdaemon.
To install rasdaemon, enter the following command as root:
yum install rasdaemon
~]# yum install rasdaemonStart the service as follows:
systemctl start rasdaemon
~]# systemctl start rasdaemonTo make the service run at system start, enter the following command:
systemctl enable rasdaemon
~]# systemctl enable rasdaemon
The ras-mc-ctl utility provides a means to work with EDAC drivers. Enter the following command to see a list of command options:
To view a summary of memory controller events, run as root:
To view a list of errors reported by the memory controller, run as root:
These commands are also described in the ras-mc-ctl(8) manual page.
21.7. Monitoring Performance with Net-SNMP
Red Hat Enterprise Linux 7 includes the Net-SNMP software suite, which includes a flexible and extensible simple network management protocol (SNMP) agent. This agent and its associated utilities can be used to provide performance data from a large number of systems to a variety of tools which support polling over the SNMP protocol.
This section provides information on configuring the Net-SNMP agent to securely provide performance data over the network, retrieving the data using the SNMP protocol, and extending the SNMP agent to provide custom performance metrics.
21.7.1. Installing Net-SNMP
The Net-SNMP software suite is available as a set of RPM packages in the Red Hat Enterprise Linux software distribution. Table 21.2, “Available Net-SNMP packages” summarizes each of the packages and their contents.
| Package | Provides |
|---|---|
| net-snmp | The SNMP Agent Daemon and documentation. This package is required for exporting performance data. |
| net-snmp-libs |
The |
| net-snmp-utils |
SNMP clients such as |
| net-snmp-perl |
The |
| net-snmp-python | An SNMP client library for Python. Note that this package is provided by the Optional channel. See Section 9.5.7, “Adding the Optional and Supplementary Repositories” for more information on Red Hat additional channels. |
To install any of these packages, use the yum command in the following form:
yum install package…
yum install package…
For example, to install the SNMP Agent Daemon and SNMP clients used in the rest of this section, type the following at a shell prompt as root:
yum install net-snmp net-snmp-libs net-snmp-utils
~]# yum install net-snmp net-snmp-libs net-snmp-utilsFor more information on how to install new packages in Red Hat Enterprise Linux, see Section 9.2.4, “Installing Packages”.
21.7.2. Running the Net-SNMP Daemon
The net-snmp package contains snmpd, the SNMP Agent Daemon. This section provides information on how to start, stop, and restart the snmpd service. For more information on managing system services in Red Hat Enterprise Linux 7, see Chapter 10, Managing Services with systemd.
21.7.2.1. Starting the Service
To run the snmpd service in the current session, type the following at a shell prompt as root:
systemctl start snmpd.service
systemctl start snmpd.serviceTo configure the service to be automatically started at boot time, use the following command:
systemctl enable snmpd.service
systemctl enable snmpd.service21.7.2.2. Stopping the Service
To stop the running snmpd service, type the following at a shell prompt as root:
systemctl stop snmpd.service
systemctl stop snmpd.serviceTo disable starting the service at boot time, use the following command:
systemctl disable snmpd.service
systemctl disable snmpd.service21.7.2.3. Restarting the Service
To restart the running snmpd service, type the following at a shell prompt:
systemctl restart snmpd.service
systemctl restart snmpd.serviceThis command stops the service and starts it again in quick succession. To only reload the configuration without stopping the service, run the following command instead:
systemctl reload snmpd.service
systemctl reload snmpd.service
This causes the running snmpd service to reload its configuration.
21.7.3. Configuring Net-SNMP
To change the Net-SNMP Agent Daemon configuration, edit the /etc/snmp/snmpd.conf configuration file. The default snmpd.conf file included with Red Hat Enterprise Linux 7 is heavily commented and serves as a good starting point for agent configuration.
This section focuses on two common tasks: setting system information and configuring authentication. For more information about available configuration directives, see the snmpd.conf(5) manual page. Additionally, there is a utility in the net-snmp package named snmpconf which can be used to interactively generate a valid agent configuration.
Note that the net-snmp-utils package must be installed in order to use the snmpwalk utility described in this section.
For any changes to the configuration file to take effect, force the snmpd service to re-read the configuration by running the following command as root:
systemctl reload snmpd.service
systemctl reload snmpd.service21.7.3.1. Setting System Information
Net-SNMP provides some rudimentary system information via the system tree. For example, the following snmpwalk command shows the system tree with a default agent configuration.
By default, the sysName object is set to the host name. The sysLocation and sysContact objects can be configured in the /etc/snmp/snmpd.conf file by changing the value of the syslocation and syscontact directives, for example:
syslocation Datacenter, Row 4, Rack 3
syscontact UNIX Admin <admin@example.com>
syslocation Datacenter, Row 4, Rack 3
syscontact UNIX Admin <admin@example.com>
After making changes to the configuration file, reload the configuration and test it by running the snmpwalk command again:
21.7.3.2. Configuring Authentication
The Net-SNMP Agent Daemon supports all three versions of the SNMP protocol. The first two versions (1 and 2c) provide for simple authentication using a community string. This string is a shared secret between the agent and any client utilities. The string is passed in clear text over the network however and is not considered secure. Version 3 of the SNMP protocol supports user authentication and message encryption using a variety of protocols. The Net-SNMP agent also supports tunneling over SSH, and TLS authentication with X.509 certificates.
Configuring SNMP Version 2c Community
To configure an SNMP version 2c community, use either the rocommunity or rwcommunity directive in the /etc/snmp/snmpd.conf configuration file. The format of the directives is as follows:
directive community source OID
directive community source OID
… where community is the community string to use, source is an IP address or subnet, and OID is the SNMP tree to provide access to. For example, the following directive provides read-only access to the system tree to a client using the community string "redhat" on the local machine:
rocommunity redhat 127.0.0.1 .1.3.6.1.2.1.1
rocommunity redhat 127.0.0.1 .1.3.6.1.2.1.1
To test the configuration, use the snmpwalk command with the -v and -c options.
Configuring SNMP Version 3 User
To configure an SNMP version 3 user, use the net-snmp-create-v3-user command. This command adds entries to the /var/lib/net-snmp/snmpd.conf and /etc/snmp/snmpd.conf files which create the user and grant access to the user. Note that the net-snmp-create-v3-user command may only be run when the agent is not running. The following example creates the "admin" user with the password "redhatsnmp":
The rwuser directive (or rouser when the -ro command line option is supplied) that net-snmp-create-v3-user adds to /etc/snmp/snmpd.conf has a similar format to the rwcommunity and rocommunity directives:
directive user noauth|auth|priv OID
directive user noauth|auth|priv OID
… where user is a user name and OID is the SNMP tree to provide access to. By default, the Net-SNMP Agent Daemon allows only authenticated requests (the auth option). The noauth option allows you to permit unauthenticated requests, and the priv option enforces the use of encryption. The authpriv option specifies that requests must be authenticated and replies should be encrypted.
For example, the following line grants the user "admin" read-write access to the entire tree:
rwuser admin authpriv .1
rwuser admin authpriv .1
To test the configuration, create a .snmp/ directory in your user’s home directory and a configuration file named snmp.conf in that directory (~/.snmp/snmp.conf) with the following lines:
defVersion 3
defSecurityLevel authPriv
defSecurityName admin
defPassphrase redhatsnmp
defVersion 3
defSecurityLevel authPriv
defSecurityName admin
defPassphrase redhatsnmp
The snmpwalk command will now use these authentication settings when querying the agent:
snmpwalk -v3 localhost system
~]$ snmpwalk -v3 localhost system
SNMPv2-MIB::sysDescr.0 = STRING: Linux localhost.localdomain 3.10.0-123.el7.x86_64 #1 SMP Mon May 5 11:16:57 EDT 2014 x86_64
[output truncated]21.7.4. Retrieving Performance Data over SNMP
The Net-SNMP Agent in Red Hat Enterprise Linux provides a wide variety of performance information over the SNMP protocol. In addition, the agent can be queried for a listing of the installed RPM packages on the system, a listing of currently running processes on the system, or the network configuration of the system.
This section provides an overview of OIDs related to performance tuning available over SNMP. It assumes that the net-snmp-utils package is installed and that the user is granted access to the SNMP tree as described in Section 21.7.3.2, “Configuring Authentication”.
21.7.4.1. Hardware Configuration
The Host Resources MIB included with Net-SNMP presents information about the current hardware and software configuration of a host to a client utility. Table 21.3, “Available OIDs” summarizes the different OIDs available under that MIB.
| OID | Description |
|---|---|
|
| Contains general system information such as uptime, number of users, and number of running processes. |
|
| Contains data on memory and file system usage. |
|
| Contains a listing of all processors, network devices, and file systems. |
|
| Contains a listing of all running processes. |
|
| Contains memory and CPU statistics on the process table from HOST-RESOURCES-MIB::hrSWRun. |
|
| Contains a listing of the RPM database. |
There are also a number of SNMP tables available in the Host Resources MIB which can be used to retrieve a summary of the available information. The following example displays HOST-RESOURCES-MIB::hrFSTable:
For more information about HOST-RESOURCES-MIB, see the /usr/share/snmp/mibs/HOST-RESOURCES-MIB.txt file.
21.7.4.2. CPU and Memory Information
Most system performance data is available in the UCD SNMP MIB. The systemStats OID provides a number of counters around processor usage:
In particular, the ssCpuRawUser, ssCpuRawSystem, ssCpuRawWait, and ssCpuRawIdle OIDs provide counters which are helpful when determining whether a system is spending most of its processor time in kernel space, user space, or I/O. ssRawSwapIn and ssRawSwapOut can be helpful when determining whether a system is suffering from memory exhaustion.
More memory information is available under the UCD-SNMP-MIB::memory OID, which provides similar data to the free command:
Load averages are also available in the UCD SNMP MIB. The SNMP table UCD-SNMP-MIB::laTable has a listing of the 1, 5, and 15 minute load averages:
21.7.4.3. File System and Disk Information
The Host Resources MIB provides information on file system size and usage. Each file system (and also each memory pool) has an entry in the HOST-RESOURCES-MIB::hrStorageTable table:
The OIDs under HOST-RESOURCES-MIB::hrStorageSize and HOST-RESOURCES-MIB::hrStorageUsed can be used to calculate the remaining capacity of each mounted file system.
I/O data is available both in UCD-SNMP-MIB::systemStats (ssIORawSent.0 and ssIORawRecieved.0) and in UCD-DISKIO-MIB::diskIOTable. The latter provides much more granular data. Under this table are OIDs for diskIONReadX and diskIONWrittenX, which provide counters for the number of bytes read from and written to the block device in question since the system boot:
21.7.4.4. Network Information
The Interfaces MIB provides information on network devices. IF-MIB::ifTable provides an SNMP table with an entry for each interface on the system, the configuration of the interface, and various packet counters for the interface. The following example shows the first few columns of ifTable on a system with two physical network interfaces:
Network traffic is available under the OIDs IF-MIB::ifOutOctets and IF-MIB::ifInOctets. The following SNMP queries will retrieve network traffic for each of the interfaces on this system:
21.7.5. Extending Net-SNMP
The Net-SNMP Agent can be extended to provide application metrics in addition to raw system metrics. This allows for capacity planning as well as performance issue troubleshooting. For example, it may be helpful to know that an email system had a 5-minute load average of 15 while being tested, but it is more helpful to know that the email system has a load average of 15 while processing 80,000 messages a second. When application metrics are available via the same interface as the system metrics, this also allows for the visualization of the impact of different load scenarios on system performance (for example, each additional 10,000 messages increases the load average linearly until 100,000).
A number of the applications included in Red Hat Enterprise Linux extend the Net-SNMP Agent to provide application metrics over SNMP. There are several ways to extend the agent for custom applications as well. This section describes extending the agent with shell scripts and the Perl plug-ins from the Optional channel. It assumes that the net-snmp-utils and net-snmp-perl packages are installed, and that the user is granted access to the SNMP tree as described in Section 21.7.3.2, “Configuring Authentication”.
21.7.5.1. Extending Net-SNMP with Shell Scripts
The Net-SNMP Agent provides an extension MIB (NET-SNMP-EXTEND-MIB) that can be used to query arbitrary shell scripts. To specify the shell script to run, use the extend directive in the /etc/snmp/snmpd.conf file. Once defined, the Agent will provide the exit code and any output of the command over SNMP. The example below demonstrates this mechanism with a script which determines the number of httpd processes in the process table.
The Net-SNMP Agent also provides a built-in mechanism for checking the process table via the proc directive. See the snmpd.conf(5) manual page for more information.
The exit code of the following shell script is the number of httpd processes running on the system at a given point in time:
#!/bin/sh

NUMPIDS=pgrep httpd | wc -l

exit $NUMPIDS
#!/bin/sh

NUMPIDS=pgrep httpd | wc -l

exit $NUMPIDS
To make this script available over SNMP, copy the script to a location on the system path, set the executable bit, and add an extend directive to the /etc/snmp/snmpd.conf file. The format of the extend directive is the following:
extend name prog args
extend name prog args
… where name is an identifying string for the extension, prog is the program to run, and args are the arguments to give the program. For instance, if the above shell script is copied to /usr/local/bin/check_apache.sh, the following directive will add the script to the SNMP tree:
extend httpd_pids /bin/sh /usr/local/bin/check_apache.sh
extend httpd_pids /bin/sh /usr/local/bin/check_apache.sh
The script can then be queried at NET-SNMP-EXTEND-MIB::nsExtendObjects:
Note that the exit code ("8" in this example) is provided as an INTEGER type and any output is provided as a STRING type. To expose multiple metrics as integers, supply different arguments to the script using the extend directive. For example, the following shell script can be used to determine the number of processes matching an arbitrary string, and will also output a text string giving the number of processes:
The following /etc/snmp/snmpd.conf directives will give both the number of httpd PIDs as well as the number of snmpd PIDs when the above script is copied to /usr/local/bin/check_proc.sh:
extend httpd_pids /bin/sh /usr/local/bin/check_proc.sh httpd
extend snmpd_pids /bin/sh /usr/local/bin/check_proc.sh snmpd
extend httpd_pids /bin/sh /usr/local/bin/check_proc.sh httpd
extend snmpd_pids /bin/sh /usr/local/bin/check_proc.sh snmpd
The following example shows the output of an snmpwalk of the nsExtendObjects OID:
Integer exit codes are limited to a range of 0–255. For values that are likely to exceed 256, either use the standard output of the script (which will be typed as a string) or a different method of extending the agent.
This last example shows a query for the free memory of the system and the number of httpd processes. This query could be used during a performance test to determine the impact of the number of processes on memory pressure:
snmpget localhost \
  'NET-SNMP-EXTEND-MIB::nsExtendResult."httpd_pids"' \
  UCD-SNMP-MIB::memAvailReal.0
~]$ snmpget localhost \
  'NET-SNMP-EXTEND-MIB::nsExtendResult."httpd_pids"' \
  UCD-SNMP-MIB::memAvailReal.0
NET-SNMP-EXTEND-MIB::nsExtendResult."httpd_pids" = INTEGER: 8
UCD-SNMP-MIB::memAvailReal.0 = INTEGER: 799664 kB21.7.5.2. Extending Net-SNMP with Perl
Executing shell scripts using the extend directive is a fairly limited method for exposing custom application metrics over SNMP. The Net-SNMP Agent also provides an embedded Perl interface for exposing custom objects. The net-snmp-perl package in the Optional channel provides the NetSNMP::agent Perl module that is used to write embedded Perl plug-ins on Red Hat Enterprise Linux.
Before subscribing to the Optional and Supplementary channels see the Scope of Coverage Details. If you decide to install packages from these channels, follow the steps documented in the article called How to access Optional and Supplementary channels, and -devel packages using Red Hat Subscription Manager (RHSM)? on the Red Hat Customer Portal.
The NetSNMP::agent Perl module provides an agent object which is used to handle requests for a part of the agent’s OID tree. The agent object’s constructor has options for running the agent as a sub-agent of snmpd or a standalone agent. No arguments are necessary to create an embedded agent:
use NetSNMP::agent (':all');

my $agent = new NetSNMP::agent();
use NetSNMP::agent (':all');

my $agent = new NetSNMP::agent();
The agent object has a register method which is used to register a callback function with a particular OID. The register function takes a name, OID, and pointer to the callback function. The following example will register a callback function named hello_handler with the SNMP Agent which will handle requests under the OID .1.3.6.1.4.1.8072.9999.9999:
$agent->register("hello_world", ".1.3.6.1.4.1.8072.9999.9999",
         \&hello_handler);
$agent->register("hello_world", ".1.3.6.1.4.1.8072.9999.9999",
         \&hello_handler);
The OID .1.3.6.1.4.1.8072.9999.9999 (NET-SNMP-MIB::netSnmpPlaypen) is typically used for demonstration purposes only. If your organization does not already have a root OID, you can obtain one by contacting an ISO Name Registration Authority (ANSI in the United States).
The handler function will be called with four parameters, HANDLER, REGISTRATION_INFO, REQUEST_INFO, and REQUESTS. The REQUESTS parameter contains a list of requests in the current call and should be iterated over and populated with data. The request objects in the list have get and set methods which allow for manipulating the OID and value of the request. For example, the following call will set the value of a request object to the string "hello world":
$request->setValue(ASN_OCTET_STR, "hello world");
$request->setValue(ASN_OCTET_STR, "hello world");
The handler function should respond to two types of SNMP requests: the GET request and the GETNEXT request. The type of request is determined by calling the getMode method on the request_info object passed as the third parameter to the handler function. If the request is a GET request, the caller will expect the handler to set the value of the request object, depending on the OID of the request. If the request is a GETNEXT request, the caller will also expect the handler to set the OID of the request to the next available OID in the tree. This is illustrated in the following code example:
When getMode returns MODE_GET, the handler analyzes the value of the getOID call on the request object. The value of the request is set to either string_value if the OID ends in ".1.0", or set to integer_value if the OID ends in ".1.1". If the getMode returns MODE_GETNEXT, the handler determines whether the OID of the request is ".1.0", and then sets the OID and value for ".1.1". If the request is higher on the tree than ".1.0", the OID and value for ".1.0" is set. This in effect returns the "next" value in the tree so that a program like snmpwalk can traverse the tree without prior knowledge of the structure.
The type of the variable is set using constants from NetSNMP::ASN. See the perldoc for NetSNMP::ASN for a full list of available constants.
The entire code listing for this example Perl plug-in is as follows:
To test the plug-in, copy the above program to /usr/share/snmp/hello_world.pl and add the following line to the /etc/snmp/snmpd.conf configuration file:
perl do "/usr/share/snmp/hello_world.pl"
perl do "/usr/share/snmp/hello_world.pl"
The SNMP Agent Daemon will need to be restarted to load the new Perl plug-in. Once it has been restarted, an snmpwalk should return the new data:
snmpwalk localhost NET-SNMP-MIB::netSnmpPlaypen
~]$ snmpwalk localhost NET-SNMP-MIB::netSnmpPlaypen
NET-SNMP-MIB::netSnmpPlaypen.1.0 = STRING: "hello world"
NET-SNMP-MIB::netSnmpPlaypen.1.1 = INTEGER: 8675309
The snmpget should also be used to exercise the other mode of the handler:
snmpget localhost \
  NET-SNMP-MIB::netSnmpPlaypen.1.0 \
  NET-SNMP-MIB::netSnmpPlaypen.1.1
~]$ snmpget localhost \
  NET-SNMP-MIB::netSnmpPlaypen.1.0 \
  NET-SNMP-MIB::netSnmpPlaypen.1.1
NET-SNMP-MIB::netSnmpPlaypen.1.0 = STRING: "hello world"
NET-SNMP-MIB::netSnmpPlaypen.1.1 = INTEGER: 867530921.8. Additional Resources
To learn more about gathering system information, see the following resources.
21.8.1. Installed Documentation
-
lscpu(1) — The manual page for the
lscpucommand. -
lsusb(8) — The manual page for the
lsusbcommand. -
findmnt(8) — The manual page for the
findmntcommand. -
blkid(8) — The manual page for the
blkidcommand. -
lsblk(8) — The manual page for the
lsblkcommand. -
ps(1) — The manual page for the
pscommand. -
top(1) — The manual page for the
topcommand. -
free(1) — The manual page for the
freecommand. -
df(1) — The manual page for the
dfcommand. -
du(1) — The manual page for the
ducommand. -
lspci(8) — The manual page for the
lspcicommand. -
snmpd(8) — The manual page for the
snmpdservice. -
snmpd.conf(5) — The manual page for the
/etc/snmp/snmpd.conffile containing full documentation of available configuration directives.