Este contenido no está disponible en el idioma seleccionado.
Chapter 20. Viewing a component’s JMX statistics
Overview
The tooling collects all JMX statistics reported by Fuse components and displays them in the Properties view. This statistical information can provide significant insight into what is happening in your integration application.
JMX statistics are grouped into three categories: Properties, Processor, and Profile.
Procedure
To see a Fuse component’s statistics:
In the JMX Navigator view, locate the node for the component.
You may have to expand nodes on the tree to locate low-level components.
- Select the node of the Fuse component whose statistics you want to review.
- Open the Properties view.
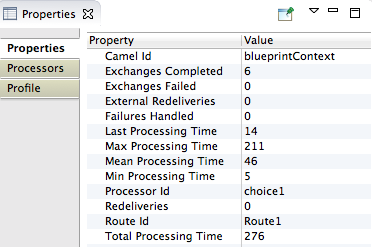
The Properties page displays the JMX properties for the selected component:
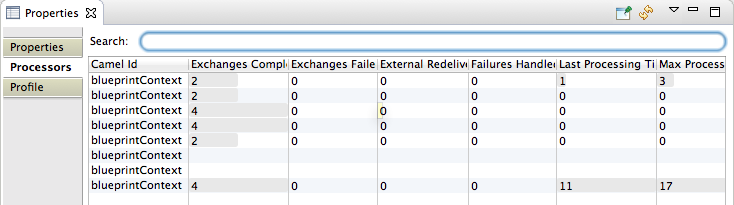
Click Processors to check exchange metrics for the selected component:
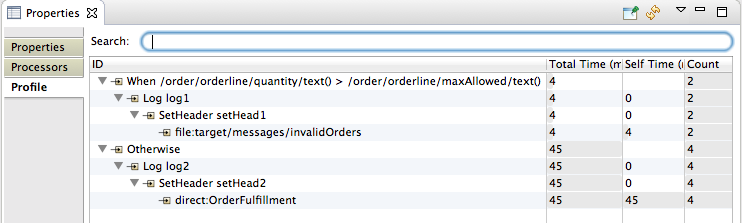
Click Profile to check message metrics for the selected node and its subnodes: