Este contenido no está disponible en el idioma seleccionado.
Chapter 14. Running the Camel Debugger
You can run the Camel debugger on locally running routing contexts.
- Remote debugging is no longer supported. For remote debugging, you must configure Jolokia and create a specific JMX connection through Jolokia.
- If your project contains Java code, you can use the standard Eclipse Java debugging tools to debug it.
You must set breakpoints in your routing context file before you can start the Camel debugger.
Procedure
- In the Project Explorer view, select the routing context file you want to debug.
Right-click the selected file to open the context menu, and then select Debug As
Local Camel Context. Fuse Tooling builds the Camel route, starts Apache Camel, starts the routing context, enables JMX, starts the route(s) in the routing context, adds the breakpoints to the nodes, and enables the Camel debugger.
The Camel debugger suspends execution of the routing context at the first breakpoint hit (received a message), and prompts you to indicate whether you want it to open the Debug perspective.
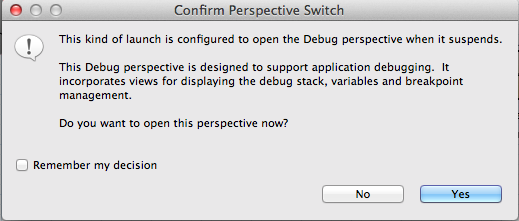
Click Yes to open the Debug perspective.
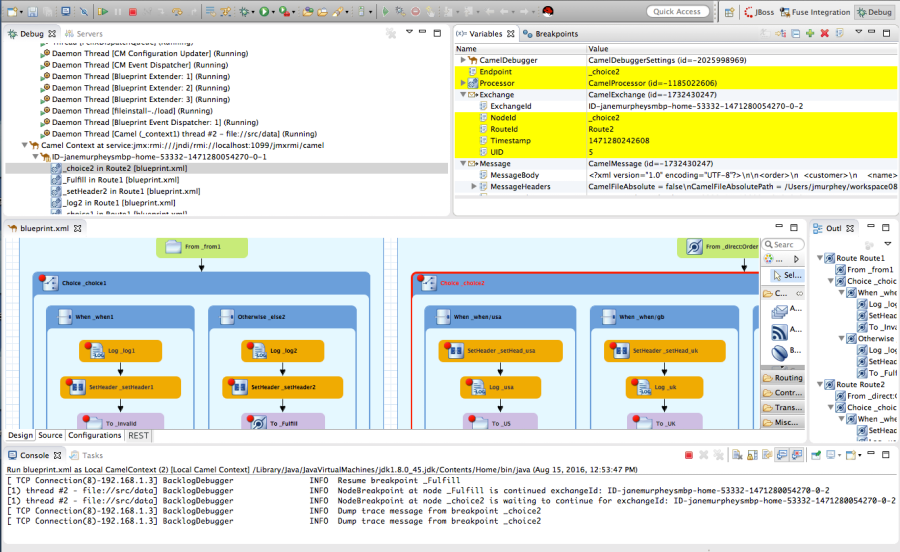
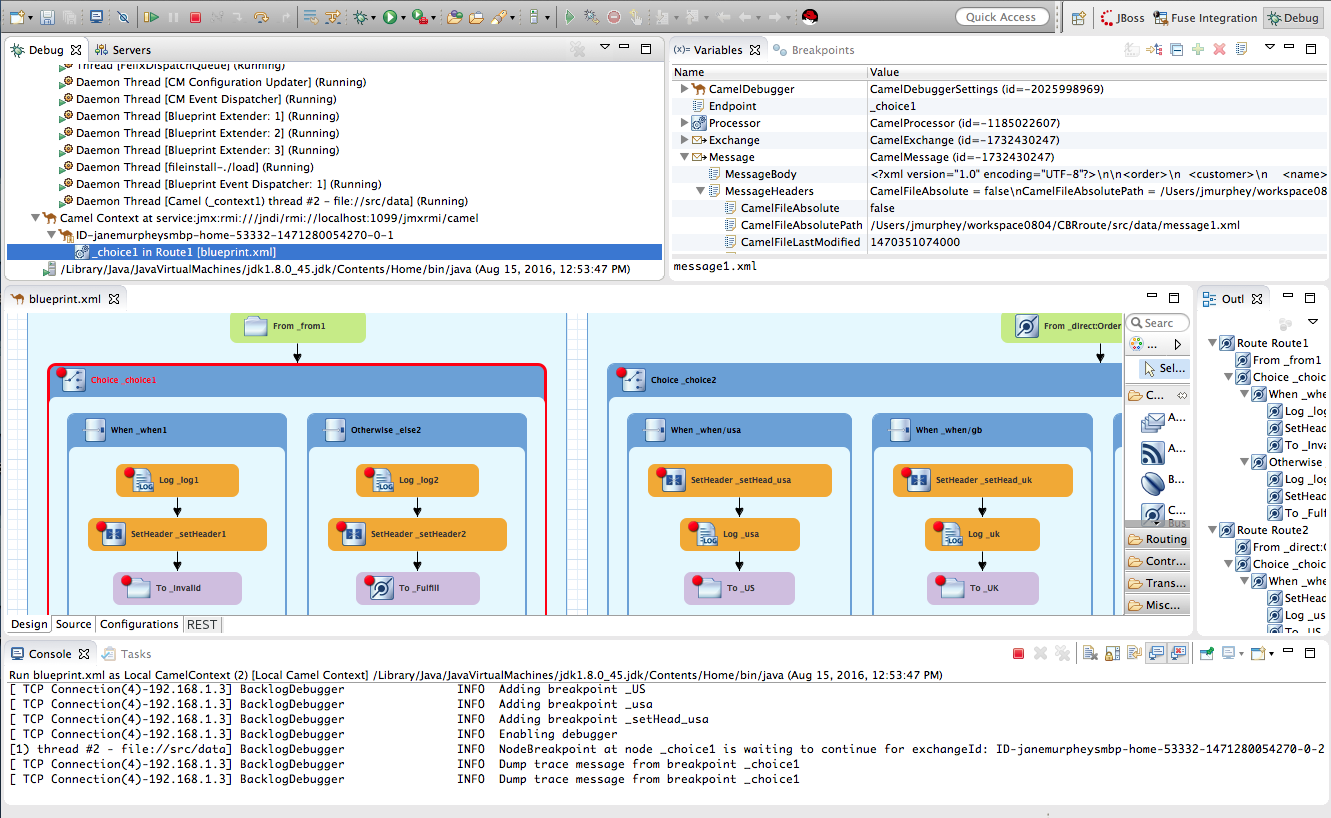
The Debug perspective opens with the routing context suspended at the first breakpoint encountered in the running routing context.
ImportantBreakpoints are held for a maximum of five minutes, after which debugging automatically resumes, moving on to the next breakpoint or to the end of the routing context.
 Note
NoteTo see the console output, open the Console view if it was not open when you switched perspectives.
NoteBy default, the Debug perspective displays the Outline view, which provides the means to switch between separate routes in a running routing context. If your routing context contains a single route, closing the Outline view frees space to expand the other views, making it easier to access and examine debugger output.
Watching message exchanges progress through the routing context
Click
 (Step Over) to jump to the next node of execution in the routing context. Click
 (Resume) to continue execution at the next active breakpoint in the routing context.