Ce contenu n'est pas disponible dans la langue sélectionnée.
Chapter 8. Monitoring Dashboard Features
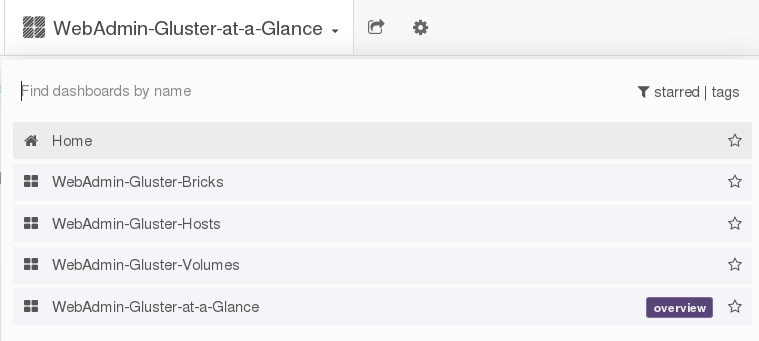
8.1. Dashboard Search
You can search the available dashboards by the dashboard name. The available filters to search a particular dashboard are starred and tags. The dashboard search functionality is accessed through the dashboard selector, located at the top of the Grafana interface.
Figure 8.1. Dashboard Search
8.2. Dashboard Time Range
The Grafana interface provides time range management of the the data being visualized. You can change the time range for a graph to view the data at different points in time
At the top right, you can access the master Dashboard time picker. It shows the currently selected time range and the refresh interval.
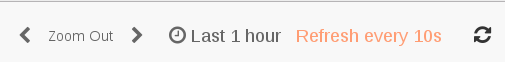
Clicking the master Dashboard time picker, toggles a menu for time range controls.
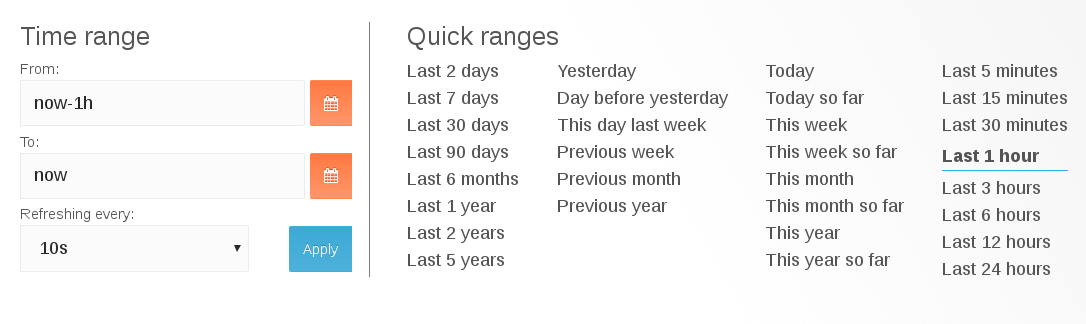
Time range
The time range filter allows to mix both explicit and relative time ranges. The explicit time range format is YYYY-MM-DD HH:MM:SS.
Quick Range
Quick ranges are preset values to choose a relative time.
Refreshing every
When enabled, auto-refresh will reload the dashboard at the specified time range.
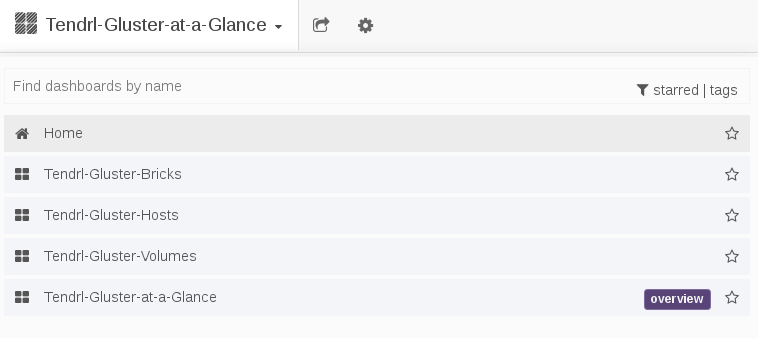
8.3. Dashboard Sharing
The Dashboard Selector is the primary navigation tool to move between different dashboards.
Figure 8.2. Dashboard Selector