Questo contenuto non è disponibile nella lingua selezionata.
Chapter 24. System Monitoring Tools
In order to configure the system, system administrators often need to determine the amount of free memory, how much free disk space is available, how the hard drive is partitioned, or what processes are running.
24.1. Viewing System Processes
Copia collegamentoCollegamento copiato negli appunti!
24.1.1. Using the ps Command
Copia collegamentoCollegamento copiato negli appunti!
The
ps command allows you to display information about running processes. It produces a static list, that is, a snapshot of what is running when you execute the command. If you want a constantly updated list of running processes, use the top command or the System Monitor application instead.
To list all processes that are currently running on the system including processes owned by other users, type the following at a shell prompt:
ps ax
For each listed process, the
ps ax command displays the process ID (PID), the terminal that is associated with it (TTY), the current status (STAT), the cumulated CPU time (TIME), and the name of the executable file (COMMAND). For example:
~]$ ps ax
  PID TTY      STAT   TIME COMMAND
    1 ?        Ss     0:01 /sbin/init
    2 ?        S      0:00 [kthreadd]
    3 ?        S      0:00 [migration/0]
    4 ?        S      0:00 [ksoftirqd/0]
    5 ?        S      0:00 [migration/0]
    6 ?        S      0:00 [watchdog/0]
[output truncated]
To display the owner alongside each process, use the following command:
ps aux
Apart from the information provided by the
ps ax command, ps aux displays the effective user name of the process owner (USER), the percentage of the CPU (%CPU) and memory (%MEM) usage, the virtual memory size in kilobytes (VSZ), the non-swapped physical memory size in kilobytes (RSS), and the time or date the process was started. For instance:
~]$ ps aux
USER       PID %CPU %MEM    VSZ   RSS TTY      STAT START   TIME COMMAND
root         1  0.0  0.1  19404   832 ?        Ss   Mar02   0:01 /sbin/init
root         2  0.0  0.0      0     0 ?        S    Mar02   0:00 [kthreadd]
root         3  0.0  0.0      0     0 ?        S    Mar02   0:00 [migration/0]
root         4  0.0  0.0      0     0 ?        S    Mar02   0:00 [ksoftirqd/0]
root         5  0.0  0.0      0     0 ?        S    Mar02   0:00 [migration/0]
root         6  0.0  0.0      0     0 ?        R    Mar02   0:00 [watchdog/0]
[output truncated]
You can also use the
ps command in a combination with grep to see if a particular process is running. For example, to determine if Emacs is running, type:
~]$ ps ax | grep emacs
12056 pts/3    S+     0:00 emacs
12060 pts/2    S+     0:00 grep --color=auto emacs
For a complete list of available command-line options, see the ps(1) manual page.
24.1.2. Using the top Command
Copia collegamentoCollegamento copiato negli appunti!
The
top command displays a real-time list of processes that are running on the system. It also displays additional information about the system uptime, current CPU and memory usage, or total number of running processes, and allows you to perform actions such as sorting the list or killing a process.
To run the
top command, type the following at a shell prompt:
top
For each listed process, the
top command displays the process ID (PID), the effective user name of the process owner (USER), the priority (PR), the nice value (NI), the amount of virtual memory the process uses (VIRT), the amount of non-swapped physical memory the process uses (RES), the amount of shared memory the process uses (SHR), the process status field S), the percentage of the CPU (%CPU) and memory (%MEM) usage, the accumulated CPU time (TIME+), and the name of the executable file (COMMAND). For example:
~]$ top
top - 02:19:11 up 4 days, 10:37,  5 users,  load average: 0.07, 0.13, 0.09
Tasks: 160 total,   1 running, 159 sleeping,   0 stopped,   0 zombie
Cpu(s): 10.7%us,  1.0%sy,  0.0%ni, 88.3%id,  0.0%wa,  0.0%hi,  0.0%si,  0.0%st
Mem:    760752k total,   644360k used,   116392k free,     3988k buffers
Swap:  1540088k total,    76648k used,  1463440k free,   196832k cached

  PID USER      PR  NI  VIRT  RES  SHR S %CPU %MEM    TIME+  COMMAND
14401 jhradile  20   0  313m  10m 5732 S  5.6  1.4   6:27.29 gnome-system-mo
 1764 root      20   0  133m  23m 4756 S  5.3  3.2   6:32.66 Xorg
13865 jhradile  20   0 1625m 177m 6628 S  0.7 23.8   0:57.26 java
   20 root      20   0     0    0    0 S  0.3  0.0   4:44.39 ata/0
 2085 root      20   0 40396  348  276 S  0.3  0.0   1:57.13 udisks-daemon
    1 root      20   0 19404  832  604 S  0.0  0.1   0:01.21 init
    2 root      20   0     0    0    0 S  0.0  0.0   0:00.01 kthreadd
    3 root      RT   0     0    0    0 S  0.0  0.0   0:00.00 migration/0
    4 root      20   0     0    0    0 S  0.0  0.0   0:00.02 ksoftirqd/0
    5 root      RT   0     0    0    0 S  0.0  0.0   0:00.00 migration/0
    6 root      RT   0     0    0    0 S  0.0  0.0   0:00.00 watchdog/0
    7 root      20   0     0    0    0 S  0.0  0.0   0:01.00 events/0
    8 root      20   0     0    0    0 S  0.0  0.0   0:00.00 cpuset
    9 root      20   0     0    0    0 S  0.0  0.0   0:00.00 khelper
   10 root      20   0     0    0    0 S  0.0  0.0   0:00.00 netns
   11 root      20   0     0    0    0 S  0.0  0.0   0:00.00 async/mgr
   12 root      20   0     0    0    0 S  0.0  0.0   0:00.00 pm
[output truncated]
Table 24.1, “Interactive top commands” contains useful interactive commands that you can use with
top. For more information, see the top(1) manual page.
| Command | Description |
|---|---|
| Enter, Space | Immediately refreshes the display. |
| h, ? | Displays a help screen. |
| k | Kills a process. You are prompted for the process ID and the signal to send to it. |
| n | Changes the number of displayed processes. You are prompted to enter the number. |
| u | Sorts the list by user. |
| M | Sorts the list by memory usage. |
| P | Sorts the list by CPU usage. |
| q | Terminates the utility and returns to the shell prompt. |
24.1.3. Using the System Monitor Tool
Copia collegamentoCollegamento copiato negli appunti!
The Processes tab of the System Monitor tool allows you to view, search for, change the priority of, and kill processes from the graphical user interface. To install the tool, issue the following command as
root:
~]# yum install gnome-system-monitor
To start the System Monitor tool, either select
gnome-system-monitor at a shell prompt. Then click the Processes tab to view the list of running processes.
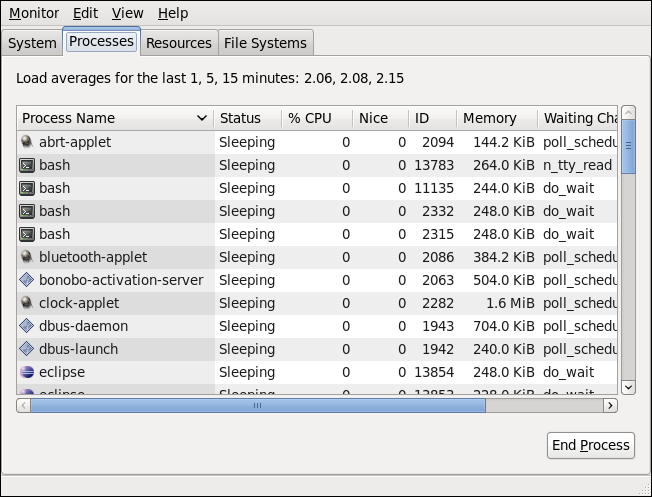
Figure 24.1. System Monitor — Processes
For each listed process, the System Monitor tool displays its name (Process Name), current status (Status), percentage of the CPU usage (% CPU), nice value (Nice), process ID (ID), memory usage (Memory), the channel the process is waiting in (Waiting Channel), and additional details about the session (Session). To sort the information by a specific column in ascending order, click the name of that column. Click the name of the column again to toggle the sort between ascending and descending order.
By default, the System Monitor tool displays a list of processes that are owned by the current user. Selecting various options from the menu allows you to:
- view only active processes,
- view all processes,
- view your processes,
- view process dependencies,
- view a memory map of a selected process,
- view the files opened by a selected process, and
- refresh the list of processes.
Additionally, various options in the menu allows you to:
- stop a process,
- continue running a stopped process,
- end a process,
- kill a process,
- change the priority of a selected process, and
- edit the System Monitor preferences, such as the refresh interval for the list of processes, or what information to show.
You can also end a process by selecting it from the list and clicking the button.