이 콘텐츠는 선택한 언어로 제공되지 않습니다.
1.7. Customizing the Dashboard
The Dashboard is configurable. It is composed of individual portlets, and these portlets can be rearranged or independently refreshed through the icon menu displayed on each portlet. There can even be multiple Dashboards, with different portlets, which can be used to give different and specific views into JBoss ON and its resources.
Note
Dashboards are configured per user, not globally.
1.7.1. Editing Portlets
링크 복사링크가 클립보드에 복사되었습니다!
To move portlets within the Dashboard layout, use the arrows in the portlet tool bar. To get rid of a portlet in a current, click the minimize icon on the far left to collapse it or click the X icon on the far right to delete the portlet from the Dashboard entirely. Some types of portlet allow customization, which can be accessed by clicking the wrench icon.
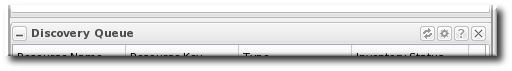
Figure 1.17. Portlet Icons
1.7.2. Adding and Editing Dashboards
링크 복사링크가 클립보드에 복사되었습니다!
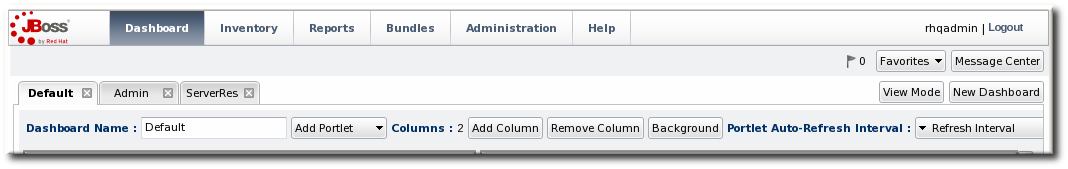
The Dashboard page can actually contain multiple Dashboards, each with different portlets, column layouts, and refresh intervals. This makes it possible to get a logical grouping of information for a very fast assessment of the state of resources in JBoss ON. When multiple Dashboards are configured, they are displayed as tabs in the UI.
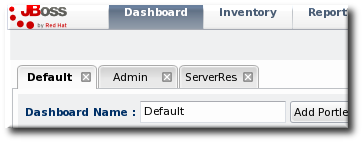
Figure 1.18. Tabbed Dashboards
To add a new Dashboard:
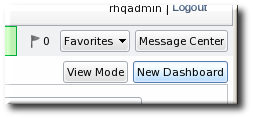
- Click the button in the far right of the main Dashboard.
Note
The process of editing and adding Dashboards is very similar. The only difference is that to edit a Dashboard, you click the button. - The new Dashboard opens in the edit mode. Enter a name for the new Dashboard.
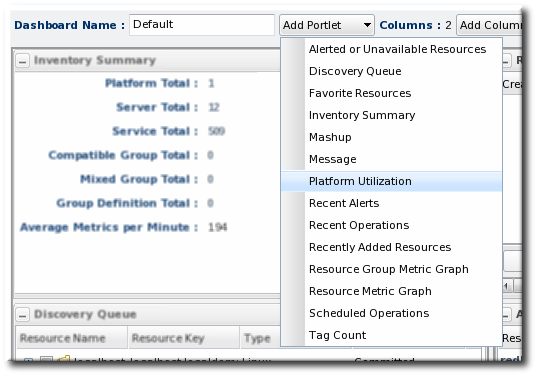
- Add the desired portlets to the Dashboard. If necessary, change the number of columns to fit the number of portlets.