이 콘텐츠는 선택한 언어로 제공되지 않습니다.
Chapter 24. Storing Monitoring Data
JBoss ON monitoring information reveals both current measurements and historical trends and averages. JBoss ON stores data in a kind of cascade, where raw data are aggregated and compressed on a schedule. This preserves the trends of data without inflating the size of the monitoring data. Data are handled like this:
- Raw metrics are collected every few minutes and are aggregated in a rolling average in one-hour windows to produce minimum, average, and maximum values.
- One-hour values are combined and averaged in six-hour periods.
- Six-hour periods are combined and aggregated into 24-hour (1 day) windows.
24.1. Changing Storage Lengths for Monitoring Data
링크 복사링크가 클립보드에 복사되었습니다!
24.1.1. Default Storage Lengths
링크 복사링크가 클립보드에 복사되었습니다!
The raw measurements, one-hour periods, and six-hour periods are preserved in the JBoss ON database for a predefined lengths of time.
| Data | Length of Time | Configurable or Hardcoded | SQL or NoSQL Database |
|---|---|---|---|
| Raw measurements | 7 days | Hardcoded | NoSQL |
| 1-hour aggregate | 14 days | Hardcoded | NoSQL |
| 6-hour aggregate | 31 days | Hardcoded | NoSQL |
| 24-hour aggregate | 365 days | Hardcoded | NoSQL |
| Traits | 365 days | Configurable | SQL |
| Availability data | 365 days | Configurable | SQL |
| Events data | 14 days | Configurable | SQL |
| Response-time metrics | 31 days | Configurable | SQL |
Note
The storage size of raw metrics can grow very quickly. Be careful when adjusting the storage time of raw metrics to account for the size of your database and the number and frequency of all metrics collected across your inventory.
If you need to store raw data for long periods, consider exporting the raw data from the database and archiving it separately.
Note
All collected metrics are stored in a NoSQL database, in a specified storage node. Additionl nodes can be added on other systems, in a cluster, as the number of resources or collected metrics increases.
All other monitoring data (as well as all other data stored and used by JBoss ON) are stored in the backend SQL database.
24.1.2. Changing the Storage Times for Different Monitoring Data
링크 복사링크가 클립보드에 복사되었습니다!
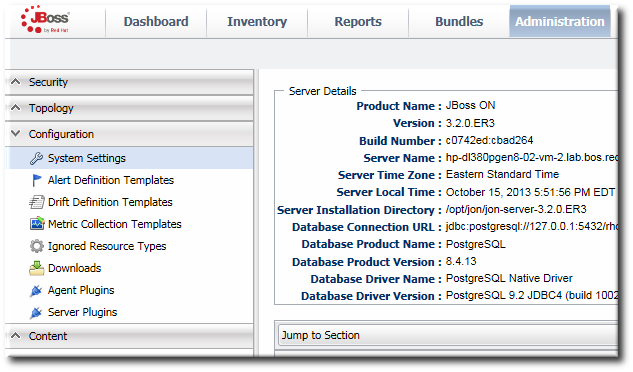
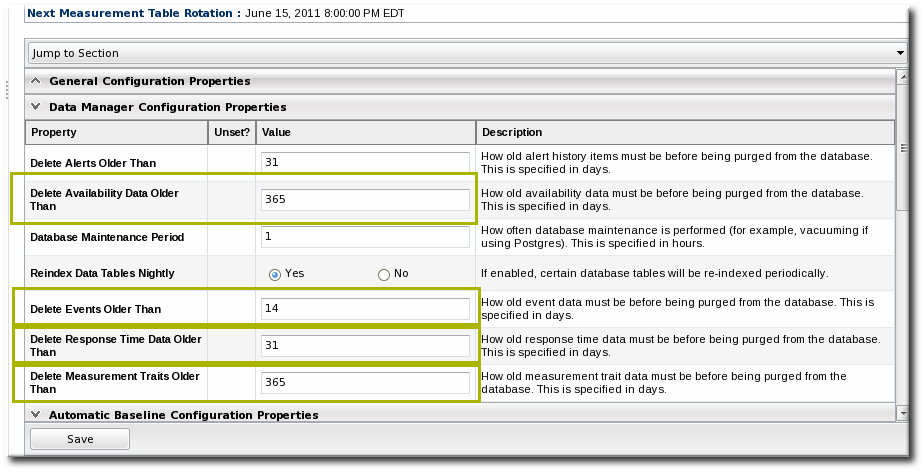
- In the System Configuration menu, select the item.
- Scroll to the Data Manager Configuration Properties section.
- Change the storage times for the different types of monitoring data.There are four settings that relate directly to storing monitoring data:
- Response time data for web servers and EJB resources. This is kept for one month (31 days) by default.
- Events information, meaning all of the log files generated by the agent for the resource. The default storage time for event logs is two weeks.
- Traits for resources. The default time is one year (365 days).
- Availability information. The default time is one year (365 days).