이 콘텐츠는 선택한 언어로 제공되지 않습니다.
Chapter 17. Monitoring Reports and Data
Monitoring information in JBoss ON is easy to find. Resources and groups both have dashboards which contain snapshot views of the most recent metrics values and a series of graphs and tables which break down the different metrics values over a given time window.
Monitoring information is available in several areas:
- Dashboards with metrics portlets for individual resources, compatible groups, and the main dashboard
- Timelines, which aggregate all collected data, events, configuration, operations, and other changes for a resource
- Resource-level charts and tables for metrics
- A suspect metrics report for outlier or out-of-bounds metrics
17.1. Dashboards and Portlets
링크 복사링크가 클립보드에 복사되었습니다!
The fastest place to view monitoring and alerting information is through one of the JBoss ON dashboards. The dashboards collect almost all monitoring, event, alert, and operations data into a single location.
Each data set is collected in a separate box or portlets displayed in the dashboard. These portlets can be edited, added, and removed from the dashboards; this is covered in the Admin: Initial Setup for the Resource Inventory, Groups, and Users.
17.1.1. Resource-Level Dashboards
링크 복사링크가 클립보드에 복사되었습니다!
The Summary > Activity tab for an individual resource (or compatible group) shows a snapshot of all recent actions on the resource, such as new packages and content, inventory changes, events, operations, and alerts. There is also a portlet that displays the most recent detected value of the primary metrics for the resource.
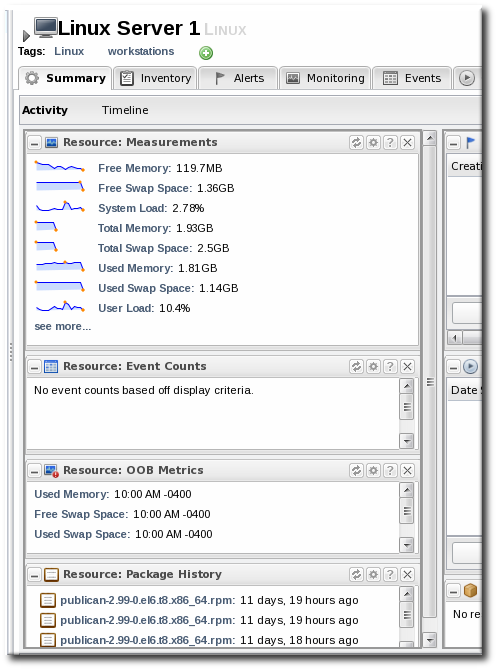
Figure 17.1. Resource Summary Tab
Click on any metric name in the Resource: Measurements portlet opens the metric graph. Clicking the see more... link opens the metrics charts in the Monitoring tab.
17.1.2. Main Dashboard
링크 복사링크가 클립보드에 복사되었습니다!
The Dashboard main page has a global view of all resources in the inventory. By default, this page shows only alerting data and unavailable resources. However, the Dashboard can be customized to show different portlets of monitoring data. Additionally, the main page can have multiple dashboards, so a dashboard can be created to look at different metrics for the same resource, the same metrics for different resources, or a combination of relevant metrics for a group of related resources — whatever you design.
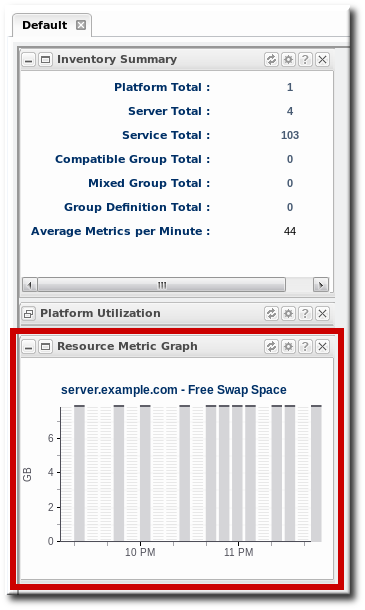
The main dashboard has several types of portlets specifically for monitoring data:
- Platform Utilization, which shows free memory, CPU usage, and other metrics related to platform performance.
- Alerted or Unavailable Resources, which shows a list of the most recent five resources which have issued an alert or been reported as down
- A graph for a specific metric for a compatible group
- A graph for a specific metric for a resource
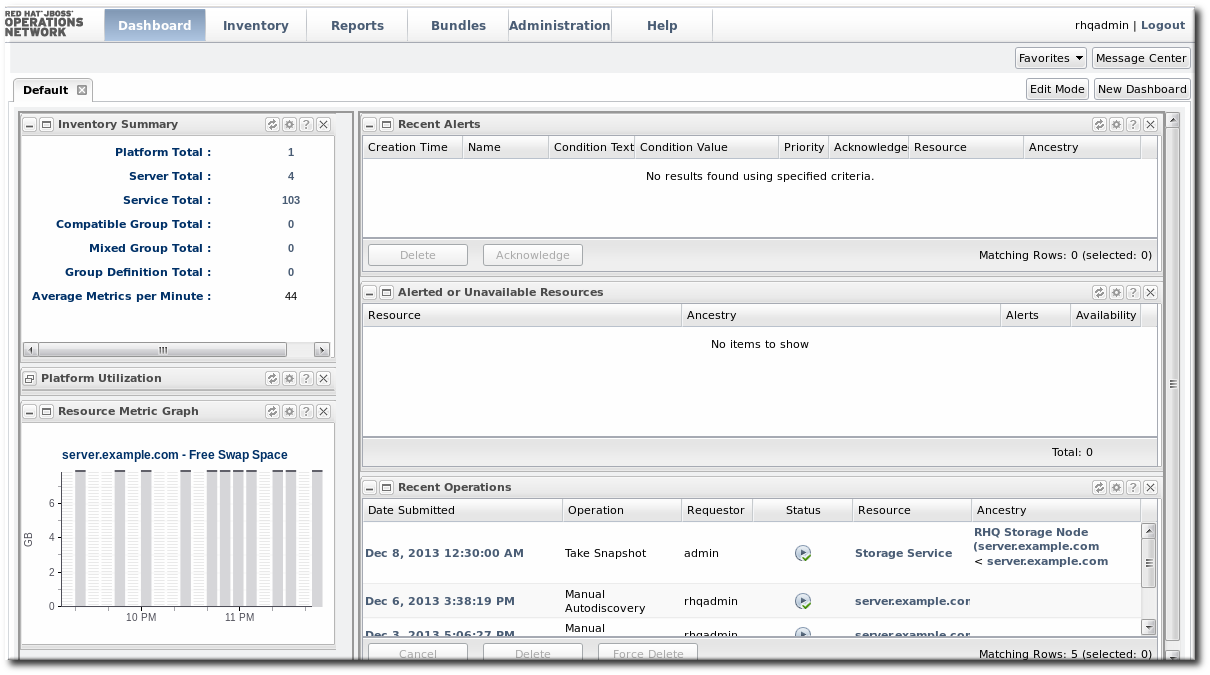
Figure 17.2. Dashboard Portlets with MOnitoring Data
17.1.3. Adding Monitoring Metrics to the Main Dashboard
링크 복사링크가 클립보드에 복사되었습니다!
Charts for a specific metric for a resource can be added to the Dashboard. This makes it easier to see the current state of important readings for common or critical resources immediately, without having to configure alerts or check resource entries.
- Click the Inventory tab in the top menu.
- Select the resource type in the Resources menu table on the left, and then browse or search for the resource.
- In the resource hierarchy on the left, right-click the resource name.
- Scroll down to the menu item, select the metric from the list, and then select the dashboard to add the chart to.


A chart for that specific metric on that specific resource is automatically added to the Dashboard that was selected.