이 콘텐츠는 선택한 언어로 제공되지 않습니다.
Chapter 4. Configuring action log storage for Elasticsearch
By default, the past three months of usage logs are stored in the Red Hat Quay database and exposed via the web UI on organization and repository levels. Appropriate administrative privileges are required to see log entries. For deployments with a large amount of logged operations, you can now store the usage logs in Elasticsearch instead of the Red Hat Quay database backend. To do this, you need to provide your own Elasticsearch stack, as it is not included with Red Hat Quay as a customizable component.
Enabling Elasticsearch logging can be done during Red Hat Quay deployment or post-deployment using the Red Hat Quay Config Tool. The resulting configuration is stored in the config.yaml file. Once configured, usage log access continues to be provided the same way, via the web UI for repositories and organizations.
Here’s how to configure action log storage to change it from the default Red Hat Quay database to use Elasticsearch:
- Obtain an Elasticsearch account.
- Open the Red Hat Quay Config Tool (either during or after Red Hat Quay deployment).
Scroll to the Action Log Storage Configuration setting and select Elasticsearch instead of Database. The following figure shows the Elasticsearch settings that appear:
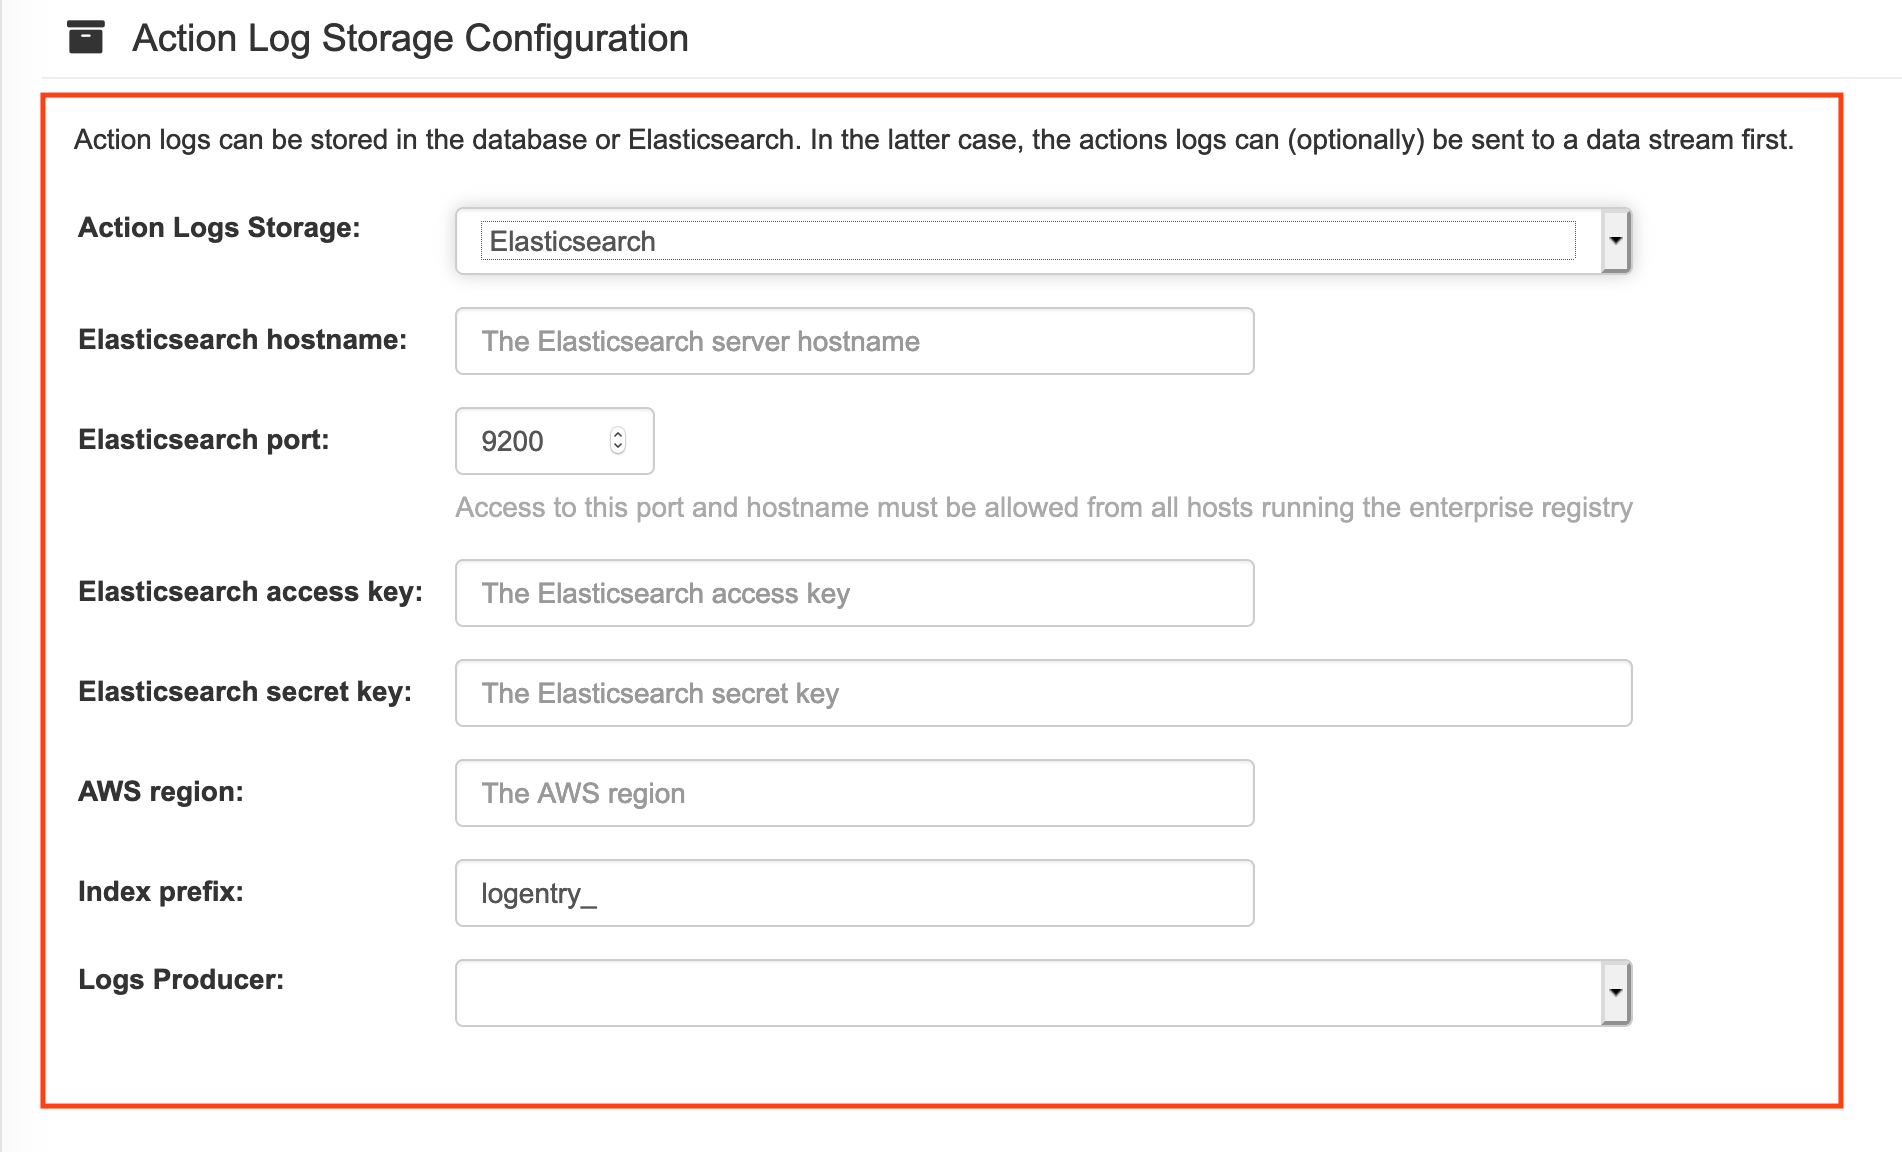
Fill in the following information for your Elasticsearch instance:
- Elasticsearch hostname: The hostname or IP address of the system providing the Elasticsearch service.
- Elasticsearch port: The port number providing the Elasticsearch service on the host you just entered. Note that the port must be accessible from all systems running the Red Hat Quay registry. The default is TCP port 9200.
- Elasticsearch access key: The access key needed to gain access to the Elastic search service, if required.
- Elasticsearch secret key: The secret key needed to gain access to the Elastic search service, if required.
- AWS region: If you are running on AWS, set the AWS region (otherwise, leave it blank).
- Index prefix: Choose a prefix to attach to log entries.
Logs Producer: Choose either Elasticsearch (default) or Kinesis to direct logs to an intermediate Kinesis stream on AWS. You need to set up your own pipeline to send logs from Kinesis to Elasticsearch (for example, Logstash). The following figure shows additional fields you would need to fill in for Kinesis:
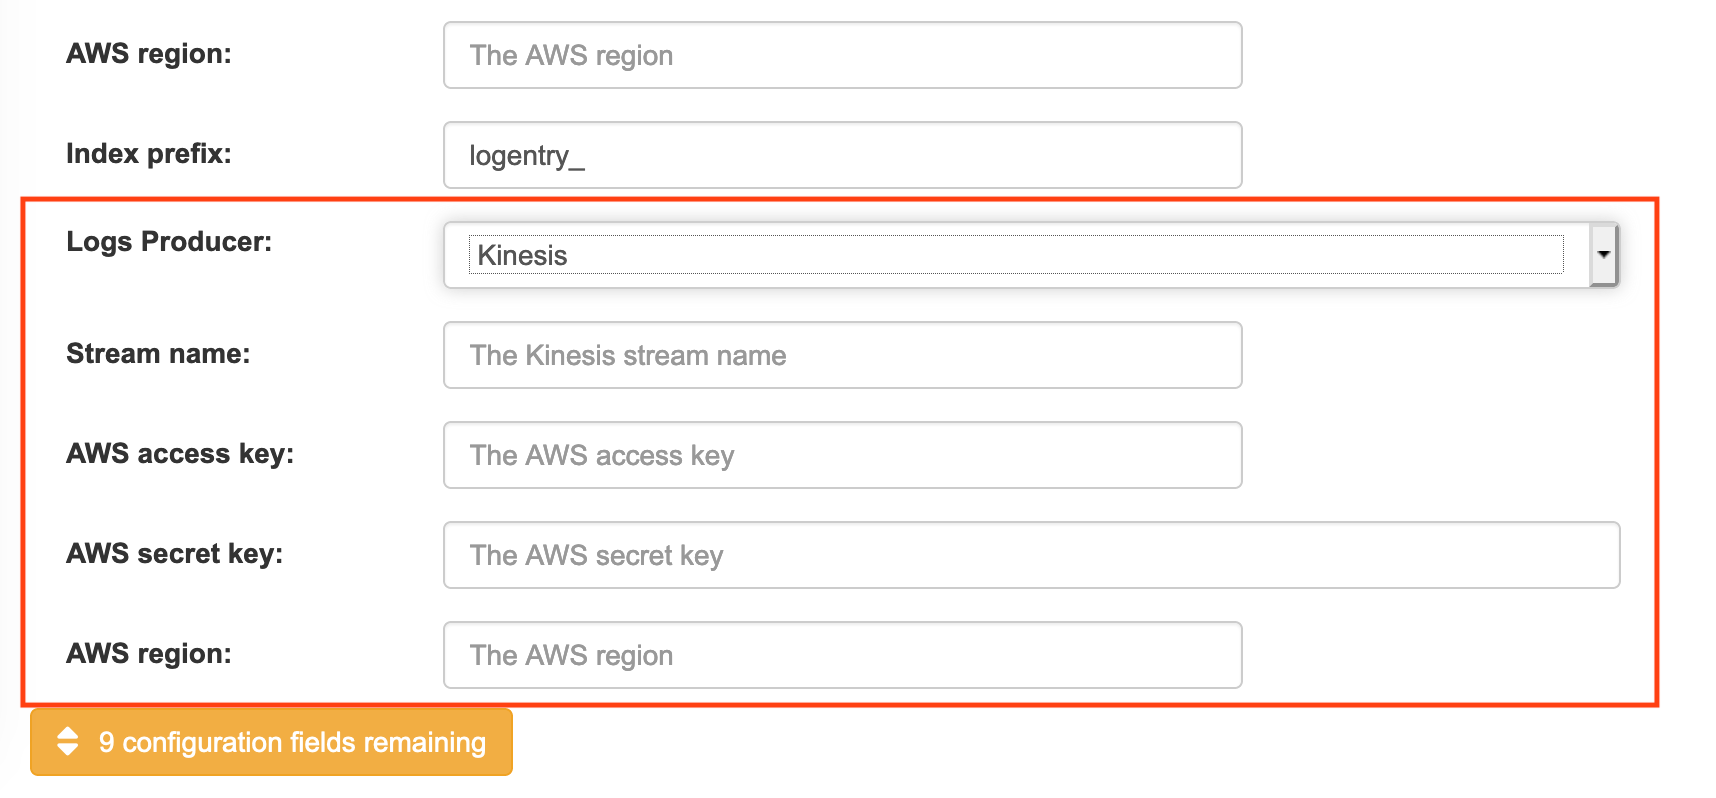
If you chose Elasticsearch as the Logs Producer, no further configuration is needed. If you chose Kinesis, fill in the following:
- Stream name: The name of the Kinesis stream.
- AWS access key: The name of the AWS access key needed to gain access to the Kinesis stream, if required.
- AWS secret key: The name of the AWS secret key needed to gain access to the Kinesis stream, if required.
- AWS region: The AWS region.
- When you are done, save the configuration. The Config Tool checks your settings. If there is a problem connecting to the Elasticsearch or Kinesis services, you will see an error and have the opportunity to continue editing. Otherwise, logging will begin to be directed to your Elasticsearch configuration after the cluster restarts with the new configuration.