Dieser Inhalt ist in der von Ihnen ausgewählten Sprache nicht verfügbar.
9.3. Setting up Monitoring for EAP 6 Resources
The Runtime tab in the JBoss EAP 6 management console gives an current snapshot of the state of managed servers and some common subsystems. The emphasis of the EAP 6 console is on quick access to current information. This makes it easy to perform immediate management tasks.
JBoss ON focuses on long-term performance tracking, not just an immediate view. The EAP 6 agent plug-in for JBoss ON allows administrators to monitor additional metrics for resources, to track historical measurements and establish performance baselines, and to view how the resource status has changed (gone up or down) and how long it has been in different states.
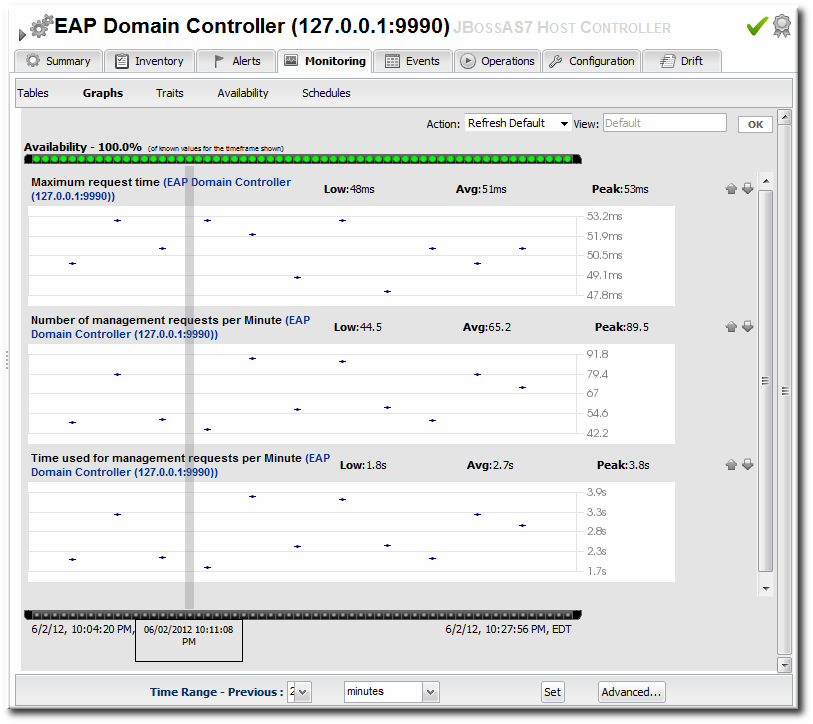
Figure 9.4. Monitoring Graph
Monitoring information is displayed in graphs and in tables on the Monitoring tab. The Summary tab has visually different line graphs rendered in the monitoring portlet.
Note
For more information on monitoring concepts and configuration, see "Setting up Monitoring, Alerts, and Operations".
9.3.1. Enabling Additional Metrics
Link kopierenLink in die Zwischenablage kopiert!
JBoss ON supports all of the metrics for JBoss EAP 6 resources that are displayed in the EAP 6 console, along with many additional metrics.
The metrics enabled by default in JBoss ON, however, may not be the same ones that are viewable in the EAP 6 console. For example, for data sources, the EAP 6 console displays the available connections count, active connections count, and max used connections count. In JBoss ON, the default metrics collected are the maximum and minimum pool size settings, the max wait time, and the number of time outs per minute.
Note
A complete list of possible metrics for each resource type is given in the Resource Reference.
Metric collection can be enabled or disabled for a resource. Administrators can also reset how often JBoss ON checks a given metric (the collection interval).
Note
Checking less important metrics less frequently can improve platform and agent performance, while still recording that information for reference or event correlation.
To change the monitoring configuration for a resource:
- Click the Inventory tab in the top menu.
- Select Servers - Top Level Imports in the Resources menu table on the left. Then select the JBoss EAP 6 server and navigate to the resource to edit.
- Click the Monitoring tab on the resource entry.
- Click the Schedules subtab.
- To enable a metric:
- Select the metric row. Multiple metrics can be selected using the Ctrl key.
- Click the button at the bottom of the page.
- To change a collection interval for a metric:
- Select the metric row. Multiple metrics can be selected using the Ctrl key, if they will all be changed to the same frequency.

- Enter the desired collection period in the Collection Interval field, with the appropriate time unit (seconds, minutes, or hours).
- Click Set.
Note
Changing the collection interval for a disabled metric automatically enables the metric.
9.3.2. Availability Monitoring
Link kopierenLink in die Zwischenablage kopiert!
Availability is a (mostly) straightforward measurement that shows whether a resource is running and minimally responsive. If the agent can connect to the resource, that resource is available.
This is how availability is displayed in the EAP 6 console for a resource: it shows whether a resource is currently running.
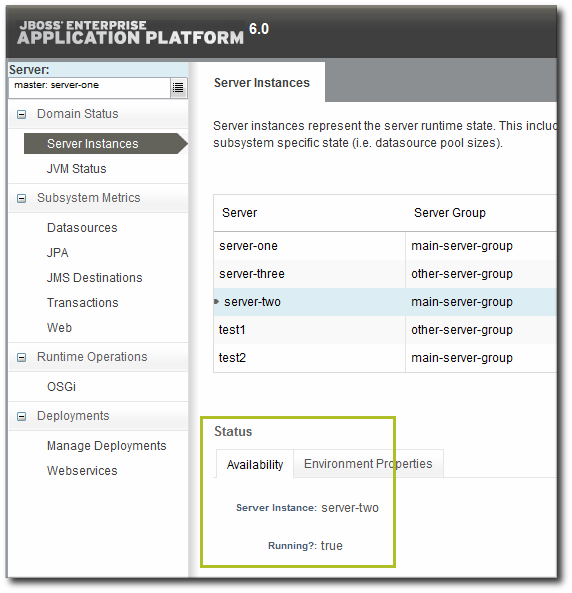
Figure 9.5. Availability in the EAP 6 Console
As a measure of performance, availability can acquire more shades of gray than simply is it running. For example, has a resource been cycling off and on repeatedly? Does it stay offline for long periods before it recovers? Is a resource unavailable because of its own failure or is a parent resource (like the platform) unreachable, while the child is running fine? JBoss ON supports four resources states — up, down, disabled, and unknown — to try to differentiate between real states for the resources.
Availability is covered in much more detail in the availability chapter of "Setting up Monitoring, Alerts, and Operations".
Along with showing the current status of a resource, JBoss ON also shows how long the resource has been in that state and what percentage of time the resource spends in different states. This allows JBoss ON to calculate a few different trends per resource:
- Its overall uptime percentage
- Total time spent in different states (up, down, or disabled)
- The total number of failures (times it has gone down)
- The mean time between failures, which is essentially the mean time that a resource is up and available
- The mean time to recovery, which is the mean amount of time that it takes a resource to come back up after a failure
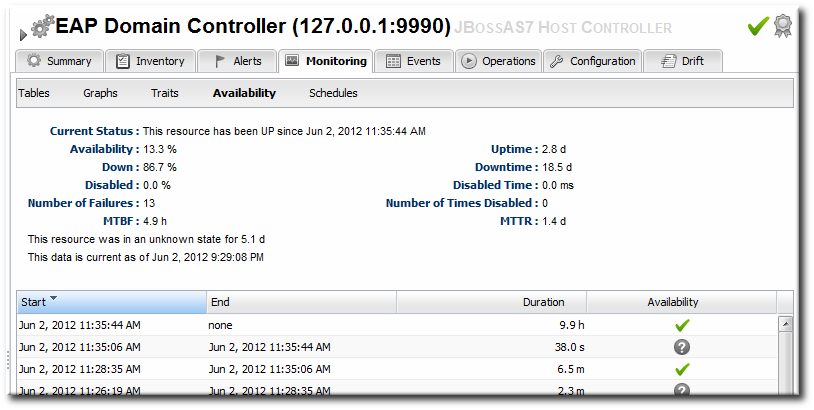
Figure 9.6. Availability in JBoss ON
Availability is collected on a schedule, much like a monitoring metric. Controlling the frequency of availability checks can establish a resource priority.
Note
Servers, such as domain controllers and managed servers, have availability checks that run every minute. This can help catch resource cycling in unstable servers. Services, like datasources and JMS queues, are checked for availability every 10 minutes.
The frequency of availability checks can have an impact on agent performance, particularly for servers structured like EAP 6, with a large number of child resources. Every resource is checked for availability, by default. There may be some low-level child resource, like OSGi classes or EJBs, that really do not require an independent availability check. In that case, availability checks can be disabled for the child. The agent automatically applies the parent state to the child; if the parent is running, than the child is assumed to be running. This is called backfilling.