Chapter 8. Process Simulation
Process simulation allows users to simulate a business process based on the simulation parameters and get a statistical analysis of the process models over time in form of graphs. This helps to optimize pre and post execution of a process, minimizing the risk of change in business processes, performance forecast, and promote improvements in performance, quality and resource utilization of a process.
The simulation process runs in the simulation engine extension, which relies on the possible execution paths rather than process data. On simulation, the engine generates events for every simulated activity, which are stored in the simulation repository.
Simulation input data include general data about the process simulation as well as simulation data for individual process elements. Process elements executed by the engine automatically do not require any input data; however, the process itself, Human Tasks, Intermediate Event, and flows leaving a split Gateway, need such data: further information on simulation data is available in Chapter 34, Process and the subsequent sections.
8.1. Path Finder
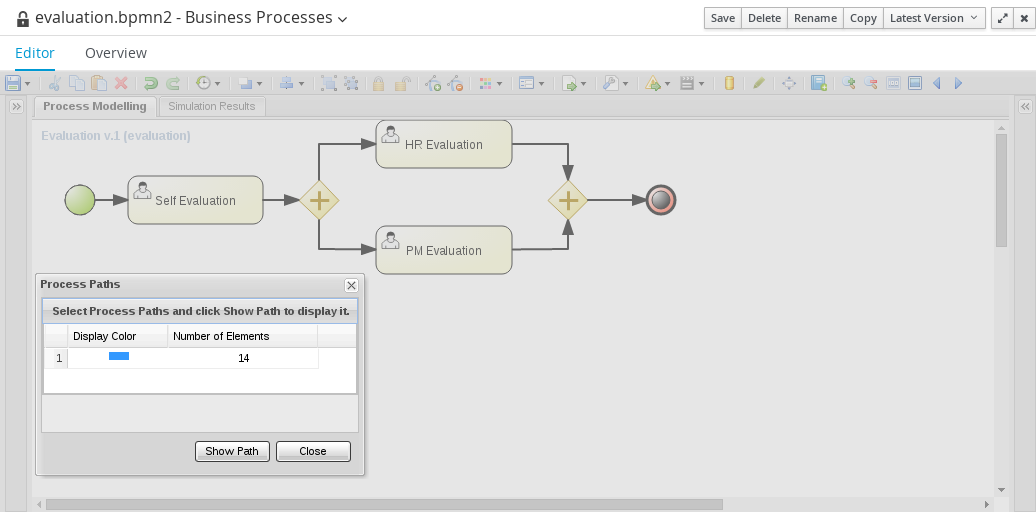
Path Finder is a tool that allows you to identify all possible paths a process execution can take.
Before you identify the paths, make sure your process is valid. Then, on the toolbar, click Process Simulation (
 ) and Process Paths.
Note that when you click this button only core process paths are searched for. In order to view Embedded or Event subprocess paths, you have to click on the subprocess, making sure that it is selected and then click the Process Path button. This will focus on paths that are specific to this subprocess.
A dialog with data on individual path appears: to visualize any of the identified paths, select the path in the dialog and click Show Path.
Figure 8.1. Process Paths
8.2. Simulating Processes
8.2.1. Defining Simulation Data on Elements
To run a process simulation, the input simulation data must be specified for the process and each of its elements. To specify the simulation data:
- In Business Central, open the process in the Process Editor.
- Open the Properties panel on the right.
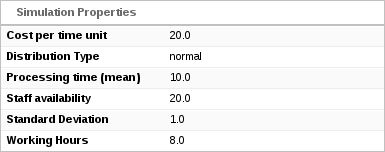
For each individual element and the process itself, specify the simulation data in the Simulation Properties section.
Figure 8.2. Simulation Properties
- Save the process.
For more information about the simulation data for individual process elements, see Appendix C, Simulation Data.
8.2.2. Running Process Simulations
- Open the corresponding process in the Process Editor.
-
Click

 Run Process Simulation.
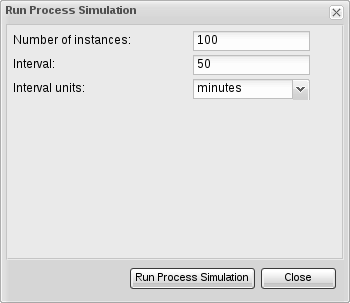
In the Run Process Simulation dialog window, define the simulation session details:
- Number of instances: the number of process instances the simulation creates and triggers.
- Interval: the interval between individual process instantiations.
- Interval units: the time unit in which you defined the interval.
Figure 8.3. Run Process Simulation Dialog Window
- Click Run Process Simulation.
After the simulation starts, the Simulation Results tab opens. The tab includes the Simulation Graphs panel where you can select the process, different process elements, or paths to view the corresponding results. For more information, see Section 8.2.3, “Examining Simulation Results”.
If the simulation fails, a notification message is displayed. To prevent the simulation from failing, make sure the process is valid and not too complex. You can split complex processes into multiple processes. See the following examples of complex processes:
- Processes that contain a complex series of XOR and AND gateways.
- Processes that contain a loop where one instance of the loop is not finished before a new instance starts.
8.2.3. Examining Simulation Results
In the Simulation Graphs panel that opens after you run a simulation, the results are divided into the following categories:
| Category | Contains |
|---|---|
| Process | Graphs with general results of a process simulation. |
| Process Elements | Simulation results for individual elements. Each Human Task element in this category contains the following graphs:
|
| Paths | Simulation results of the paths used during the simulation. |
8.2.3.1. Switching Between Graph Types
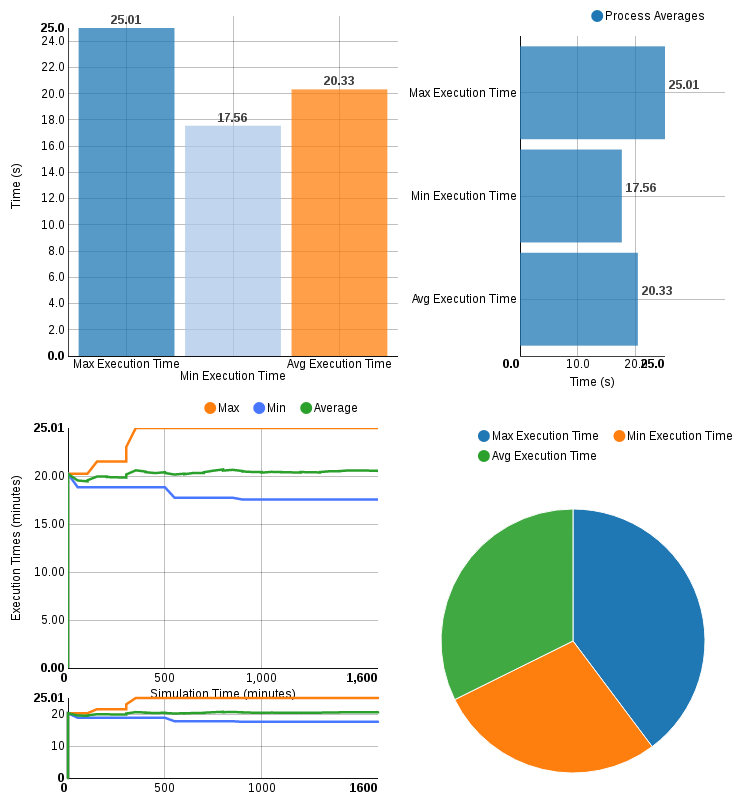
To change the type of the displayed graphs, click the corresponding icon at the upper right hand corner of the Process Editor. The available graph types are:
-
 Bar Chart
-
 Horizontal Bar Chart
-
 Pie Chart
-
 Table
Table
-
 Timeline
-
 Line Chart
Figure 8.4. Different Types of Simulation Graphs
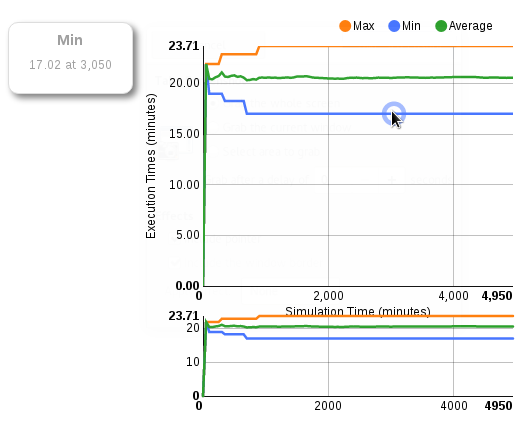
In line charts, point to a particular place on a line to view the value of the item at the given time.
Figure 8.5. Line Chart
8.2.3.2. Filtering in Graphs
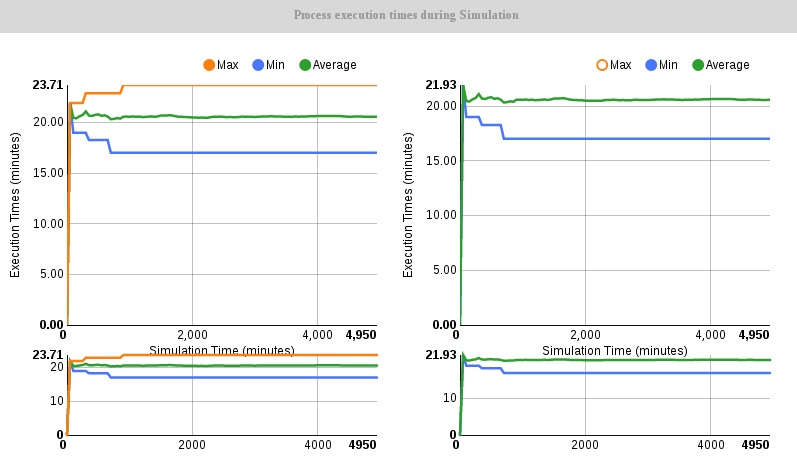
To filter the displayed data in a chart, click the corresponding coloured radio button in the chart legend.
Figure 8.6. Filtering the Maximum Value
8.2.3.3. Viewing Graph Timeline
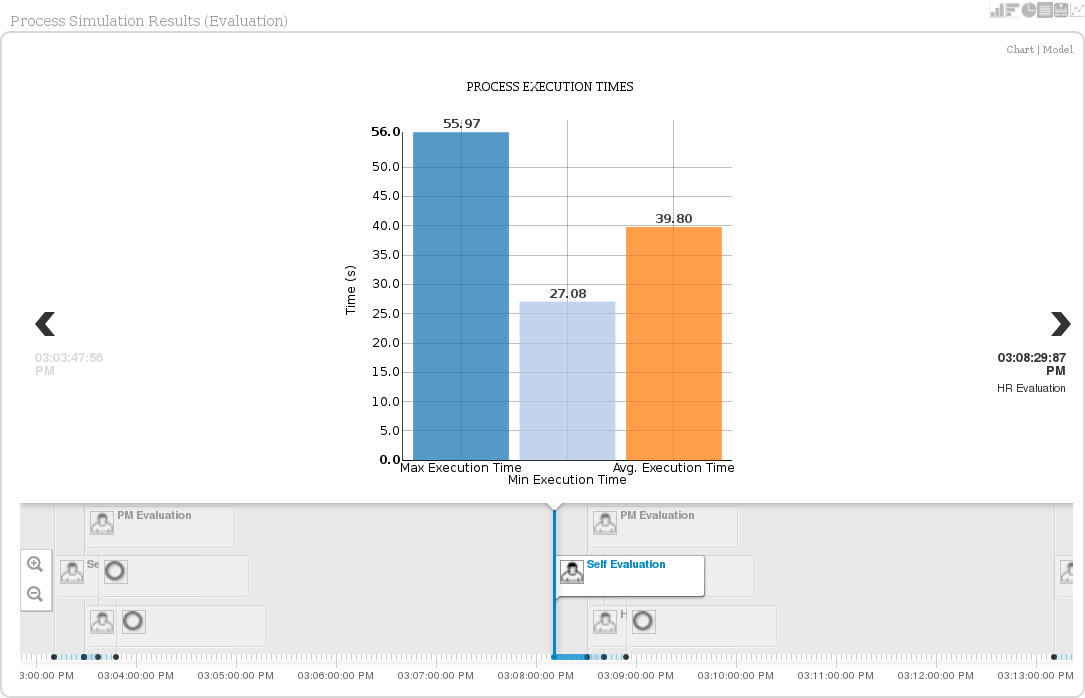
The timeline feature enables you to view the graph in a particular stage during simulation execution. Every event is included in the timeline as a new status.
To activate the feature, click
 at the upper right hand corner. After the timeline opens, you can click the arrows on the right and left from the chart to move through the timeline. The data for the particular moment are applied to the chart instantly.
Figure 8.7. Process Simulation Timeline

