Chapter 2. Dashboard
The Dashboard provides an overview of the Red Hat Virtualization system status by displaying a summary of Red Hat Virtualization's resources and utilization. This summary can alert the user to a problem and allows them to analyse the problem area.
The information in the dashboard is updated every 15 minutes by default from the Data Warehouse, and every 15 seconds by default by the Manager API, or whenever the Dashboard is refreshed. The Dashboard is refreshed when the user changes back from another tab or when manually refreshed. The Dashboard does not automatically refresh. The inventory card information is supplied by the Manager API and the utilization information is supplied by the Data Warehouse. The Dashboard is implemented as a UI plugin component, which is automatically installed and upgraded alongside the Manager.
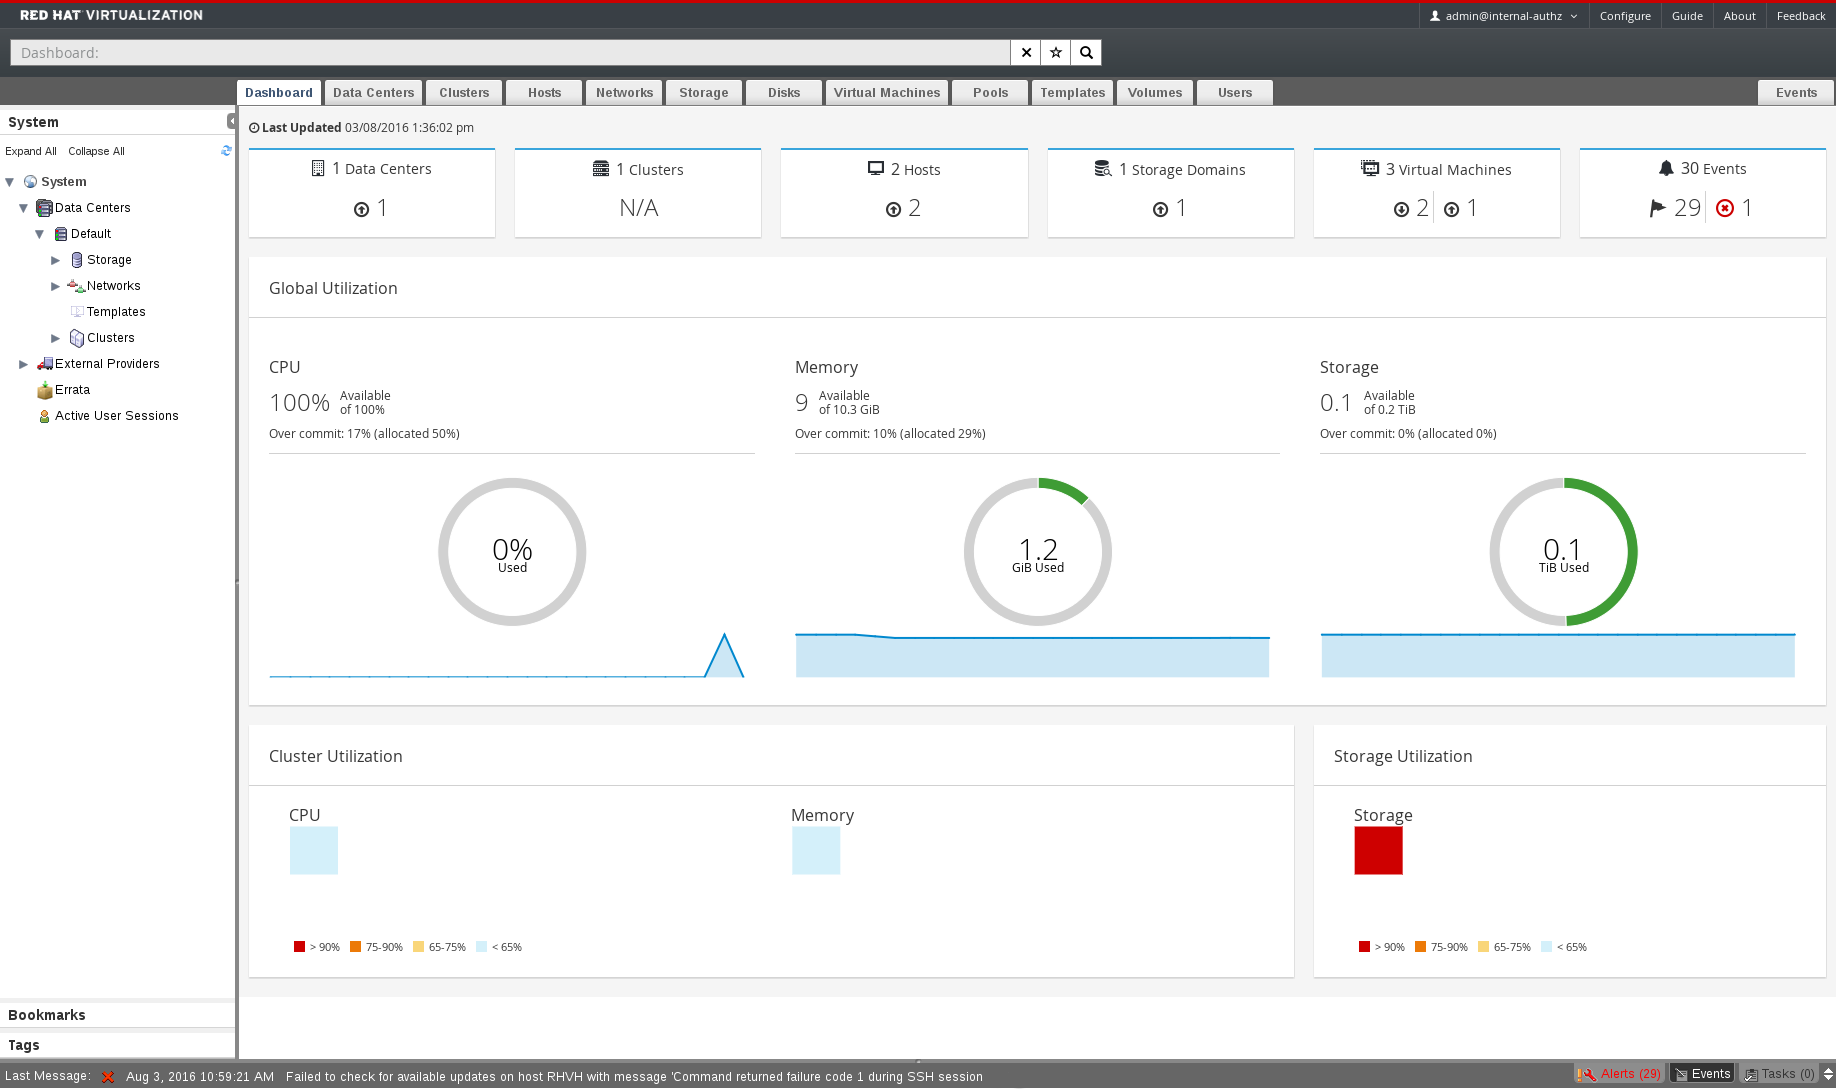
Figure 2.1. The Dashboard
2.1. Prerequisites
Copy linkLink copied to clipboard!
The Dashboard requires that the Data Warehouse is installed and configured. For more information on installing and configuring the Data Warehouse see Installing and Configuring Data Warehouse in the Data Warehouse Guide