Este contenido no está disponible en el idioma seleccionado.
Chapter 4. Viewing application composition using the Topology view
The Topology view in the Developer perspective of the web console provides a visual representation of all the applications within a project, their build status, and the components and services associated with them.
4.1. Prerequisites
To view your applications in the Topology view and interact with them, ensure that:
- You have logged in to the web console.
- You have the appropriate roles and permissions in a project to create applications and other workloads in OpenShift Container Platform.
- You have created and deployed an application on OpenShift Container Platform using the Developer perspective.
- You are in the Developer perspective.
4.2. Viewing the topology of your application
You can navigate to the Topology view using the left navigation panel in the Developer perspective. After you deploy an application, you are directed automatically to the Graph view where you can see the status of the application pods, quickly access the application on a public URL, access the source code to modify it, and see the status of your last build. You can zoom in and out to see more details for a particular application.
The Topology view provides you the option to monitor your applications using the List view. Use the List view icon (
![]() ) to see a list of all your applications and use the Graph view icon (
) to see a list of all your applications and use the Graph view icon (
![]() ) to switch back to the graph view.
) to switch back to the graph view.
You can customize the views as required using the following:
- Use the Find by name field to find the required components. Search results may appear outside of the visible area; click Fit to Screen from the lower-left toolbar to resize the Topology view to show all components.
Use the Display Options drop-down list to configure the Topology view of the various application groupings. The options are available depending on the types of components deployed in the project:
Mode (Connectivity or Consumption)
- Connectivity: Select to show all the connections between the different nodes in the topology.
- Consumption: Select to show the resource consumption for all nodes in the topology.
Expand group
- Virtual Machines: Toggle to show or hide the virtual machines.
- Application Groupings: Clear to condense the application groups into cards with an overview of an application group and alerts associated with it.
- Helm Releases: Clear to condense the components deployed as Helm Release into cards with an overview of a given release.
- Knative Services: Clear to condense the Knative Service components into cards with an overview of a given component.
- Operator Groupings: Clear to condense the components deployed with an Operator into cards with an overview of the given group.
Show elements based on Pod Count or Labels
- Pod Count: Select to show the number of pods of a component in the component icon.
- Labels: Toggle to show or hide the component labels.
The Topology view also provides you the Export application option to download your application in the ZIP file format. You can then import the downloaded application to another project or cluster. For more details, see Exporting an application to another project or cluster in the Additional resources section.
4.3. Interacting with applications and components
The Topology view in the Developer perspective of the web console provides the following options to interact with applications and components:
-
Click Open URL (
 ) to see your application exposed by the route on a public URL.
Click Edit Source code to access your source code and modify it.
NoteThis feature is available only when you create applications using the From Git, From Catalog, and the From Dockerfile options.
-
Hover your cursor over the lower left icon on the pod to see the name of the latest build and its status. The status of the application build is indicated as New (
 ), Pending (
 ), Running (
 ), Completed (
 ), Failed (
 ), and Canceled (
 ).
).
The status or phase of the pod is indicated by different colors and tooltips as:
-
Running (
 ): The pod is bound to a node and all of the containers are created. At least one container is still running or is in the process of starting or restarting.
-
Not Ready (
 ): The pods which are running multiple containers, not all containers are ready.
-
Warning(
 ): Containers in pods are being terminated, however termination did not succeed. Some containers may be other states.
-
Failed(
 ): All containers in the pod terminated but least one container has terminated in failure. That is, the container either exited with non-zero status or was terminated by the system.
-
Pending(
 ): The pod is accepted by the Kubernetes cluster, but one or more of the containers has not been set up and made ready to run. This includes time a pod spends waiting to be scheduled as well as the time spent downloading container images over the network.
-
Succeeded(
 ): All containers in the pod terminated successfully and will not be restarted.
-
Terminating(
 ): When a pod is being deleted, it is shown as Terminating by some kubectl commands. Terminating status is not one of the pod phases. A pod is granted a graceful termination period, which defaults to 30 seconds.
-
Unknown(
 ): The state of the pod could not be obtained. This phase typically occurs due to an error in communicating with the node where the pod should be running.
-
Running (
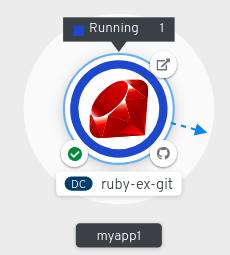
After you create an application and an image is deployed, the status is shown as Pending. After the application is built, it is displayed as Running.
Figure 4.1. Application topology

The application resource name is appended with indicators for the different types of resource objects as follows:
-
CJ:
CronJob -
D:
Deployment -
DC:
DeploymentConfig -
DS:
DaemonSet -
J:
Job -
P:
Pod -
SS:
StatefulSet  (Knative): A serverless application
Note
(Knative): A serverless application
NoteServerless applications take some time to load and display on the Graph view. When you deploy a serverless application, it first creates a service resource and then a revision. After that, it is deployed and displayed on the Graph view. If it is the only workload, you might be redirected to the Add page. After the revision is deployed, the serverless application is displayed on the Graph view.
-
CJ:
4.4. Scaling application pods and checking builds and routes
The Topology view provides the details of the deployed components in the Overview panel. You can use the Overview and Resources tabs to scale the application pods, check build status, services, and routes as follows:
Click on the component node to see the Overview panel to the right. Use the Overview tab to:
- Scale your pods using the up and down arrows to increase or decrease the number of instances of the application manually. For serverless applications, the pods are automatically scaled down to zero when idle and scaled up depending on the channel traffic.
- Check the Labels, Annotations, and Status of the application.
Click the Resources tab to:
- See the list of all the pods, view their status, access logs, and click on the pod to see the pod details.
- See the builds, their status, access logs, and start a new build if needed.
- See the services and routes used by the component.
For serverless applications, the Resources tab provides information on the revision, routes, and the configurations used for that component.
4.5. Adding components to an existing project
Procedure
-
Click Add to Project (
 ) next to left navigation pane or press Ctrl+Space
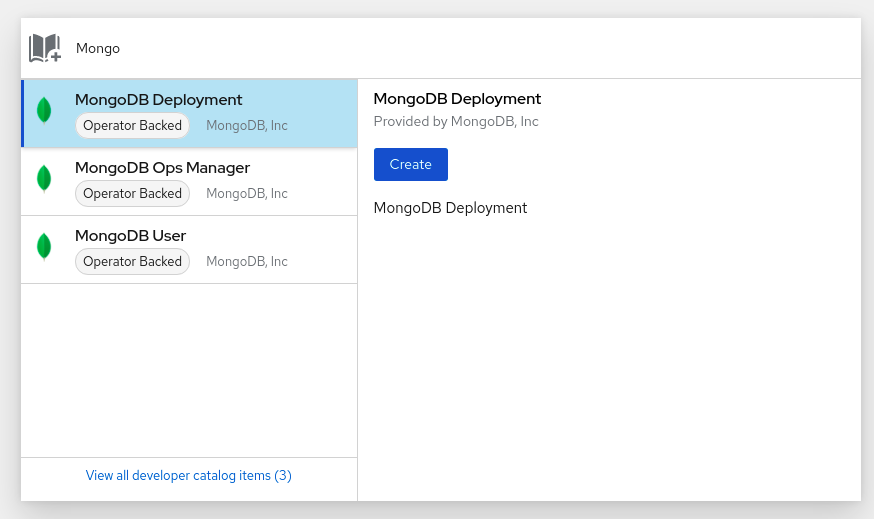
- Search for the component and select Create or press Enter to add the component to the project and see it in the topology Graph view.
Figure 4.2. Adding component via quick search

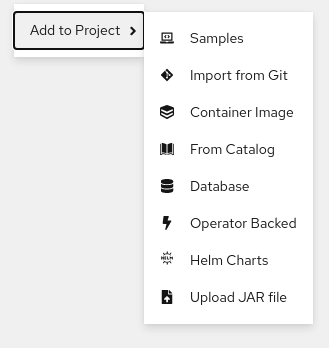
Alternatively, you can also use the Import from Git, Container Image, Database, From Catalog, Operator Backed, Helm Charts, Samples, or Upload JAR file options in the context menu by right-clicking in the topology Graph view to add a component to your project.
Figure 4.3. Context menu to add services

4.6. Grouping multiple components within an application
You can use the +Add view to add multiple components or services to your project and use the topology Graph view to group applications and resources within an application group.
Prerequisites
- You have created and deployed minimum two or more components on OpenShift Container Platform using the Developer perspective.
Procedure
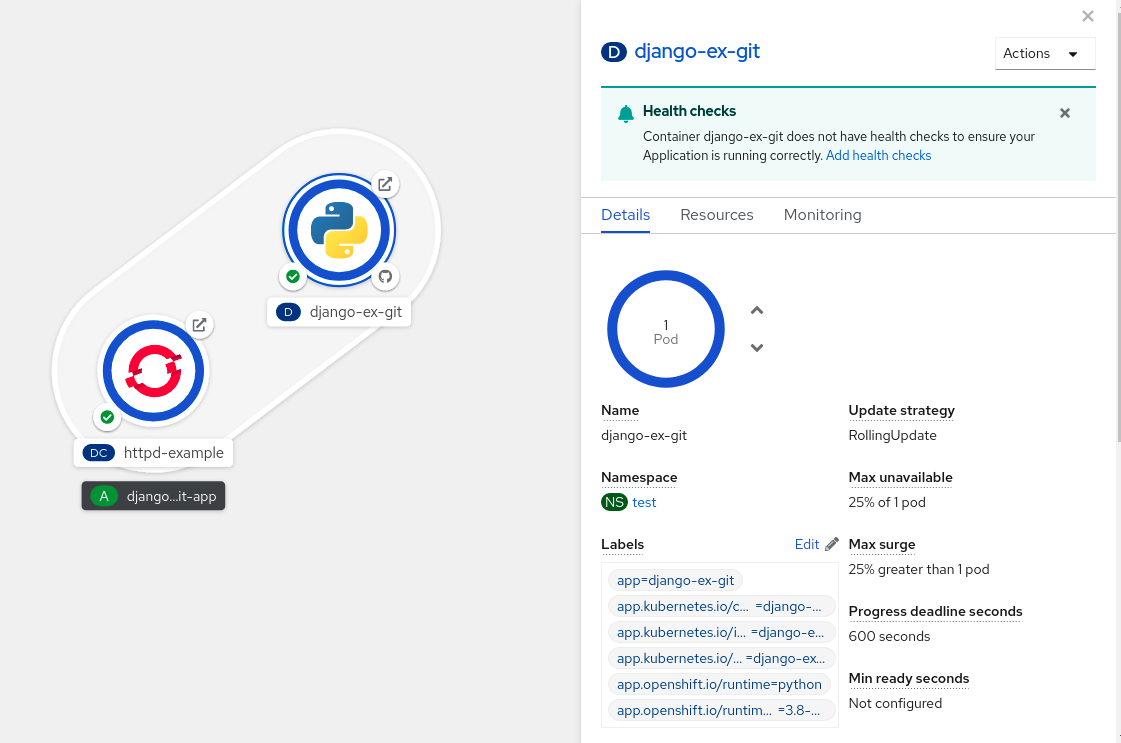
To add a service to the existing application group, press Shift+ drag it to the existing application group. Dragging a component and adding it to an application group adds the required labels to the component.
Figure 4.4. Application grouping

Alternatively, you can also add the component to an application as follows:
- Click the service pod to see the Overview panel to the right.
- Click the Actions drop-down menu and select Edit Application Grouping.
- In the Edit Application Grouping dialog box, click the Application drop-down list, and select an appropriate application group.
- Click Save to add the service to the application group.
You can remove a component from an application group by selecting the component and using Shift+ drag to drag it out of the application group.
4.7. Adding services to your application
To add a service to your application use the +Add actions using the context menu in the topology Graph view.
In addition to the context menu, you can add services by using the sidebar or hovering and dragging the dangling arrow from the application group.
Procedure
Right-click an application group in the topology Graph view to display the context menu.
Figure 4.5. Add resource context menu

- Use Add to Application to select a method for adding a service to the application group, such as From Git, Container Image, From Dockerfile, From Devfile, Upload JAR file, Event Source, Channel, or Broker.
- Complete the form for the method you choose and click Create. For example, to add a service based on the source code in your Git repository, choose the From Git method, fill in the Import from Git form, and click Create.
4.8. Removing services from your application
In the topology Graph view remove a service from your application using the context menu.
Procedure
- Right-click on a service in an application group in the topology Graph view to display the context menu.
Select Delete Deployment to delete the service.
Figure 4.6. Deleting deployment option

4.9. Labels and annotations used for the Topology view
The Topology view uses the following labels and annotations:
- Icon displayed in the node
-
Icons in the node are defined by looking for matching icons using the
app.openshift.io/runtimelabel, followed by theapp.kubernetes.io/namelabel. This matching is done using a predefined set of icons. - Link to the source code editor or the source
-
The
app.openshift.io/vcs-uriannotation is used to create links to the source code editor. - Node Connector
-
The
app.openshift.io/connects-toannotation is used to connect the nodes. - App grouping
-
The
app.kubernetes.io/part-of=<appname>label is used to group the applications, services, and components.
For detailed information on the labels and annotations OpenShift Container Platform applications must use, see Guidelines for labels and annotations for OpenShift applications.