このコンテンツは選択した言語では利用できません。
9.3. Viewing Storage Node Metrics and States
The storage node has a number of child resources for services related to memory, cache operations, data operations, logging, client requests, and others. Metrics which are critical for node performance, then, are spread across multiple child resources, especially the JVM memory service and the database management storage service.
The Nodes tab provides a summary of the most critical metrics collected across all node services, so it provides a good snapshot of the node performance. It also provides additional information of the node within the cluster, so it can indicate communication issues with a node that would not appear in service metrics.
To view the node metrics and states:
- Click the Administration tab in the top navigation bar.
- In the Topology area on the left, select the Storage Nodes item.

- The Nodes tab shows the number of unacknowledged alerts for each node.

Clicking on the hostname or IP address of the node opens up a details page with all of the metrics and state data, the current configuration settings, and the ports on which the node is listening.
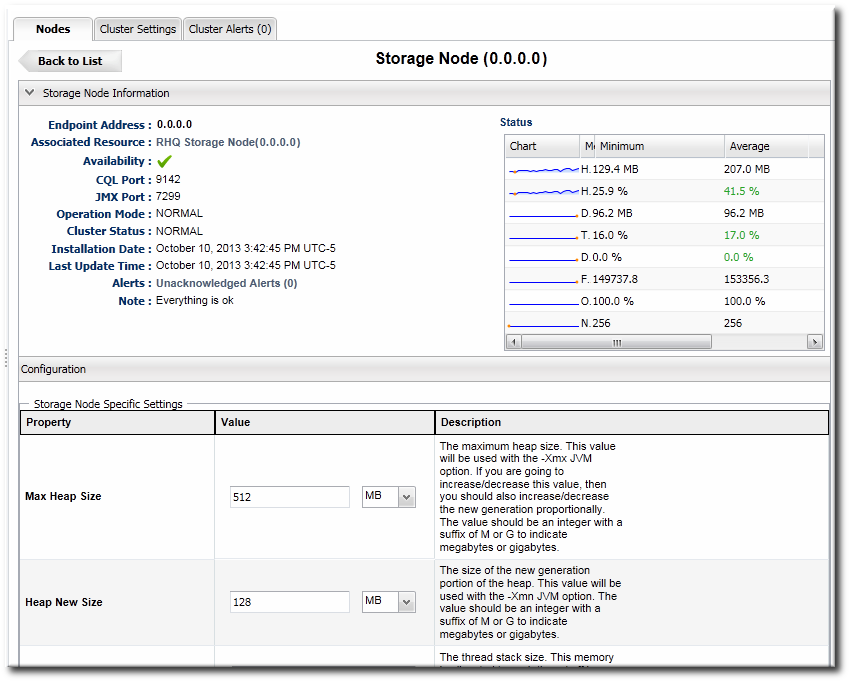
Figure 12. Storage Node Details