Este conteúdo não está disponível no idioma selecionado.
31.4. Performance Testing Procedures
The goal of this section is to construct a performance profile of the device with VDO installed. Each test should be run with and without VDO installed, so that VDO's performance can be evaluated relative to the performance of the base system.
31.4.1. Phase 1: Effects of I/O Depth, Fixed 4 KB Blocks
The goal of this test is to determine the I/O depth that produces the optimal throughput and the lowest latency for your appliance. VDO uses a 4 KB sector size rather than the traditional 512 B used on legacy storage devices. The larger sector size allows it to support higher-capacity storage, improve performance, and match the cache buffer size used by most operating systems.
- Perform four-corner testing at 4 KB I/O, and I/O depth of 1, 8, 16, 32, 64, 128, 256, 512, 1024:
- Sequential 100% reads, at fixed 4 KB *
- Sequential 100% write, at fixed 4 KB
- Random 100% reads, at fixed 4 KB *
- Random 100% write, at fixed 4 KB **
* Prefill any areas that may be read during the read test by performing a write fio job first** Re-create the VDO volume after 4 KB random write I/O runsExample shell test input stimulus (write):# for depth in 1 2 4 8 16 32 64 128 256 512 1024 2048; do fio --rw=write --bs=4096 --name=vdo --filename=/dev/mapper/vdo0 \ --ioengine=libaio --numjobs=1 --thread --norandommap --runtime=300\ --direct=1 --iodepth=$depth --scramble_buffers=1 --offset=0 \ --size=100g done
- Record throughput and latency at each data point, and then graph.
- Repeat test to complete four-corner testing:
--rw=randwrite
,--rw=read
, and--rw=randread
.
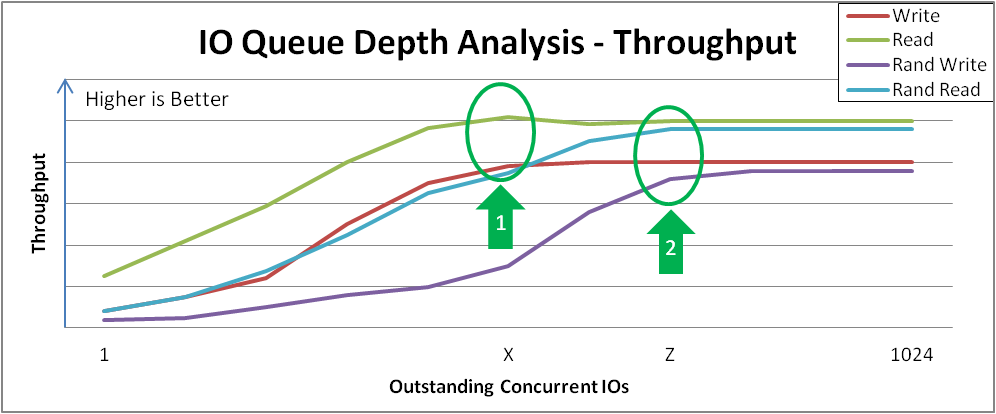
The result is a graph as shown below. Points of interest are the behavior across the range and the points of inflection where increased I/O depth proves to provide diminishing throughput gains. Likely, sequential access and random access will peak at different values, but it may be different for all types of storage configurations. In Figure 31.1, “I/O Depth Analysis” notice the "knee" in each performance curve. Marker 1 identifies the peak sequential throughput at point X, and marker 2 identifies peak random 4 KB throughput at point Z.
- This particular appliance does not benefit from sequential 4 KB I/O depth > X. Beyond that depth, there are diminishing bandwidth bandwidth gains, and average request latency will increase 1:1 for each additional I/O request.
- This particular appliance does not benefit from random 4 KB I/O depth > Z. Beyond that depth, there are diminishing bandwidth gains, and average request latency will increase 1:1 for each additional I/O request.
Figure 31.1. I/O Depth Analysis
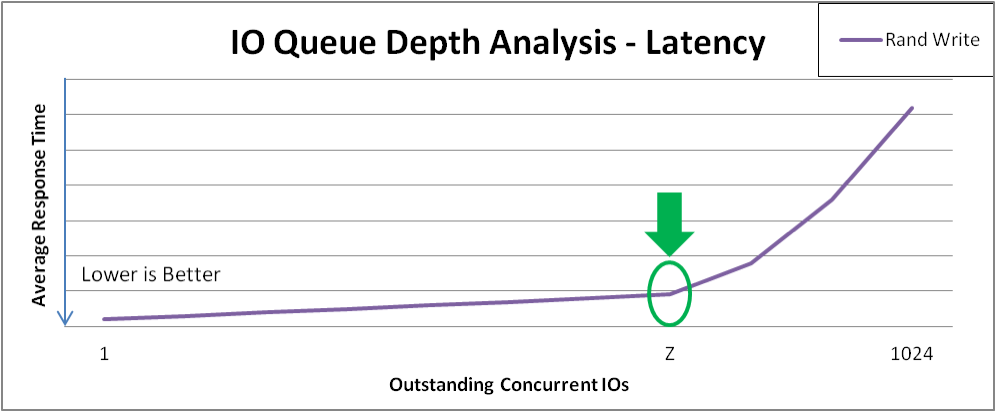
Figure 31.2, “Latency Response of Increasing I/O for Random Writes” shows an example of the random write latency after the "knee" of the curve in Figure 31.1, “I/O Depth Analysis”. Benchmarking practice should test at these points for maximum throughput that incurs the least response time penalty. As we move forward in the test plan for this example appliance, we will collect additional data with I/O depth = Z
Figure 31.2. Latency Response of Increasing I/O for Random Writes
31.4.2. Phase 2: Effects of I/O Request Size
The goal of this test is to understand the block size that produces the best performance of the system under test at the optimal I/O depth determined in the previous step.
- Perform four-corner testing at fixed I/O depth, with varied block size (powers of 2) over the range 8 KB to 1 MB. Remember to prefill any areas to be read and to recreate volumes between tests.
- Set the I/O Depth to the value determined in Section 31.4.1, “Phase 1: Effects of I/O Depth, Fixed 4 KB Blocks”.Example test input stimulus (write):
# z=[see previous step] # for iosize in 4 8 16 32 64 128 256 512 1024; do fio --rw=write --bs=$iosize\k --name=vdo --filename=/dev/mapper/vdo0 --ioengine=libaio --numjobs=1 --thread --norandommap --runtime=300 --direct=1 --iodepth=$z --scramble_buffers=1 --offset=0 --size=100g done
- Record throughput and latency at each data point, and then graph.
- Repeat test to complete four-corner testing:
--rw=randwrite
,--rw=read
, and--rw=randread
.
There are several points of interest that you may find in the results. In this example:
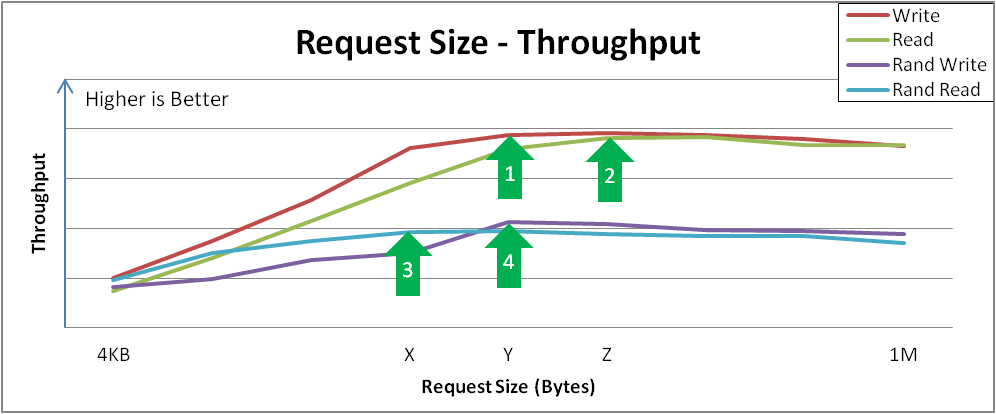
- Sequential writes reach a peak throughput at request size Y. This curve demonstrates how applications that are configurable or naturally dominated by certain request sizes may perceive performance. Larger request sizes often provide more throughput because 4 KB I/Os may benefit from merging.
- Sequential reads reach a similar peak throughput at point Z. Remember that after these peaks, overall latency before the I/O completes will increase with no additional throughput. It would be wise to tune the device to not accept I/Os larger than this size.
- Random reads achieve peak throughput at point X. Some devices may achieve near-sequential throughput rates at large request size random accesses, while others suffer more penalty when varying from purely sequential access.
- Random writes achieve peak throughput at point Y. Random writes involve the most interaction of a deduplication device, and VDO achieves high performance especially when request sizes and/or I/O depths are large.
The results from this test Figure 31.3, “Request Size vs. Throughput Analysis and Key Inflection Points” help in understanding the characteristics of the storage device and the user experience for specific applications. Consult with a Red Hat Sales Engineer to determine if there may be further tuning needed to increase performance at different request sizes.
Figure 31.3. Request Size vs. Throughput Analysis and Key Inflection Points
31.4.3. Phase 3: Effects of Mixing Read & Write I/Os
The goal of this test is to understand how your appliance with VDO behaves when presented with mixed I/O loads (read/write), analyzing the effects of read/write mix at the optimal random queue depth and request sizes from 4 KB to 1 MB. You should use whatever is appropriate in your case.
- Perform four-corner testing at fixed I/O depth, varied block size (powers of 2) over the 8 KB to 256 KB range, and set read percentage at 10% increments, beginning with 0%. Remember to prefill any areas to be read and to recreate volumes between tests.
- Set the I/O Depth to the value determined in Section 31.4.1, “Phase 1: Effects of I/O Depth, Fixed 4 KB Blocks”.Example test input stimulus (read/write mix):
# z=[see previous step] # for readmix in 0 10 20 30 40 50 60 70 80 90 100; do for iosize in 4 8 16 32 64 128 256 512 1024; do fio --rw=rw --rwmixread=$readmix --bs=$iosize\k --name=vdo \ --filename=/dev/mapper/vdo0 --ioengine=libaio --numjobs=1 --thread \ --norandommap --runtime=300 --direct=0 --iodepth=$z --scramble_buffers=1 \ --offset=0 --size=100g done done
- Record throughput and latency at each data point, and then graph.
Figure 31.4, “Performance Is Consistent across Varying Read/Write Mixes” shows an example of how VDO may respond to I/O loads:
Figure 31.4. Performance Is Consistent across Varying Read/Write Mixes
Performance (aggregate) and latency (aggregate) are relatively consistent across the range of mixing reads and writes, trending from the lower max write throughput to the higher max read throughput.
This behavior may vary with different storage, but the important observation is that the performance is consistent under varying loads and/or that you can understand performance expectation for applications that demonstrate specific read/write mixes. If you discover any unexpected results, Red Hat Sales Engineers will be able to help you understand if it is VDO or the storage device itself that needs modification.
Note: Systems that do not exhibit a similar response consistency often signify a sub-optimal configuration. Contact your Red Hat Sales Engineer if this occurs.
31.4.4. Phase 4: Application Environments
The goal of these final tests is to understand how the system with VDO behaves when deployed in a real application environment. If possible, use real applications and use the knowledge learned so far; consider limiting the permissible queue depth on your appliance, and if possible tune the application to issue requests with those block sizes most beneficial to VDO performance.
Request sizes, I/O loads, read/write patterns, etc., are generally hard to predict, as they will vary by application use case (i.e., filers vs. virtual desktops vs. database), and applications often vary in the types of I/O based on the specific operation or due to multi-tenant access.
The final test shows general VDO performance in a mixed environment. If more specific details are known about your expected environment, test those settings as well.
Example test input stimulus (read/write mix):
# for readmix in 20 50 80; do for iosize in 4 8 16 32 64 128 256 512 1024; do fio --rw=rw --rwmixread=$readmix --bsrange=4k-256k --name=vdo \ --filename=/dev/mapper/vdo0 --ioengine=libaio --numjobs=1 --thread \ --norandommap --runtime=300 --direct=0 --iodepth=$iosize \ --scramble_buffers=1 --offset=0 --size=100g done done
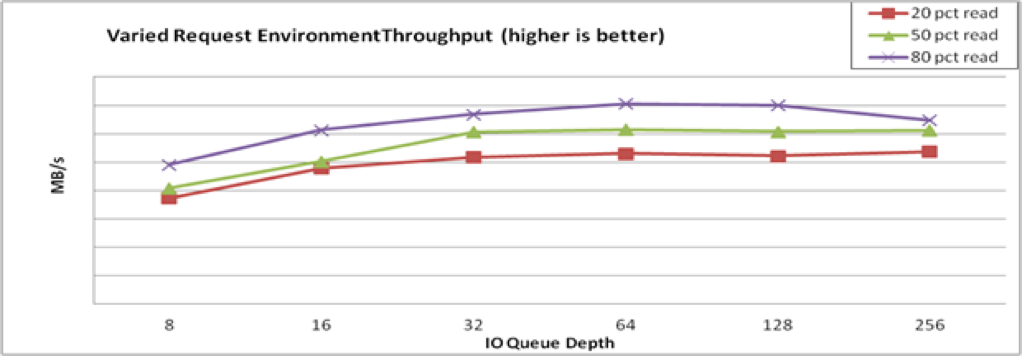
Record throughput and latency at each data point, and then graph (Figure 31.5, “Mixed Environment Performance”).
Figure 31.5. Mixed Environment Performance