第 16 章 Red Hat Process Automation Manager 中的 Prometheus 指标监控
Prometheus 是一个开源系统监控工具包,您可以与 Red Hat Process Automation Manager 搭配使用,以收集和存储与执行新规则、流程、决策模型和表示法(DMN)模型和其他 Red Hat Process Automation Manager 资产相关的指标。您可以通过 REST API 调用 KIE 服务器、通过 Prometheus 表达式浏览器或使用数据图形化工具(如 Grafana)来访问存储的指标。
您可以为内部 KIE 服务器实例、Spring Boot 上的 KIE 服务器或 Red Hat OpenShift Container Platform 上的 KIE 服务器部署配置 Prometheus 指标监控。
有关 KIE 服务器与 Prometheus 公开的可用指标列表,请从红帽客户门户网站下载 Red Hat Process Automation Manager 7.11.0 Source Distribution /kie -server-services-prometheus/src/main/7.11.0-sources/src/droolsjbpm-integration-$VERSION/kie-server-parent/kie-server-services/kie-server-services-prometheus/src/main/java/org/kie/server/services/prometheus。https://access.redhat.com/jbossnetwork/restricted/listSoftware.html
红帽对 Prometheus 的支持仅限于红帽产品文档中提供的设置和配置建议。
16.1. 为 KIE 服务器配置 Prometheus 指标监控
您可以将 KIE 服务器实例配置为使用 Prometheus 在 Red Hat Process Automation Manager 中收集和存储与业务资产活动相关的指标。有关 KIE 服务器与 Prometheus 公开的可用指标列表,请从红帽客户门户网站下载 Red Hat Process Automation Manager 7.11.0 Source Distribution /kie -server-services-prometheus/src/main/7.11.0-sources/src/droolsjbpm-integration-$VERSION/kie-server-parent/kie-server-services/kie-server-services-prometheus/src/main/java/org/kie/server/services/prometheus。https://access.redhat.com/jbossnetwork/restricted/listSoftware.html
先决条件
- KIE 服务器已安装。
-
您有对 KIE 服务器的
kie-server用户角色访问权限。 - 已安装 Prometheus。有关下载和使用 Prometheus 的详情,请查看 Prometheus 文档页面。
流程
-
在 KIE 服务器实例中,将
org.kie.prometheus.server.ext.disabled系统属性设置为false以启用 Prometheus 扩展。您可以在启动 KIE 服务器或 Red Hat Process Automation Manager 发行版本的standalone.xml或standalone-full.xml文件中定义此属性。 如果您在 Spring Boot 上运行 Red Hat Process Automation Manager,请在
application.properties系统属性中配置所需的键:Red Hat Process Automation Manager 和 Prometheus 的 Spring Boot application.properties 键
kieserver.jbpm.enabled=true
kieserver.drools.enabled=true
kieserver.dmn.enabled=true
kieserver.prometheus.enabled=true
在 Prometheus 发行版本的
prometheus.yaml文件中,在scrape_configs部分添加以下设置,将 Prometheus 配置为从 KIE Server 中提取指标:在 prometheus.yaml 文件中提取配置
scrape_configs:
  - job_name: 'kie-server'
    metrics_path: /SERVER_PATH/services/rest/metrics
    basicAuth:
      username: USER_NAME
      password: PASSWORD
    static_configs:
      - targets: ["HOST:PORT"]
提取 Spring Boot 的 prometheus.yaml 文件中的配置(如果适用)
scrape_configs:
  - job_name: 'kie'
    metrics_path: /rest/metrics
    static_configs:
      - targets: ["HOST:PORT"]
根据您的 KIE 服务器位置和设置替换值。
启动 KIE 服务器实例。
Red Hat JBoss EAP 上 Red Hat Process Automation Manager 的 start 命令示例
$ cd ~/EAP_HOME/bin
$ ./standalone.sh --c standalone-full.xml
启动配置的 KIE 服务器实例后,Prometheus 开始收集指标和 KIE 服务器将指标发布到 REST API 端点
http://HOST:PORT/SERVER/services/rest/metrics(或在 Spring Boot 中)发送到http://HOST:PORT/rest/metrics。在 REST 客户端或 curl 工具中,发送带有以下组件的 REST API 请求,以验证 KIE 服务器是否发布指标:
对于 REST 客户端:
-
身份验证 :使用
kie-server角色输入 KIE 服务器用户的用户名和密码。 HTTP 标头 :设置以下标头:
-
接受:application/json
-
-
HTTP 方法 :设置为
GET。 -
URL :输入 KIE Server REST API 基本 URL 和指标端点,如
http://localhost:8080/kie-server/services/rest/metrics(或在 Spring Boot 中,http://localhost:8080/rest/metrics)。
对于 curl 工具:
-
-u:使用kie-server角色输入 KIE 服务器用户的用户名和密码。 -h: 设置以下标头:-
接受:application/json
-
-
-x: 设置为GET。 -
URL :输入 KIE Server REST API 基本 URL 和指标端点,如
http://localhost:8080/kie-server/services/rest/metrics(或在 Spring Boot 中,http://localhost:8080/rest/metrics)。
Red Hat JBoss EAP 上 Red Hat Process Automation Manager 的 curl 命令示例
curl -u 'baAdmin:password@1' -X GET "http://localhost:8080/kie-server/services/rest/metrics"Spring Boot 上 Red Hat Process Automation Manager 的 curl 命令示例
curl -u 'baAdmin:password@1' -X GET "http://localhost:8080/rest/metrics"服务器响应示例
# HELP kie_server_container_started_total Kie Server Started Containers
# TYPE kie_server_container_started_total counter
kie_server_container_started_total{container_id="task-assignment-kjar-1.0",} 1.0
# HELP solvers_running Number of solvers currently running
# TYPE solvers_running gauge
solvers_running 0.0
# HELP dmn_evaluate_decision_nanosecond DMN Evaluation Time
# TYPE dmn_evaluate_decision_nanosecond histogram
# HELP solver_duration_seconds Time in seconds it took solver to solve the constraint problem
# TYPE solver_duration_seconds summary
solver_duration_seconds_count{solver_id="100tasks-5employees.xml",} 1.0
solver_duration_seconds_sum{solver_id="100tasks-5employees.xml",} 179.828255925
solver_duration_seconds_count{solver_id="24tasks-8employees.xml",} 1.0
solver_duration_seconds_sum{solver_id="24tasks-8employees.xml",} 179.995759653
# HELP drl_match_fired_nanosecond Drools Firing Time
# TYPE drl_match_fired_nanosecond histogram
# HELP dmn_evaluate_failed_count DMN Evaluation Failed
# TYPE dmn_evaluate_failed_count counter
# HELP kie_server_start_time Kie Server Start Time
# TYPE kie_server_start_time gauge
kie_server_start_time{name="myapp-kieserver",server_id="myapp-kieserver",location="http://myapp-kieserver-demo-monitoring.127.0.0.1.nip.io:80/services/rest/server",version="7.4.0.redhat-20190428",} 1.557221271502E12
# HELP kie_server_container_running_total Kie Server Running Containers
# TYPE kie_server_container_running_total gauge
kie_server_container_running_total{container_id="task-assignment-kjar-1.0",} 1.0
# HELP solver_score_calculation_speed Number of moves per second for a particular solver solving the constraint problem
# TYPE solver_score_calculation_speed summary
solver_score_calculation_speed_count{solver_id="100tasks-5employees.xml",} 1.0
solver_score_calculation_speed_sum{solver_id="100tasks-5employees.xml",} 6997.0
solver_score_calculation_speed_count{solver_id="24tasks-8employees.xml",} 1.0
solver_score_calculation_speed_sum{solver_id="24tasks-8employees.xml",} 19772.0
# HELP kie_server_case_started_total Kie Server Started Cases
# TYPE kie_server_case_started_total counter
kie_server_case_started_total{case_definition_id="itorders.orderhardware",} 1.0
# HELP kie_server_case_running_total Kie Server Running Cases
# TYPE kie_server_case_running_total gauge
kie_server_case_running_total{case_definition_id="itorders.orderhardware",} 2.0
# HELP kie_server_data_set_registered_total Kie Server Data Set Registered
# TYPE kie_server_data_set_registered_total gauge
kie_server_data_set_registered_total{name="jbpmProcessInstanceLogs::CUSTOM",uuid="jbpmProcessInstanceLogs",} 1.0
kie_server_data_set_registered_total{name="jbpmRequestList::CUSTOM",uuid="jbpmRequestList",} 1.0
kie_server_data_set_registered_total{name="tasksMonitoring::CUSTOM",uuid="tasksMonitoring",} 1.0
kie_server_data_set_registered_total{name="jbpmHumanTasks::CUSTOM",uuid="jbpmHumanTasks",} 1.0
kie_server_data_set_registered_total{name="jbpmHumanTasksWithUser::FILTERED_PO_TASK",uuid="jbpmHumanTasksWithUser",} 1.0
kie_server_data_set_registered_total{name="jbpmHumanTasksWithVariables::CUSTOM",uuid="jbpmHumanTasksWithVariables",} 1.0
kie_server_data_set_registered_total{name="jbpmProcessInstancesWithVariables::CUSTOM",uuid="jbpmProcessInstancesWithVariables",} 1.0
kie_server_data_set_registered_total{name="jbpmProcessInstances::CUSTOM",uuid="jbpmProcessInstances",} 1.0
kie_server_data_set_registered_total{name="jbpmExecutionErrorList::CUSTOM",uuid="jbpmExecutionErrorList",} 1.0
kie_server_data_set_registered_total{name="processesMonitoring::CUSTOM",uuid="processesMonitoring",} 1.0
kie_server_data_set_registered_total{name="jbpmHumanTasksWithAdmin::FILTERED_BA_TASK",uuid="jbpmHumanTasksWithAdmin",} 1.0
# HELP kie_server_execution_error_total Kie Server Execution Errors
# TYPE kie_server_execution_error_total counter
# HELP kie_server_task_completed_total Kie Server Completed Tasks
# TYPE kie_server_task_completed_total counter
# HELP kie_server_container_running_total Kie Server Running Containers
# TYPE kie_server_container_running_total gauge
kie_server_container_running_total{container_id="itorders_1.0.0-SNAPSHOT",} 1.0
# HELP kie_server_job_cancelled_total Kie Server Cancelled Jobs
# TYPE kie_server_job_cancelled_total counter
# HELP kie_server_process_instance_started_total Kie Server Started Process Instances
# TYPE kie_server_process_instance_started_total counter
kie_server_process_instance_started_total{container_id="itorders_1.0.0-SNAPSHOT",process_id="itorders.orderhardware",} 1.0
# HELP solver_duration_seconds Time in seconds it took solver to solve the constraint problem
# TYPE solver_duration_seconds summary
# HELP kie_server_task_skipped_total Kie Server Skipped Tasks
# TYPE kie_server_task_skipped_total counter
# HELP kie_server_data_set_execution_time_seconds Kie Server Data Set Execution Time
# TYPE kie_server_data_set_execution_time_seconds summary
kie_server_data_set_execution_time_seconds_count{uuid="jbpmProcessInstances",} 8.0
kie_server_data_set_execution_time_seconds_sum{uuid="jbpmProcessInstances",} 0.05600000000000001
# HELP kie_server_job_scheduled_total Kie Server Started Jobs
# TYPE kie_server_job_scheduled_total counter
# HELP kie_server_data_set_execution_total Kie Server Data Set Execution
# TYPE kie_server_data_set_execution_total counter
kie_server_data_set_execution_total{uuid="jbpmProcessInstances",} 8.0
# HELP kie_server_process_instance_completed_total Kie Server Completed Process Instances
# TYPE kie_server_process_instance_completed_total counter
# HELP kie_server_job_running_total Kie Server Running Jobs
# TYPE kie_server_job_running_total gauge
# HELP kie_server_task_failed_total Kie Server Failed Tasks
# TYPE kie_server_task_failed_total counter
# HELP kie_server_task_exited_total Kie Server Exited Tasks
# TYPE kie_server_task_exited_total counter
# HELP dmn_evaluate_decision_nanosecond DMN Evaluation Time
# TYPE dmn_evaluate_decision_nanosecond histogram
# HELP kie_server_data_set_lookups_total Kie Server Data Set Running Lookups
# TYPE kie_server_data_set_lookups_total gauge
kie_server_data_set_lookups_total{uuid="jbpmProcessInstances",} 0.0
# HELP kie_server_process_instance_duration_seconds Kie Server Process Instances Duration
# TYPE kie_server_process_instance_duration_seconds summary
# HELP kie_server_case_duration_seconds Kie Server Case Duration
# TYPE kie_server_case_duration_seconds summary
# HELP dmn_evaluate_failed_count DMN Evaluation Failed
# TYPE dmn_evaluate_failed_count counter
# HELP kie_server_task_added_total Kie Server Added Tasks
# TYPE kie_server_task_added_total counter
kie_server_task_added_total{deployment_id="itorders_1.0.0-SNAPSHOT",process_id="itorders.orderhardware",task_name="Prepare hardware spec",} 1.0
# HELP drl_match_fired_nanosecond Drools Firing Time
# TYPE drl_match_fired_nanosecond histogram
# HELP kie_server_container_started_total Kie Server Started Containers
# TYPE kie_server_container_started_total counter
kie_server_container_started_total{container_id="itorders_1.0.0-SNAPSHOT",} 1.0
# HELP kie_server_process_instance_sla_violated_total Kie Server Process Instances SLA Violated
# TYPE kie_server_process_instance_sla_violated_total counter
# HELP kie_server_task_duration_seconds Kie Server Task Duration
# TYPE kie_server_task_duration_seconds summary
# HELP kie_server_job_executed_total Kie Server Executed Jobs
# TYPE kie_server_job_executed_total counter
# HELP kie_server_deployments_active_total Kie Server Active Deployments
# TYPE kie_server_deployments_active_total gauge
kie_server_deployments_active_total{deployment_id="itorders_1.0.0-SNAPSHOT",} 1.0
# HELP kie_server_process_instance_running_total Kie Server Running Process Instances
# TYPE kie_server_process_instance_running_total gauge
kie_server_process_instance_running_total{container_id="itorders_1.0.0-SNAPSHOT",process_id="itorders.orderhardware",} 2.0
# HELP solvers_running Number of solvers currently running
# TYPE solvers_running gauge
solvers_running 0.0
# HELP kie_server_work_item_duration_seconds Kie Server Work Items Duration
# TYPE kie_server_work_item_duration_seconds summary
# HELP kie_server_job_duration_seconds Kie Server Job Duration
# TYPE kie_server_job_duration_seconds summary
# HELP solver_score_calculation_speed Number of moves per second for a particular solver solving the constraint problem
# TYPE solver_score_calculation_speed summary
# HELP kie_server_start_time Kie Server Start Time
# TYPE kie_server_start_time gauge
kie_server_start_time{name="sample-server",server_id="sample-server",location="http://localhost:8080/kie-server/services/rest/server",version="7.52.1-SNAPSHOT",} 1.557285486469E12
如果 KIE 服务器中没有指标,请查看并验证本节中描述的 KIE 服务器和 Prometheus 配置。
您还可以在
http://HOST:PORT/graph的 Prometheus 表达式浏览器中与收集的指标交互,或使用 data-graphing 工具(如 Grafana)集成 Prometheus 数据源:图 16.1. 带有 KIE 服务器指标的 Prometheus 表达式浏览器
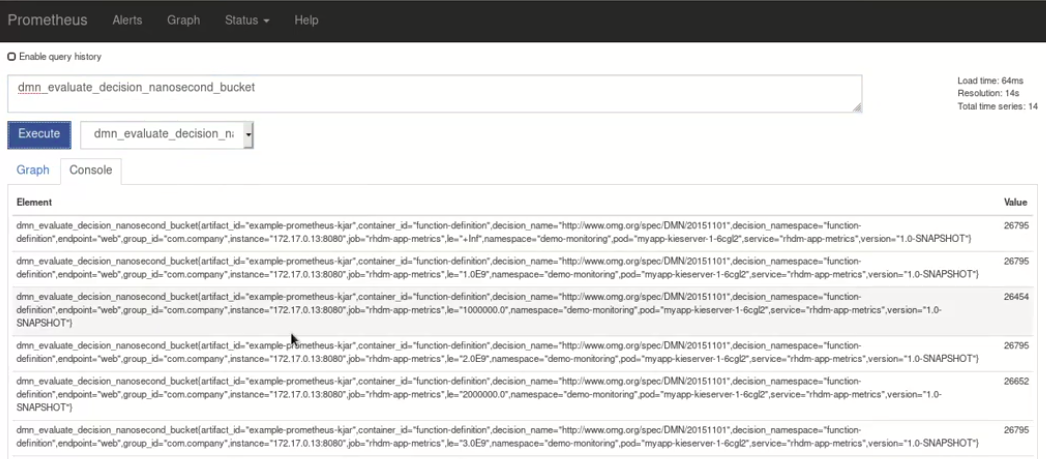
图 16.2. 带有 KIE 服务器目标的 Prometheus 表达式浏览器

图 16.3. 带有 DMN 模型的 KIE 服务器指标的 Grafana 仪表板
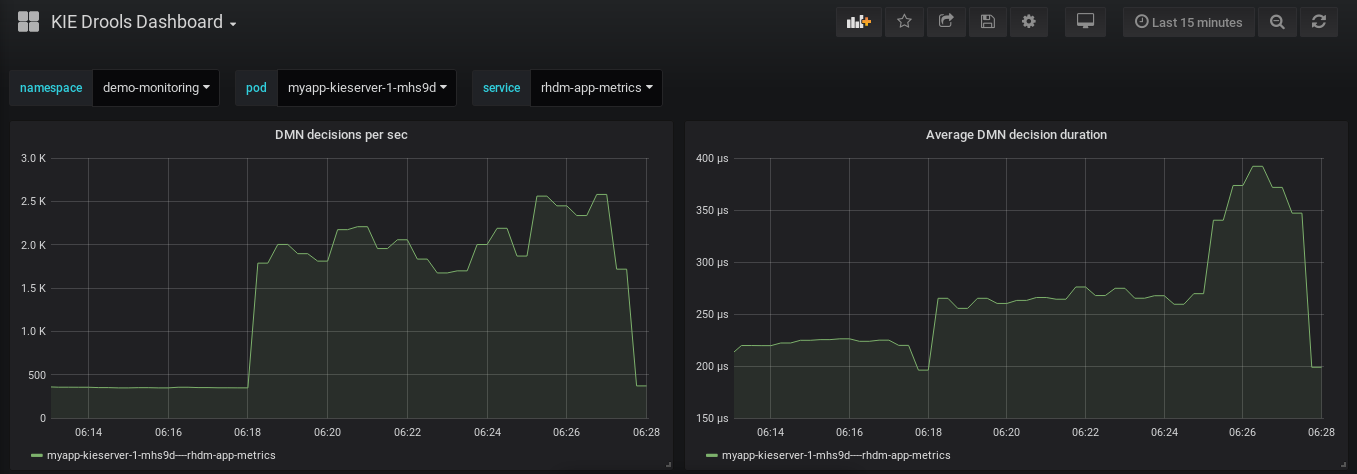
图 16.4. 带有用于解析器的 KIE 服务器指标的 Grafana 仪表板

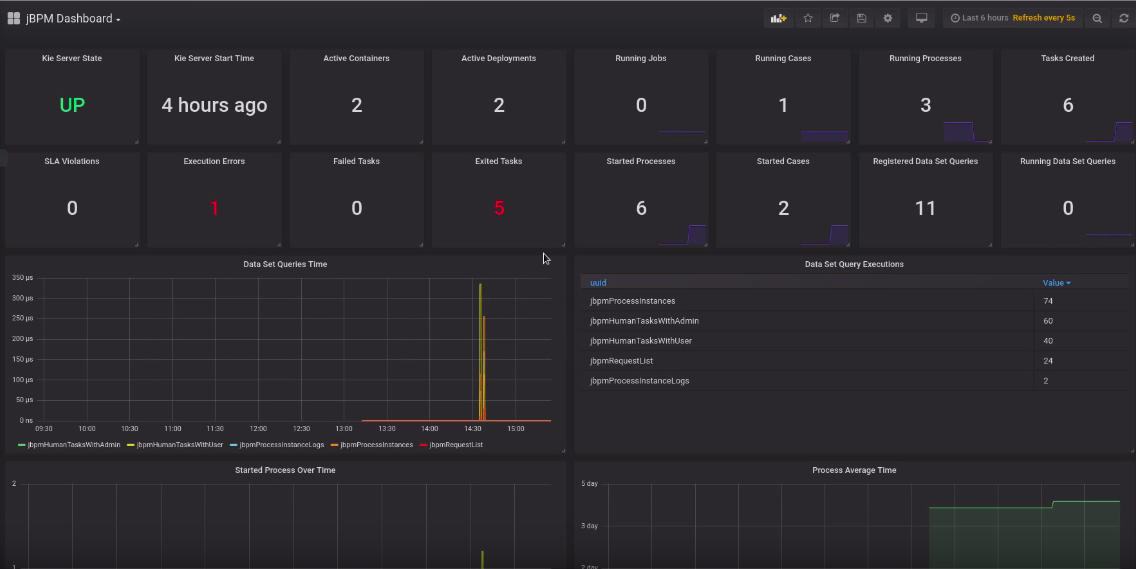
图 16.5. 带有 KIE 服务器指标的 Grafana 仪表板,用于进程、情况和任务
-
身份验证 :使用