Networking
Configuring and managing cluster networking
Abstract
Chapter 1. About networking
Red Hat OpenShift Networking is an ecosystem of features, plugins and advanced networking capabilities that extend Kubernetes networking with the advanced networking-related features that your cluster needs to manage its network traffic for one or multiple hybrid clusters. This ecosystem of networking capabilities integrates ingress, egress, load balancing, high-performance throughput, security, inter- and intra-cluster traffic management and provides role-based observability tooling to reduce its natural complexities.
OpenShift SDN CNI is deprecated as of OpenShift Container Platform 4.14. As of OpenShift Container Platform 4.15, the network plugin is not an option for new installations. In a subsequent future release, the OpenShift SDN network plugin is planned to be removed and no longer supported. Red Hat will provide bug fixes and support for this feature until it is removed, but this feature will no longer receive enhancements. As an alternative to OpenShift SDN CNI, you can use OVN Kubernetes CNI instead. For more information, see OpenShift SDN CNI removal.
The following list highlights some of the most commonly used Red Hat OpenShift Networking features available on your cluster:
Primary cluster network provided by either of the following Container Network Interface (CNI) plugins:
- OVN-Kubernetes network plugin, the default plugin
- OpenShift SDN network plugin
- Certified 3rd-party alternative primary network plugins
- Cluster Network Operator for network plugin management
- Ingress Operator for TLS encrypted web traffic
- DNS Operator for name assignment
- MetalLB Operator for traffic load balancing on bare metal clusters
- IP failover support for high-availability
- Additional hardware network support through multiple CNI plugins, including for macvlan, ipvlan, and SR-IOV hardware networks
- IPv4, IPv6, and dual stack addressing
- Hybrid Linux-Windows host clusters for Windows-based workloads
- Red Hat OpenShift Service Mesh for discovery, load balancing, service-to-service authentication, failure recovery, metrics, and monitoring of services
- Single-node OpenShift
- Network Observability Operator for network debugging and insights
- Submariner for inter-cluster networking
- Red Hat Service Interconnect for layer 7 inter-cluster networking
Chapter 2. Understanding networking
Cluster Administrators have several options for exposing applications that run inside a cluster to external traffic and securing network connections:
- Service types, such as node ports or load balancers
-
API resources, such as
IngressandRoute
By default, Kubernetes allocates each pod an internal IP address for applications running within the pod. Pods and their containers can network, but clients outside the cluster do not have networking access. When you expose your application to external traffic, giving each pod its own IP address means that pods can be treated like physical hosts or virtual machines in terms of port allocation, networking, naming, service discovery, load balancing, application configuration, and migration.
Some cloud platforms offer metadata APIs that listen on the 169.254.169.254 IP address, a link-local IP address in the IPv4 169.254.0.0/16 CIDR block.
This CIDR block is not reachable from the pod network. Pods that need access to these IP addresses must be given host network access by setting the spec.hostNetwork field in the pod spec to true.
If you allow a pod host network access, you grant the pod privileged access to the underlying network infrastructure.
2.1. OpenShift Container Platform DNS
If you are running multiple services, such as front-end and back-end services for use with multiple pods, environment variables are created for user names, service IPs, and more so the front-end pods can communicate with the back-end services. If the service is deleted and recreated, a new IP address can be assigned to the service, and requires the front-end pods to be recreated to pick up the updated values for the service IP environment variable. Additionally, the back-end service must be created before any of the front-end pods to ensure that the service IP is generated properly, and that it can be provided to the front-end pods as an environment variable.
For this reason, OpenShift Container Platform has a built-in DNS so that the services can be reached by the service DNS as well as the service IP/port.
2.2. OpenShift Container Platform Ingress Operator
When you create your OpenShift Container Platform cluster, pods and services running on the cluster are each allocated their own IP addresses. The IP addresses are accessible to other pods and services running nearby but are not accessible to outside clients.
The Ingress Operator makes it possible for external clients to access your service by deploying and managing one or more HAProxy-based Ingress Controllers to handle routing. You can use the Ingress Operator to route traffic by specifying OpenShift Container Platform Route and Kubernetes Ingress resources. Configurations within the Ingress Controller, such as the ability to define endpointPublishingStrategy type and internal load balancing, provide ways to publish Ingress Controller endpoints.
2.2.1. Comparing routes and Ingress
The Kubernetes Ingress resource in OpenShift Container Platform implements the Ingress Controller with a shared router service that runs as a pod inside the cluster. The most common way to manage Ingress traffic is with the Ingress Controller. You can scale and replicate this pod like any other regular pod. This router service is based on HAProxy, which is an open source load balancer solution.
The OpenShift Container Platform route provides Ingress traffic to services in the cluster. Routes provide advanced features that might not be supported by standard Kubernetes Ingress Controllers, such as TLS re-encryption, TLS passthrough, and split traffic for blue-green deployments.
Ingress traffic accesses services in the cluster through a route. Routes and Ingress are the main resources for handling Ingress traffic. Ingress provides features similar to a route, such as accepting external requests and delegating them based on the route. However, with Ingress you can only allow certain types of connections: HTTP/2, HTTPS and server name identification (SNI), and TLS with certificate. In OpenShift Container Platform, routes are generated to meet the conditions specified by the Ingress resource.
2.3. Glossary of common terms for OpenShift Container Platform networking
This glossary defines common terms that are used in the networking content.
- authentication
- To control access to an OpenShift Container Platform cluster, a cluster administrator can configure user authentication and ensure only approved users access the cluster. To interact with an OpenShift Container Platform cluster, you must authenticate to the OpenShift Container Platform API. You can authenticate by providing an OAuth access token or an X.509 client certificate in your requests to the OpenShift Container Platform API.
- AWS Load Balancer Operator
-
The AWS Load Balancer (ALB) Operator deploys and manages an instance of the
aws-load-balancer-controller. - Cluster Network Operator
- The Cluster Network Operator (CNO) deploys and manages the cluster network components in an OpenShift Container Platform cluster. This includes deployment of the Container Network Interface (CNI) network plugin selected for the cluster during installation.
- config map
-
A config map provides a way to inject configuration data into pods. You can reference the data stored in a config map in a volume of type
ConfigMap. Applications running in a pod can use this data. - custom resource (CR)
- A CR is extension of the Kubernetes API. You can create custom resources.
- DNS
- Cluster DNS is a DNS server which serves DNS records for Kubernetes services. Containers started by Kubernetes automatically include this DNS server in their DNS searches.
- DNS Operator
- The DNS Operator deploys and manages CoreDNS to provide a name resolution service to pods. This enables DNS-based Kubernetes Service discovery in OpenShift Container Platform.
- deployment
- A Kubernetes resource object that maintains the life cycle of an application.
- domain
- Domain is a DNS name serviced by the Ingress Controller.
- egress
- The process of data sharing externally through a network’s outbound traffic from a pod.
- External DNS Operator
- The External DNS Operator deploys and manages ExternalDNS to provide the name resolution for services and routes from the external DNS provider to OpenShift Container Platform.
- HTTP-based route
- An HTTP-based route is an unsecured route that uses the basic HTTP routing protocol and exposes a service on an unsecured application port.
- Ingress
- The Kubernetes Ingress resource in OpenShift Container Platform implements the Ingress Controller with a shared router service that runs as a pod inside the cluster.
- Ingress Controller
- The Ingress Operator manages Ingress Controllers. Using an Ingress Controller is the most common way to allow external access to an OpenShift Container Platform cluster.
- installer-provisioned infrastructure
- The installation program deploys and configures the infrastructure that the cluster runs on.
- kubelet
- A primary node agent that runs on each node in the cluster to ensure that containers are running in a pod.
- Kubernetes NMState Operator
- The Kubernetes NMState Operator provides a Kubernetes API for performing state-driven network configuration across the OpenShift Container Platform cluster’s nodes with NMState.
- kube-proxy
- Kube-proxy is a proxy service which runs on each node and helps in making services available to the external host. It helps in forwarding the request to correct containers and is capable of performing primitive load balancing.
- load balancers
- OpenShift Container Platform uses load balancers for communicating from outside the cluster with services running in the cluster.
- MetalLB Operator
-
As a cluster administrator, you can add the MetalLB Operator to your cluster so that when a service of type
LoadBalanceris added to the cluster, MetalLB can add an external IP address for the service. - multicast
- With IP multicast, data is broadcast to many IP addresses simultaneously.
- namespaces
- A namespace isolates specific system resources that are visible to all processes. Inside a namespace, only processes that are members of that namespace can see those resources.
- networking
- Network information of a OpenShift Container Platform cluster.
- node
- A worker machine in the OpenShift Container Platform cluster. A node is either a virtual machine (VM) or a physical machine.
- OpenShift Container Platform Ingress Operator
-
The Ingress Operator implements the
IngressControllerAPI and is the component responsible for enabling external access to OpenShift Container Platform services. - pod
- One or more containers with shared resources, such as volume and IP addresses, running in your OpenShift Container Platform cluster. A pod is the smallest compute unit defined, deployed, and managed.
- PTP Operator
-
The PTP Operator creates and manages the
linuxptpservices. - route
- The OpenShift Container Platform route provides Ingress traffic to services in the cluster. Routes provide advanced features that might not be supported by standard Kubernetes Ingress Controllers, such as TLS re-encryption, TLS passthrough, and split traffic for blue-green deployments.
- scaling
- Increasing or decreasing the resource capacity.
- service
- Exposes a running application on a set of pods.
- Single Root I/O Virtualization (SR-IOV) Network Operator
- The Single Root I/O Virtualization (SR-IOV) Network Operator manages the SR-IOV network devices and network attachments in your cluster.
- software-defined networking (SDN)
- OpenShift Container Platform uses a software-defined networking (SDN) approach to provide a unified cluster network that enables communication between pods across the OpenShift Container Platform cluster.
OpenShift SDN CNI is deprecated as of OpenShift Container Platform 4.14. As of OpenShift Container Platform 4.15, the network plugin is not an option for new installations. In a subsequent future release, the OpenShift SDN network plugin is planned to be removed and no longer supported. Red Hat will provide bug fixes and support for this feature until it is removed, but this feature will no longer receive enhancements. As an alternative to OpenShift SDN CNI, you can use OVN Kubernetes CNI instead. For more information, see OpenShift SDN CNI removal.
- Stream Control Transmission Protocol (SCTP)
- SCTP is a reliable message based protocol that runs on top of an IP network.
- taint
- Taints and tolerations ensure that pods are scheduled onto appropriate nodes. You can apply one or more taints on a node.
- toleration
- You can apply tolerations to pods. Tolerations allow the scheduler to schedule pods with matching taints.
- web console
- A user interface (UI) to manage OpenShift Container Platform.
Chapter 3. Accessing hosts
Learn how to create a bastion host to access OpenShift Container Platform instances and access the control plane nodes with secure shell (SSH) access.
3.1. Accessing hosts on Amazon Web Services in an installer-provisioned infrastructure cluster
The OpenShift Container Platform installer does not create any public IP addresses for any of the Amazon Elastic Compute Cloud (Amazon EC2) instances that it provisions for your OpenShift Container Platform cluster. To be able to SSH to your OpenShift Container Platform hosts, you must follow this procedure.
Procedure
-
Create a security group that allows SSH access into the virtual private cloud (VPC) created by the
openshift-installcommand. - Create an Amazon EC2 instance on one of the public subnets the installer created.
Associate a public IP address with the Amazon EC2 instance that you created.
Unlike with the OpenShift Container Platform installation, you should associate the Amazon EC2 instance you created with an SSH keypair. It does not matter what operating system you choose for this instance, as it will simply serve as an SSH bastion to bridge the internet into your OpenShift Container Platform cluster’s VPC. The Amazon Machine Image (AMI) you use does matter. With Red Hat Enterprise Linux CoreOS (RHCOS), for example, you can provide keys via Ignition, like the installer does.
After you provisioned your Amazon EC2 instance and can SSH into it, you must add the SSH key that you associated with your OpenShift Container Platform installation. This key can be different from the key for the bastion instance, but does not have to be.
NoteDirect SSH access is only recommended for disaster recovery. When the Kubernetes API is responsive, run privileged pods instead.
-
Run
oc get nodes, inspect the output, and choose one of the nodes that is a master. The hostname looks similar toip-10-0-1-163.ec2.internal. From the bastion SSH host you manually deployed into Amazon EC2, SSH into that control plane host. Ensure that you use the same SSH key you specified during the installation:
$ ssh -i <ssh-key-path> core@<master-hostname>
Chapter 4. Networking dashboards
Networking metrics are viewable in dashboards within the OpenShift Container Platform web console, under Observe → Dashboards.
4.1. Network Observability Operator
If you have the Network Observability Operator installed, you can view network traffic metrics dashboards by selecting the Netobserv dashboard from the Dashboards drop-down list. For more information about metrics available in this Dashboard, see Network Observability metrics dashboards.
4.2. Networking and OVN-Kubernetes dashboard
You can view both general networking metrics as well as OVN-Kubernetes metrics from the dashboard.
To view general networking metrics, select Networking/Linux Subsystem Stats from the Dashboards drop-down list. You can view the following networking metrics from the dashboard: Network Utilisation, Network Saturation, and Network Errors.
To view OVN-Kubernetes metrics select Networking/Infrastructure from the Dashboards drop-down list. You can view the following OVN-Kuberenetes metrics: Networking Configuration, TCP Latency Probes, Control Plane Resources, and Worker Resources.
4.3. Ingress Operator dashboard
You can view networking metrics handled by the Ingress Operator from the dashboard. This includes metrics like the following:
- Incoming and outgoing bandwidth
- HTTP error rates
- HTTP server response latency
To view these Ingress metrics, select Networking/Ingress from the Dashboards drop-down list. You can view Ingress metrics for the following categories: Top 10 Per Route, Top 10 Per Namespace, and Top 10 Per Shard.
Chapter 5. Networking Operators
5.1. Kubernetes NMState Operator
The Kubernetes NMState Operator provides a Kubernetes API for performing state-driven network configuration across the OpenShift Container Platform cluster’s nodes with NMState. The Kubernetes NMState Operator provides users with functionality to configure various network interface types, DNS, and routing on cluster nodes. Additionally, the daemons on the cluster nodes periodically report on the state of each node’s network interfaces to the API server.
Red Hat supports the Kubernetes NMState Operator in production environments on bare-metal, IBM Power®, IBM Z®, IBM® LinuxONE, VMware vSphere, and OpenStack installations.
Before you can use NMState with OpenShift Container Platform, you must install the Kubernetes NMState Operator. After you install the Kubernetes NMState Operator, you can complete the following tasks:
- Observing and updating the node network state and configuration
-
Creating a manifest object that includes a customized
br-exbridge For more information on these tasks, see the Additional resources section
Before you can use NMState with OpenShift Container Platform, you must install the Kubernetes NMState Operator.
The Kubernetes NMState Operator updates the network configuration of a secondary NIC. The Operator cannot update the network configuration of the primary NIC, or update the br-ex bridge on most on-premise networks.
On a bare-metal platform, using the Kubernetes NMState Operator to update the br-ex bridge network configuration is only supported if you set the br-ex bridge as the interface in a machine config manifest file. To update the br-ex bridge as a postinstallation task, you must set the br-ex bridge as the interface in the NMState configuration of the NodeNetworkConfigurationPolicy custom resource (CR) for your cluster. For more information, see Creating a manifest object that includes a customized br-ex bridge in Postinstallation configuration.
OpenShift Container Platform uses nmstate to report on and configure the state of the node network. This makes it possible to modify the network policy configuration, such as by creating a Linux bridge on all nodes, by applying a single configuration manifest to the cluster.
Node networking is monitored and updated by the following objects:
NodeNetworkState- Reports the state of the network on that node.
NodeNetworkConfigurationPolicy-
Describes the requested network configuration on nodes. You update the node network configuration, including adding and removing interfaces, by applying a
NodeNetworkConfigurationPolicyCR to the cluster. NodeNetworkConfigurationEnactment- Reports the network policies enacted upon each node.
Do not make configuration changes to the br-ex bridge or its underlying interfaces as a postinstallation task.
5.1.1. Installing the Kubernetes NMState Operator
You can install the Kubernetes NMState Operator by using the web console or the CLI.
5.1.1.1. Installing the Kubernetes NMState Operator by using the web console
You can install the Kubernetes NMState Operator by using the web console. After you install the Kubernetes NMState Operator, the Operator has deployed the NMState State Controller as a daemon set across all of the cluster nodes.
Prerequisites
-
You are logged in as a user with
cluster-adminprivileges.
Procedure
- Select Operators → OperatorHub.
-
In the search field below All Items, enter
nmstateand click Enter to search for the Kubernetes NMState Operator. - Click on the Kubernetes NMState Operator search result.
- Click on Install to open the Install Operator window.
- Click Install to install the Operator.
- After the Operator finishes installing, click View Operator.
-
Under Provided APIs, click Create Instance to open the dialog box for creating an instance of
kubernetes-nmstate. In the Name field of the dialog box, ensure the name of the instance is
nmstate.NoteThe name restriction is a known issue. The instance is a singleton for the entire cluster.
- Accept the default settings and click Create to create the instance.
5.1.1.2. Installing the Kubernetes NMState Operator by using the CLI
You can install the Kubernetes NMState Operator by using the OpenShift CLI (oc). After it is installed, the Operator deploys the NMState State Controller as a daemon set across all of the cluster nodes to manage the node network state and configuration.
Prerequisites
-
You have installed the OpenShift CLI (
oc). -
You are logged in as a user with
cluster-adminprivileges.
Procedure
Create the
nmstateOperator namespace:$ cat << EOF | oc apply -f - apiVersion: v1 kind: Namespace metadata: name: openshift-nmstate spec: finalizers: - kubernetes EOFCreate the
OperatorGroup:$ cat << EOF | oc apply -f - apiVersion: operators.coreos.com/v1 kind: OperatorGroup metadata: name: openshift-nmstate namespace: openshift-nmstate spec: targetNamespaces: - openshift-nmstate EOFSubscribe to the
nmstateOperator:$ cat << EOF| oc apply -f - apiVersion: operators.coreos.com/v1alpha1 kind: Subscription metadata: name: kubernetes-nmstate-operator namespace: openshift-nmstate spec: channel: stable installPlanApproval: Automatic name: kubernetes-nmstate-operator source: redhat-operators sourceNamespace: openshift-marketplace EOFConfirm the
ClusterServiceVersion(CSV) status for thenmstateOperator deployment equalsSucceeded:$ oc get clusterserviceversion -n openshift-nmstate \ -o custom-columns=Name:.metadata.name,Phase:.status.phaseCreate an instance of the
nmstateOperator:$ cat << EOF | oc apply -f - apiVersion: nmstate.io/v1 kind: NMState metadata: name: nmstate EOFIf your cluster has problems with the DNS health check probe because of DNS connectivity issues, you can add the following DNS host name configuration to the
NMStateCRD to build in health checks that can resolve these issues:apiVersion: nmstate.io/v1 kind: NMState metadata: name: nmstate spec: probeConfiguration: dns: host: redhat.com # ...Apply the DNS host name configuration to your cluster network by running the following command. Ensure that you replace
<filename>with the name of your CRD file.$ oc apply -f <filename>.yamlMonitor the
nmstateCRD until the resource reaches theAvailablecondition by running the following command. Ensure that you set a value for the--timeoutoption so that if theAvailablecondition is not met within this set maximum waiting time, the command times out and generates an error message.$ oc wait --for=condition=Available nmstate/nmstate --timeout=600s
Verification
Verify that all pods for the NMState Operator have the
Runningstatus by entering the following command:$ oc get pod -n openshift-nmstate
5.1.2. Uninstalling the Kubernetes NMState Operator
Remove the Kubernetes NMState Operator and related resources when they are no longer needed.
You can use the Operator Lifecycle Manager (OLM) to uninstall the Kubernetes NMState Operator, but by design OLM does not delete any associated custom resource definitions (CRDs), custom resources (CRs), or API Services.
Before you uninstall the Kubernetes NMState Operator from the Subcription resource used by OLM, identify what Kubernetes NMState Operator resources to delete. This identification ensures that you can delete resources without impacting your running cluster.
If you need to reinstall the Kubernetes NMState Operator, see "Installing the Kubernetes NMState Operator by using the CLI" or "Installing the Kubernetes NMState Operator by using the web console".
Prerequisites
-
You have installed the OpenShift CLI (
oc). -
You have installed the
jqCLI tool. -
You are logged in as a user with
cluster-adminprivileges.
Procedure
Unsubscribe the Kubernetes NMState Operator from the
Subcriptionresource by running the following command:$ oc delete --namespace openshift-nmstate subscription kubernetes-nmstate-operatorFind the
ClusterServiceVersion(CSV) resource that associates with the Kubernetes NMState Operator:$ oc get --namespace openshift-nmstate clusterserviceversionExample output that lists a CSV resource
NAME DISPLAY VERSION REPLACES PHASE kubernetes-nmstate-operator.v4.18.0 Kubernetes NMState Operator 4.18.0 SucceededDelete the CSV resource. After you delete the file, OLM deletes certain resources, such as
RBAC, that it created for the Operator.$ oc delete --namespace openshift-nmstate clusterserviceversion kubernetes-nmstate-operator.v4.18.0Delete the
nmstateCR and any associatedDeploymentresources by running the following commands:$ oc -n openshift-nmstate delete nmstate nmstate$ oc delete --all deployments --namespace=openshift-nmstateAfter you deleted the
nmstateCR, remove thenmstate-console-pluginconsole plugin name from theconsole.operator.openshift.io/clusterCR.Store the position of the
nmstate-console-pluginentry that exists among the list of enable plugins by running the following command. The following command uses thejqCLI tool to store the index of the entry in an environment variable namedINDEX:INDEX=$(oc get console.operator.openshift.io cluster -o json | jq -r '.spec.plugins | to_entries[] | select(.value == "nmstate-console-plugin") | .key')Remove the
nmstate-console-pluginentry from theconsole.operator.openshift.io/clusterCR by running the following patch command:$ oc patch console.operator.openshift.io cluster --type=json -p "[{\"op\": \"remove\", \"path\": \"/spec/plugins/$INDEX\"}]"-
INDEXis an auxiliary variable. You can specify a different name for this variable.
-
Optional: To preserve CR instances so that you can restore them after you delete CRDs, enter the following command:
$ oc get -A nncp -o yaml > cluster-nncp.yamlImportantTo reuse preserved CRs, such as NNCPs, you must uninstall the Kubernetes NMState Operator, reinstall the Kubernetes NMState Operator, and then run the following command to restore the CRs:
$ oc apply -f cluster-nncp.yamlDelete all the CRDs, such as
nmstates.nmstate.io, by running the following commands:$ oc delete crd nmstates.nmstate.io$ oc delete crd nodenetworkconfigurationenactments.nmstate.io$ oc delete crd nodenetworkstates.nmstate.io$ oc delete crd nodenetworkconfigurationpolicies.nmstate.ioDelete the namespace:
$ oc delete namespace kubernetes-nmstate
5.2. AWS Load Balancer Operator
5.2.1. AWS Load Balancer Operator release notes
The AWS Load Balancer (ALB) Operator deploys and manages an instance of the AWSLoadBalancerController resource.
The AWS Load Balancer (ALB) Operator is only supported on the x86_64 architecture.
These release notes track the development of the AWS Load Balancer Operator in OpenShift Container Platform.
For an overview of the AWS Load Balancer Operator, see AWS Load Balancer Operator in OpenShift Container Platform.
AWS Load Balancer Operator currently does not support AWS GovCloud.
5.2.1.1. AWS Load Balancer Operator 1.2.0
The following advisory is available for the AWS Load Balancer Operator version 1.2.0:
5.2.1.1.1. Notable changes
- This release supports the AWS Load Balancer Controller version 2.8.2.
-
With this release, the platform tags defined in the
Infrastructureresource will now be added to all AWS objects created by the controller.
5.2.1.2. AWS Load Balancer Operator 1.1.1
The following advisory is available for the AWS Load Balancer Operator version 1.1.1:
5.2.1.3. AWS Load Balancer Operator 1.1.0
The AWS Load Balancer Operator version 1.1.0 supports the AWS Load Balancer Controller version 2.4.4.
The following advisory is available for the AWS Load Balancer Operator version 1.1.0:
5.2.1.3.1. Notable changes
- This release uses the Kubernetes API version 0.27.2.
5.2.1.3.2. New features
- The AWS Load Balancer Operator now supports a standardized Security Token Service (STS) flow by using the Cloud Credential Operator.
5.2.1.3.3. Bug fixes
A FIPS-compliant cluster must use TLS version 1.2. Previously, webhooks for the AWS Load Balancer Controller only accepted TLS 1.3 as the minimum version, resulting in an error such as the following on a FIPS-compliant cluster:
remote error: tls: protocol version not supportedNow, the AWS Load Balancer Controller accepts TLS 1.2 as the minimum TLS version, resolving this issue. (OCPBUGS-14846)
5.2.1.4. AWS Load Balancer Operator 1.0.1
The following advisory is available for the AWS Load Balancer Operator version 1.0.1:
5.2.1.5. AWS Load Balancer Operator 1.0.0
The AWS Load Balancer Operator is now generally available with this release. The AWS Load Balancer Operator version 1.0.0 supports the AWS Load Balancer Controller version 2.4.4.
The following advisory is available for the AWS Load Balancer Operator version 1.0.0:
The AWS Load Balancer (ALB) Operator version 1.x.x cannot upgrade automatically from the Technology Preview version 0.x.x. To upgrade from an earlier version, you must uninstall the ALB operands and delete the aws-load-balancer-operator namespace.
5.2.1.5.1. Notable changes
-
This release uses the new
v1API version.
5.2.1.5.2. Bug fixes
- Previously, the controller provisioned by the AWS Load Balancer Operator did not properly use the configuration for the cluster-wide proxy. These settings are now applied appropriately to the controller. (OCPBUGS-4052, OCPBUGS-5295)
5.2.1.6. Earlier versions
The two earliest versions of the AWS Load Balancer Operator are available as a Technology Preview. These versions should not be used in a production cluster. For more information about the support scope of Red Hat Technology Preview features, see Technology Preview Features Support Scope.
The following advisory is available for the AWS Load Balancer Operator version 0.2.0:
The following advisory is available for the AWS Load Balancer Operator version 0.0.1:
5.2.2. AWS Load Balancer Operator in OpenShift Container Platform
The AWS Load Balancer Operator deploys and manages the AWS Load Balancer Controller. You can install the AWS Load Balancer Operator from OperatorHub by using OpenShift Container Platform web console or CLI.
5.2.2.1. AWS Load Balancer Operator considerations
Review the following limitations before installing and using the AWS Load Balancer Operator:
- The IP traffic mode only works on AWS Elastic Kubernetes Service (EKS). The AWS Load Balancer Operator disables the IP traffic mode for the AWS Load Balancer Controller. As a result of disabling the IP traffic mode, the AWS Load Balancer Controller cannot use the pod readiness gate.
-
The AWS Load Balancer Operator adds command-line flags such as
--disable-ingress-class-annotationand--disable-ingress-group-name-annotationto the AWS Load Balancer Controller. Therefore, the AWS Load Balancer Operator does not allow using thekubernetes.io/ingress.classandalb.ingress.kubernetes.io/group.nameannotations in theIngressresource. -
You have configured the AWS Load Balancer Operator so that the SVC type is
NodePort(notLoadBalancerorClusterIP).
5.2.2.2. AWS Load Balancer Operator
The AWS Load Balancer Operator can tag the public subnets if the kubernetes.io/role/elb tag is missing. Also, the AWS Load Balancer Operator detects the following information from the underlying AWS cloud:
- The ID of the virtual private cloud (VPC) on which the cluster hosting the Operator is deployed in.
- Public and private subnets of the discovered VPC.
The AWS Load Balancer Operator supports the Kubernetes service resource of type LoadBalancer by using Network Load Balancer (NLB) with the instance target type only.
Procedure
To deploy the AWS Load Balancer Operator on-demand from OperatorHub, create a
Subscriptionobject by running the following command:$ oc -n aws-load-balancer-operator get sub aws-load-balancer-operator --template='{{.status.installplan.name}}{{"\n"}}'Check if the status of an install plan is
Completeby running the following command:$ oc -n aws-load-balancer-operator get ip <install_plan_name> --template='{{.status.phase}}{{"\n"}}'View the status of the
aws-load-balancer-operator-controller-managerdeployment by running the following command:$ oc get -n aws-load-balancer-operator deployment/aws-load-balancer-operator-controller-managerExample output
NAME READY UP-TO-DATE AVAILABLE AGE aws-load-balancer-operator-controller-manager 1/1 1 1 23h
5.2.2.3. Using the AWS Load Balancer Operator in an AWS VPC cluster extended into an Outpost
You can configure the AWS Load Balancer Operator to provision an AWS Application Load Balancer in an AWS VPC cluster extended into an Outpost. AWS Outposts does not support AWS Network Load Balancers. As a result, the AWS Load Balancer Operator cannot provision Network Load Balancers in an Outpost.
You can create an AWS Application Load Balancer either in the cloud subnet or in the Outpost subnet. An Application Load Balancer in the cloud can attach to cloud-based compute nodes and an Application Load Balancer in the Outpost can attach to edge compute nodes. You must annotate Ingress resources with the Outpost subnet or the VPC subnet, but not both.
Prerequisites
- You have extended an AWS VPC cluster into an Outpost.
-
You have installed the OpenShift CLI (
oc). - You have installed the AWS Load Balancer Operator and created the AWS Load Balancer Controller.
Procedure
Configure the
Ingressresource to use a specified subnet:Example
Ingressresource configurationapiVersion: networking.k8s.io/v1 kind: Ingress metadata: name: <application_name> annotations: alb.ingress.kubernetes.io/subnets: <subnet_id>1 spec: ingressClassName: alb rules: - http: paths: - path: / pathType: Exact backend: service: name: <application_name> port: number: 80- 1
- Specifies the subnet to use.
- To use the Application Load Balancer in an Outpost, specify the Outpost subnet ID.
- To use the Application Load Balancer in the cloud, you must specify at least two subnets in different availability zones.
5.2.3. Preparing an AWS STS cluster for the AWS Load Balancer Operator
You can install the Amazon Web Services (AWS) Load Balancer Operator on a cluster that uses the Security Token Service (STS). Follow these steps to prepare your cluster before installing the Operator.
The AWS Load Balancer Operator relies on the CredentialsRequest object to bootstrap the Operator and the AWS Load Balancer Controller. The AWS Load Balancer Operator waits until the required secrets are created and available.
5.2.3.1. Prerequisites
-
You installed the OpenShift CLI (
oc). You know the infrastructure ID of your cluster. To show this ID, run the following command in your CLI:
$ oc get infrastructure cluster -o=jsonpath="{.status.infrastructureName}"You know the OpenID Connect (OIDC) DNS information for your cluster. To show this information, enter the following command in your CLI:
$ oc get authentication.config cluster -o=jsonpath="{.spec.serviceAccountIssuer}"1 - 1
- An OIDC DNS example is
https://rh-oidc.s3.us-east-1.amazonaws.com/28292va7ad7mr9r4he1fb09b14t59t4f.
-
You logged into the AWS Web Console, navigated to IAM → Access management → Identity providers, and located the OIDC Amazon Resource Name (ARN) information. An OIDC ARN example is
arn:aws:iam::777777777777:oidc-provider/<oidc_dns_url>.
5.2.3.2. Creating an IAM role for the AWS Load Balancer Operator
An additional Amazon Web Services (AWS) Identity and Access Management (IAM) role is required to successfully install the AWS Load Balancer Operator on a cluster that uses STS. The IAM role is required to interact with subnets and Virtual Private Clouds (VPCs). The AWS Load Balancer Operator generates the CredentialsRequest object with the IAM role to bootstrap itself.
You can create the IAM role by using the following options:
-
Using the Cloud Credential Operator utility (
ccoctl) and a predefinedCredentialsRequestobject. - Using the AWS CLI and predefined AWS manifests.
Use the AWS CLI if your environment does not support the ccoctl command.
5.2.3.2.1. Creating an AWS IAM role by using the Cloud Credential Operator utility
You can use the Cloud Credential Operator utility (ccoctl) to create an AWS IAM role for the AWS Load Balancer Operator. An AWS IAM role interacts with subnets and Virtual Private Clouds (VPCs).
Prerequisites
-
You must extract and prepare the
ccoctlbinary.
Procedure
Download the
CredentialsRequestcustom resource (CR) and store it in a directory by running the following command:$ curl --create-dirs -o <credentials_requests_dir>/operator.yaml https://raw.githubusercontent.com/openshift/aws-load-balancer-operator/main/hack/operator-credentials-request.yamlUse the
ccoctlutility to create an AWS IAM role by running the following command:$ ccoctl aws create-iam-roles \ --name <name> \ --region=<aws_region> \ --credentials-requests-dir=<credentials_requests_dir> \ --identity-provider-arn <oidc_arn>Example output
2023/09/12 11:38:57 Role arn:aws:iam::777777777777:role/<name>-aws-load-balancer-operator-aws-load-balancer-operator created1 2023/09/12 11:38:57 Saved credentials configuration to: /home/user/<credentials_requests_dir>/manifests/aws-load-balancer-operator-aws-load-balancer-operator-credentials.yaml 2023/09/12 11:38:58 Updated Role policy for Role <name>-aws-load-balancer-operator-aws-load-balancer-operator created- 1
- Note the Amazon Resource Name (ARN) of an AWS IAM role that was created for the AWS Load Balancer Operator, such as
arn:aws:iam::777777777777:role/<name>-aws-load-balancer-operator-aws-load-balancer-operator.
NoteThe length of an AWS IAM role name must be less than or equal to 12 characters.
5.2.3.2.2. Creating an AWS IAM role by using the AWS CLI
You can use the AWS Command Line Interface to create an IAM role for the AWS Load Balancer Operator. The IAM role is used to interact with subnets and Virtual Private Clouds (VPCs).
Prerequisites
-
You must have access to the AWS Command Line Interface (
aws).
Procedure
Generate a trust policy file by using your identity provider by running the following command:
$ cat <<EOF > albo-operator-trust-policy.json { "Version": "2012-10-17", "Statement": [ { "Effect": "Allow", "Principal": { "Federated": "<oidc_arn>"1 }, "Action": "sts:AssumeRoleWithWebIdentity", "Condition": { "StringEquals": { "<cluster_oidc_endpoint>:sub": "system:serviceaccount:aws-load-balancer-operator:aws-load-balancer-operator-controller-manager"2 } } } ] } EOF- 1
- Specifies the Amazon Resource Name (ARN) of the OIDC identity provider, such as
arn:aws:iam::777777777777:oidc-provider/rh-oidc.s3.us-east-1.amazonaws.com/28292va7ad7mr9r4he1fb09b14t59t4f. - 2
- Specifies the service account for the AWS Load Balancer Controller. An example of
<cluster_oidc_endpoint>isrh-oidc.s3.us-east-1.amazonaws.com/28292va7ad7mr9r4he1fb09b14t59t4f.
Create the IAM role with the generated trust policy by running the following command:
$ aws iam create-role --role-name albo-operator --assume-role-policy-document file://albo-operator-trust-policy.jsonExample output
ROLE arn:aws:iam::<aws_account_number>:role/albo-operator 2023-08-02T12:13:22Z1 ASSUMEROLEPOLICYDOCUMENT 2012-10-17 STATEMENT sts:AssumeRoleWithWebIdentity Allow STRINGEQUALS system:serviceaccount:aws-load-balancer-operator:aws-load-balancer-controller-manager PRINCIPAL arn:aws:iam:<aws_account_number>:oidc-provider/<cluster_oidc_endpoint>- 1
- Note the ARN of the created AWS IAM role that was created for the AWS Load Balancer Operator, such as
arn:aws:iam::777777777777:role/albo-operator.
Download the permission policy for the AWS Load Balancer Operator by running the following command:
$ curl -o albo-operator-permission-policy.json https://raw.githubusercontent.com/openshift/aws-load-balancer-operator/main/hack/operator-permission-policy.jsonAttach the permission policy for the AWS Load Balancer Controller to the IAM role by running the following command:
$ aws iam put-role-policy --role-name albo-operator --policy-name perms-policy-albo-operator --policy-document file://albo-operator-permission-policy.json
5.2.3.3. Configuring the ARN role for the AWS Load Balancer Operator
You can configure the Amazon Resource Name (ARN) role for the AWS Load Balancer Operator as an environment variable. You can configure the ARN role by using the CLI.
Prerequisites
-
You have installed the OpenShift CLI (
oc).
Procedure
Create the
aws-load-balancer-operatorproject by running the following command:$ oc new-project aws-load-balancer-operatorCreate the
OperatorGroupobject by running the following command:$ cat <<EOF | oc apply -f - apiVersion: operators.coreos.com/v1 kind: OperatorGroup metadata: name: aws-load-balancer-operator namespace: aws-load-balancer-operator spec: targetNamespaces: [] EOFCreate the
Subscriptionobject by running the following command:$ cat <<EOF | oc apply -f - apiVersion: operators.coreos.com/v1alpha1 kind: Subscription metadata: name: aws-load-balancer-operator namespace: aws-load-balancer-operator spec: channel: stable-v1 name: aws-load-balancer-operator source: redhat-operators sourceNamespace: openshift-marketplace config: env: - name: ROLEARN value: "<albo_role_arn>"1 EOF- 1
- Specifies the ARN role to be used in the
CredentialsRequestto provision the AWS credentials for the AWS Load Balancer Operator. An example for<albo_role_arn>isarn:aws:iam::<aws_account_number>:role/albo-operator.
NoteThe AWS Load Balancer Operator waits until the secret is created before moving to the
Availablestatus.
5.2.3.4. Creating an IAM role for the AWS Load Balancer Controller
The CredentialsRequest object for the AWS Load Balancer Controller must be set with a manually provisioned IAM role.
You can create the IAM role by using the following options:
-
Using the Cloud Credential Operator utility (
ccoctl) and a predefinedCredentialsRequestobject. - Using the AWS CLI and predefined AWS manifests.
Use the AWS CLI if your environment does not support the ccoctl command.
5.2.3.4.1. Creating an AWS IAM role for the controller by using the Cloud Credential Operator utility
You can use the Cloud Credential Operator utility (ccoctl) to create an AWS IAM role for the AWS Load Balancer Controller. An AWS IAM role is used to interact with subnets and Virtual Private Clouds (VPCs).
Prerequisites
-
You must extract and prepare the
ccoctlbinary.
Procedure
Download the
CredentialsRequestcustom resource (CR) and store it in a directory by running the following command:$ curl --create-dirs -o <credentials_requests_dir>/controller.yaml https://raw.githubusercontent.com/openshift/aws-load-balancer-operator/main/hack/controller/controller-credentials-request.yamlUse the
ccoctlutility to create an AWS IAM role by running the following command:$ ccoctl aws create-iam-roles \ --name <name> \ --region=<aws_region> \ --credentials-requests-dir=<credentials_requests_dir> \ --identity-provider-arn <oidc_arn>Example output
2023/09/12 11:38:57 Role arn:aws:iam::777777777777:role/<name>-aws-load-balancer-operator-aws-load-balancer-controller created1 2023/09/12 11:38:57 Saved credentials configuration to: /home/user/<credentials_requests_dir>/manifests/aws-load-balancer-operator-aws-load-balancer-controller-credentials.yaml 2023/09/12 11:38:58 Updated Role policy for Role <name>-aws-load-balancer-operator-aws-load-balancer-controller created- 1
- Note the Amazon Resource Name (ARN) of an AWS IAM role that was created for the AWS Load Balancer Controller, such as
arn:aws:iam::777777777777:role/<name>-aws-load-balancer-operator-aws-load-balancer-controller.
NoteThe length of an AWS IAM role name must be less than or equal to 12 characters.
5.2.3.4.2. Creating an AWS IAM role for the controller by using the AWS CLI
You can use the AWS command-line interface to create an AWS IAM role for the AWS Load Balancer Controller. An AWS IAM role is used to interact with subnets and Virtual Private Clouds (VPCs).
Prerequisites
-
You must have access to the AWS command-line interface (
aws).
Procedure
Generate a trust policy file using your identity provider by running the following command:
$ cat <<EOF > albo-controller-trust-policy.json { "Version": "2012-10-17", "Statement": [ { "Effect": "Allow", "Principal": { "Federated": "<oidc_arn>"1 }, "Action": "sts:AssumeRoleWithWebIdentity", "Condition": { "StringEquals": { "<cluster_oidc_endpoint>:sub": "system:serviceaccount:aws-load-balancer-operator:aws-load-balancer-operator-controller-manager"2 } } } ] } EOF- 1
- Specifies the Amazon Resource Name (ARN) of the OIDC identity provider, such as
arn:aws:iam::777777777777:oidc-provider/rh-oidc.s3.us-east-1.amazonaws.com/28292va7ad7mr9r4he1fb09b14t59t4f. - 2
- Specifies the service account for the AWS Load Balancer Controller. An example of
<cluster_oidc_endpoint>isrh-oidc.s3.us-east-1.amazonaws.com/28292va7ad7mr9r4he1fb09b14t59t4f.
Create an AWS IAM role with the generated trust policy by running the following command:
$ aws iam create-role --role-name albo-controller --assume-role-policy-document file://albo-controller-trust-policy.jsonExample output
ROLE arn:aws:iam::<aws_account_number>:role/albo-controller 2023-08-02T12:13:22Z1 ASSUMEROLEPOLICYDOCUMENT 2012-10-17 STATEMENT sts:AssumeRoleWithWebIdentity Allow STRINGEQUALS system:serviceaccount:aws-load-balancer-operator:aws-load-balancer-operator-controller-manager PRINCIPAL arn:aws:iam:<aws_account_number>:oidc-provider/<cluster_oidc_endpoint>- 1
- Note the ARN of an AWS IAM role for the AWS Load Balancer Controller, such as
arn:aws:iam::777777777777:role/albo-controller.
Download the permission policy for the AWS Load Balancer Controller by running the following command:
$ curl -o albo-controller-permission-policy.json https://raw.githubusercontent.com/openshift/aws-load-balancer-operator/main/assets/iam-policy.jsonAttach the permission policy for the AWS Load Balancer Controller to an AWS IAM role by running the following command:
$ aws iam put-role-policy --role-name albo-controller --policy-name perms-policy-albo-controller --policy-document file://albo-controller-permission-policy.jsonCreate a YAML file that defines the
AWSLoadBalancerControllerobject:Example
sample-aws-lb-manual-creds.yamlfileapiVersion: networking.olm.openshift.io/v1 kind: AWSLoadBalancerController1 metadata: name: cluster2 spec: credentialsRequestConfig: stsIAMRoleARN: <albc_role_arn>3 - 1
- Defines the
AWSLoadBalancerControllerobject. - 2
- Defines the AWS Load Balancer Controller name. All related resources use this instance name as a suffix.
- 3
- Specifies the ARN role for the AWS Load Balancer Controller. The
CredentialsRequestobject uses this ARN role to provision the AWS credentials. An example of<albc_role_arn>isarn:aws:iam::777777777777:role/albo-controller.
5.2.4. Installing the AWS Load Balancer Operator
The AWS Load Balancer Operator deploys and manages the AWS Load Balancer Controller. You can install the AWS Load Balancer Operator from the OperatorHub by using OpenShift Container Platform web console or CLI.
5.2.4.1. Installing the AWS Load Balancer Operator by using the web console
You can install the AWS Load Balancer Operator by using the web console.
Prerequisites
-
You have logged in to the OpenShift Container Platform web console as a user with
cluster-adminpermissions. - Your cluster is configured with AWS as the platform type and cloud provider.
- If you are using a security token service (STS) or user-provisioned infrastructure, follow the related preparation steps. For example, if you are using AWS Security Token Service, see "Preparing for the AWS Load Balancer Operator on a cluster using the AWS Security Token Service (STS)".
Procedure
- Navigate to Operators → OperatorHub in the OpenShift Container Platform web console.
- Select the AWS Load Balancer Operator. You can use the Filter by keyword text box or use the filter list to search for the AWS Load Balancer Operator from the list of Operators.
-
Select the
aws-load-balancer-operatornamespace. On the Install Operator page, select the following options:
- Update the channel as stable-v1.
- Installation mode as All namespaces on the cluster (default).
-
Installed Namespace as
aws-load-balancer-operator. If theaws-load-balancer-operatornamespace does not exist, it gets created during the Operator installation. - Select Update approval as Automatic or Manual. By default, the Update approval is set to Automatic. If you select automatic updates, the Operator Lifecycle Manager (OLM) automatically upgrades the running instance of your Operator without any intervention. If you select manual updates, the OLM creates an update request. As a cluster administrator, you must then manually approve that update request to update the Operator updated to the new version.
- Click Install.
Verification
- Verify that the AWS Load Balancer Operator shows the Status as Succeeded on the Installed Operators dashboard.
5.2.4.2. Installing the AWS Load Balancer Operator by using the CLI
You can install the AWS Load Balancer Operator by using the CLI.
Prerequisites
-
You are logged in to the OpenShift Container Platform web console as a user with
cluster-adminpermissions. - Your cluster is configured with AWS as the platform type and cloud provider.
-
You are logged into the OpenShift CLI (
oc).
Procedure
Create a
Namespaceobject:Create a YAML file that defines the
Namespaceobject:Example
namespace.yamlfileapiVersion: v1 kind: Namespace metadata: name: aws-load-balancer-operatorCreate the
Namespaceobject by running the following command:$ oc apply -f namespace.yaml
Create an
OperatorGroupobject:Create a YAML file that defines the
OperatorGroupobject:Example
operatorgroup.yamlfileapiVersion: operators.coreos.com/v1 kind: OperatorGroup metadata: name: aws-lb-operatorgroup namespace: aws-load-balancer-operator spec: upgradeStrategy: DefaultCreate the
OperatorGroupobject by running the following command:$ oc apply -f operatorgroup.yaml
Create a
Subscriptionobject:Create a YAML file that defines the
Subscriptionobject:Example
subscription.yamlfileapiVersion: operators.coreos.com/v1alpha1 kind: Subscription metadata: name: aws-load-balancer-operator namespace: aws-load-balancer-operator spec: channel: stable-v1 installPlanApproval: Automatic name: aws-load-balancer-operator source: redhat-operators sourceNamespace: openshift-marketplaceCreate the
Subscriptionobject by running the following command:$ oc apply -f subscription.yaml
Verification
Get the name of the install plan from the subscription:
$ oc -n aws-load-balancer-operator \ get subscription aws-load-balancer-operator \ --template='{{.status.installplan.name}}{{"\n"}}'Check the status of the install plan:
$ oc -n aws-load-balancer-operator \ get ip <install_plan_name> \ --template='{{.status.phase}}{{"\n"}}'The output must be
Complete.
5.2.4.3. Creating the AWS Load Balancer Controller
You can install only a single instance of the AWSLoadBalancerController object in a cluster. You can create the AWS Load Balancer Controller by using CLI. The AWS Load Balancer Operator reconciles only the cluster named resource.
Prerequisites
-
You have created the
echoservernamespace. -
You have access to the OpenShift CLI (
oc).
Procedure
Create a YAML file that defines the
AWSLoadBalancerControllerobject:Example
sample-aws-lb.yamlfileapiVersion: networking.olm.openshift.io/v1 kind: AWSLoadBalancerController1 metadata: name: cluster2 spec: subnetTagging: Auto3 additionalResourceTags:4 - key: example.org/security-scope value: staging ingressClass: alb5 config: replicas: 26 enabledAddons:7 - AWSWAFv28 - 1
- Defines the
AWSLoadBalancerControllerobject. - 2
- Defines the AWS Load Balancer Controller name. This instance name gets added as a suffix to all related resources.
- 3
- Configures the subnet tagging method for the AWS Load Balancer Controller. The following values are valid:
-
Auto: The AWS Load Balancer Operator determines the subnets that belong to the cluster and tags them appropriately. The Operator cannot determine the role correctly if the internal subnet tags are not present on internal subnet. -
Manual: You manually tag the subnets that belong to the cluster with the appropriate role tags. Use this option if you installed your cluster on user-provided infrastructure.
-
- 4
- Defines the tags used by the AWS Load Balancer Controller when it provisions AWS resources.
- 5
- Defines the ingress class name. The default value is
alb. - 6
- Specifies the number of replicas of the AWS Load Balancer Controller.
- 7
- Specifies annotations as an add-on for the AWS Load Balancer Controller.
- 8
- Enables the
alb.ingress.kubernetes.io/wafv2-acl-arnannotation.
Create the
AWSLoadBalancerControllerobject by running the following command:$ oc create -f sample-aws-lb.yamlCreate a YAML file that defines the
Deploymentresource:Example
sample-aws-lb.yamlfileapiVersion: apps/v1 kind: Deployment1 metadata: name: <echoserver>2 namespace: echoserver spec: selector: matchLabels: app: echoserver replicas: 33 template: metadata: labels: app: echoserver spec: containers: - image: openshift/origin-node command: - "/bin/socat" args: - TCP4-LISTEN:8080,reuseaddr,fork - EXEC:'/bin/bash -c \"printf \\\"HTTP/1.0 200 OK\r\n\r\n\\\"; sed -e \\\"/^\r/q\\\"\"' imagePullPolicy: Always name: echoserver ports: - containerPort: 8080Create a YAML file that defines the
Serviceresource:Example
service-albo.yamlfileapiVersion: v1 kind: Service1 metadata: name: <echoserver>2 namespace: echoserver spec: ports: - port: 80 targetPort: 8080 protocol: TCP type: NodePort selector: app: echoserverCreate a YAML file that defines the
Ingressresource:Example
ingress-albo.yamlfileapiVersion: networking.k8s.io/v1 kind: Ingress metadata: name: <name>1 namespace: echoserver annotations: alb.ingress.kubernetes.io/scheme: internet-facing alb.ingress.kubernetes.io/target-type: instance spec: ingressClassName: alb rules: - http: paths: - path: / pathType: Exact backend: service: name: <echoserver>2 port: number: 80
Verification
Save the status of the
Ingressresource in theHOSTvariable by running the following command:$ HOST=$(oc get ingress -n echoserver echoserver --template='{{(index .status.loadBalancer.ingress 0).hostname}}')Verify the status of the
Ingressresource by running the following command:$ curl $HOST
5.2.5. Configuring the AWS Load Balancer Operator
5.2.5.1. Trusting the certificate authority of the cluster-wide proxy
You can configure the cluster-wide proxy in the AWS Load Balancer Operator. After configuring the cluster-wide proxy, Operator Lifecycle Manager (OLM) automatically updates all the deployments of the Operators with the environment variables such as HTTP_PROXY, HTTPS_PROXY, and NO_PROXY. These variables are populated to the managed controller by the AWS Load Balancer Operator.
Create the config map to contain the certificate authority (CA) bundle in the
aws-load-balancer-operatornamespace by running the following command:$ oc -n aws-load-balancer-operator create configmap trusted-caTo inject the trusted CA bundle into the config map, add the
config.openshift.io/inject-trusted-cabundle=truelabel to the config map by running the following command:$ oc -n aws-load-balancer-operator label cm trusted-ca config.openshift.io/inject-trusted-cabundle=trueUpdate the AWS Load Balancer Operator subscription to access the config map in the AWS Load Balancer Operator deployment by running the following command:
$ oc -n aws-load-balancer-operator patch subscription aws-load-balancer-operator --type='merge' -p '{"spec":{"config":{"env":[{"name":"TRUSTED_CA_CONFIGMAP_NAME","value":"trusted-ca"}],"volumes":[{"name":"trusted-ca","configMap":{"name":"trusted-ca"}}],"volumeMounts":[{"name":"trusted-ca","mountPath":"/etc/pki/tls/certs/albo-tls-ca-bundle.crt","subPath":"ca-bundle.crt"}]}}}'After the AWS Load Balancer Operator is deployed, verify that the CA bundle is added to the
aws-load-balancer-operator-controller-managerdeployment by running the following command:$ oc -n aws-load-balancer-operator exec deploy/aws-load-balancer-operator-controller-manager -c manager -- bash -c "ls -l /etc/pki/tls/certs/albo-tls-ca-bundle.crt; printenv TRUSTED_CA_CONFIGMAP_NAME"Example output
-rw-r--r--. 1 root 1000690000 5875 Jan 11 12:25 /etc/pki/tls/certs/albo-tls-ca-bundle.crt trusted-caOptional: Restart deployment of the AWS Load Balancer Operator every time the config map changes by running the following command:
$ oc -n aws-load-balancer-operator rollout restart deployment/aws-load-balancer-operator-controller-manager
5.2.5.2. Adding TLS termination on the AWS Load Balancer
You can route the traffic for the domain to pods of a service and add TLS termination on the AWS Load Balancer.
Prerequisites
-
You have an access to the OpenShift CLI (
oc).
Procedure
Create a YAML file that defines the
AWSLoadBalancerControllerresource:Example
add-tls-termination-albc.yamlfileapiVersion: networking.olm.openshift.io/v1 kind: AWSLoadBalancerController metadata: name: cluster spec: subnetTagging: Auto ingressClass: tls-termination1 - 1
- Defines the ingress class name. If the ingress class is not present in your cluster the AWS Load Balancer Controller creates one. The AWS Load Balancer Controller reconciles the additional ingress class values if
spec.controlleris set toingress.k8s.aws/alb.
Create a YAML file that defines the
Ingressresource:Example
add-tls-termination-ingress.yamlfileapiVersion: networking.k8s.io/v1 kind: Ingress metadata: name: <example>1 annotations: alb.ingress.kubernetes.io/scheme: internet-facing2 alb.ingress.kubernetes.io/certificate-arn: arn:aws:acm:us-west-2:xxxxx3 spec: ingressClassName: tls-termination4 rules: - host: example.com5 http: paths: - path: / pathType: Exact backend: service: name: <example_service>6 port: number: 80- 1
- Specifies the ingress name.
- 2
- The controller provisions the load balancer for ingress in a public subnet to access the load balancer over the internet.
- 3
- The Amazon Resource Name (ARN) of the certificate that you attach to the load balancer.
- 4
- Defines the ingress class name.
- 5
- Defines the domain for traffic routing.
- 6
- Defines the service for traffic routing.
5.2.5.3. Creating multiple ingress resources through a single AWS Load Balancer
You can route the traffic to different services with multiple ingress resources that are part of a single domain through a single AWS Load Balancer. Each ingress resource provides different endpoints of the domain.
Prerequisites
-
You have an access to the OpenShift CLI (
oc).
Procedure
Create an
IngressClassParamsresource YAML file, for example,sample-single-lb-params.yaml, as follows:apiVersion: elbv2.k8s.aws/v1beta11 kind: IngressClassParams metadata: name: single-lb-params2 spec: group: name: single-lb3 Create the
IngressClassParamsresource by running the following command:$ oc create -f sample-single-lb-params.yamlCreate the
IngressClassresource YAML file, for example,sample-single-lb-class.yaml, as follows:apiVersion: networking.k8s.io/v11 kind: IngressClass metadata: name: single-lb2 spec: controller: ingress.k8s.aws/alb3 parameters: apiGroup: elbv2.k8s.aws4 kind: IngressClassParams5 name: single-lb-params6 - 1
- Defines the API group and version of the
IngressClassresource. - 2
- Specifies the ingress class name.
- 3
- Defines the controller name. The
ingress.k8s.aws/albvalue denotes that all ingress resources of this class should be managed by the AWS Load Balancer Controller. - 4
- Defines the API group of the
IngressClassParamsresource. - 5
- Defines the resource type of the
IngressClassParamsresource. - 6
- Defines the
IngressClassParamsresource name.
Create the
IngressClassresource by running the following command:$ oc create -f sample-single-lb-class.yamlCreate the
AWSLoadBalancerControllerresource YAML file, for example,sample-single-lb.yaml, as follows:apiVersion: networking.olm.openshift.io/v1 kind: AWSLoadBalancerController metadata: name: cluster spec: subnetTagging: Auto ingressClass: single-lb1 - 1
- Defines the name of the
IngressClassresource.
Create the
AWSLoadBalancerControllerresource by running the following command:$ oc create -f sample-single-lb.yamlCreate the
Ingressresource YAML file, for example,sample-multiple-ingress.yaml, as follows:apiVersion: networking.k8s.io/v1 kind: Ingress metadata: name: example-11 annotations: alb.ingress.kubernetes.io/scheme: internet-facing2 alb.ingress.kubernetes.io/group.order: "1"3 alb.ingress.kubernetes.io/target-type: instance4 spec: ingressClassName: single-lb5 rules: - host: example.com6 http: paths: - path: /blog7 pathType: Prefix backend: service: name: example-18 port: number: 809 --- apiVersion: networking.k8s.io/v1 kind: Ingress metadata: name: example-2 annotations: alb.ingress.kubernetes.io/scheme: internet-facing alb.ingress.kubernetes.io/group.order: "2" alb.ingress.kubernetes.io/target-type: instance spec: ingressClassName: single-lb rules: - host: example.com http: paths: - path: /store pathType: Prefix backend: service: name: example-2 port: number: 80 --- apiVersion: networking.k8s.io/v1 kind: Ingress metadata: name: example-3 annotations: alb.ingress.kubernetes.io/scheme: internet-facing alb.ingress.kubernetes.io/group.order: "3" alb.ingress.kubernetes.io/target-type: instance spec: ingressClassName: single-lb rules: - host: example.com http: paths: - path: / pathType: Prefix backend: service: name: example-3 port: number: 80- 1
- Specifies the ingress name.
- 2
- Indicates the load balancer to provision in the public subnet to access the internet.
- 3
- Specifies the order in which the rules from the multiple ingress resources are matched when the request is received at the load balancer.
- 4
- Indicates that the load balancer will target OpenShift Container Platform nodes to reach the service.
- 5
- Specifies the ingress class that belongs to this ingress.
- 6
- Defines a domain name used for request routing.
- 7
- Defines the path that must route to the service.
- 8
- Defines the service name that serves the endpoint configured in the
Ingressresource. - 9
- Defines the port on the service that serves the endpoint.
Create the
Ingressresource by running the following command:$ oc create -f sample-multiple-ingress.yaml
5.2.5.4. AWS Load Balancer Operator logs
You can view the AWS Load Balancer Operator logs by using the oc logs command.
Procedure
View the logs of the AWS Load Balancer Operator by running the following command:
$ oc logs -n aws-load-balancer-operator deployment/aws-load-balancer-operator-controller-manager -c manager
5.3. External DNS Operator
5.3.1. External DNS Operator release notes
The External DNS Operator deploys and manages ExternalDNS to provide name resolution for services and routes. This enables your external DNS provider to resolve hostnames directly to OpenShift Container Platform resources.
The External DNS Operator is only supported on the x86_64 architecture.
These release notes track the development of the External DNS Operator in OpenShift Container Platform.
5.3.1.1. External DNS Operator 1.2
The External DNS Operator 1.2 release notes summarize all new features and enhancements, notable technical changes, major corrections from previous versions, and any known bugs upon general availability.
- External DNS Operator 1.2.0
The following advisory is available for the External DNS Operator version 1.2.0:
RHEA-2022:5867 ExternalDNS Operator 1.2 Operator or operand containers
New features:
The External DNS Operator now supports AWS shared VPC. For more information, "Creating DNS records in a different AWS Account using a shared VPC".
Bug fixes
-
The update strategy for the operand changed from
RollingtoRecreate. (OCPBUGS-3630)
5.3.1.2. External DNS Operator 1.1
The External DNS Operator 1.1 release notes summarize all new features and enhancements, notable technical changes, major corrections from previous versions, and any known bugs upon general availability.
- External DNS Operator 1.1.1
The following advisory is available for the External DNS Operator version 1.1.1:
- External DNS Operator 1.1.0
This release included a rebase of the operand from the upstream project version 0.13.1. The following advisory is available for the External DNS Operator version 1.1.0:
RHEA-2022:9086-01 ExternalDNS Operator 1.1 Operator or operand containers
Bug fixes:
-
Previously, the ExternalDNS Operator enforced an empty
defaultModevalue for volumes, which caused constant updates due to a conflict with the OpenShift API. Now, thedefaultModevalue is not enforced and operand deployment does not update constantly. (OCPBUGS-2793)
5.3.1.3. External DNS Operator 1.0
The External DNS Operator 1.0 release notes summarize all new features and enhancements, notable technical changes, major corrections from previous versions, and any known bugs upon general availability.
- External DNS Operator 1.0.1
The following advisory is available for the External DNS Operator version 1.0.1:
- External DNS Operator 1.0.0
The following advisory is available for the External DNS Operator version 1.0.0:
RHEA-2022:5867 ExternalDNS Operator 1.0 Operator or operand containers
Bug fixes:
- Previously, the External DNS Operator issued a warning about the violation of the restricted SCC policy during ExternalDNS operand pod deployments. This issue has been resolved. (BZ#2086408)
5.3.2. Understanding the External DNS Operator
To provide name resolution for services and routes from an External DNS provider to OpenShift Container Platform, use the External DNS Operator. This Operator deploys and manages ExternalDNS to synchronize your cluster resources with the external provider.
5.3.2.1. External DNS Operator domain name limitations
To prevent configuration errors when deploying the ExternalDNS resource, review the domain name limitations enforced by the External DNS Operator. Understanding these constraints ensures that your requested hostnames and domains are compatible with your underlying DNS provider.
The External DNS Operator uses the TXT registry that adds the prefix for TXT records. This reduces the maximum length of the domain name for TXT records. A DNS record cannot be present without a corresponding TXT record, so the domain name of the DNS record must follow the same limit as the TXT records. For example, a DNS record of <domain_name_from_source> results in a TXT record of external-dns-<record_type>-<domain_name_from_source>.
The domain name of the DNS records generated by the External DNS Operator has the following limitations:
| Record type | Number of characters |
|---|---|
| CNAME | 44 |
| Wildcard CNAME records on AzureDNS | 42 |
| A | 48 |
| Wildcard A records on AzureDNS | 46 |
The following error shows in the External DNS Operator logs if the generated domain name exceeds any of the domain name limitations:
time="2022-09-02T08:53:57Z" level=error msg="Failure in zone test.example.io. [Id: /hostedzone/Z06988883Q0H0RL6UMXXX]"
time="2022-09-02T08:53:57Z" level=error msg="InvalidChangeBatch: [FATAL problem: DomainLabelTooLong (Domain label is too long) encountered with 'external-dns-a-hello-openshift-aaaaaaaaaa-bbbbbbbbbb-ccccccc']\n\tstatus code: 400, request id: e54dfd5a-06c6-47b0-bcb9-a4f7c3a4e0c6"5.3.2.2. Deploying the External DNS Operator
You can deploy the External DNS Operator on-demand from the Software Catalog. Deploying the External DNS Operator creates a Subscription object.
The External DNS Operator implements the External DNS API from the olm.openshift.io API group. The External DNS Operator updates services, routes, and external DNS providers.
Prerequisites
-
You have installed the
yqCLI tool.
Procedure
Check the name of an install plan, such as
install-zcvlr, by running the following command:$ oc -n external-dns-operator get sub external-dns-operator -o yaml | yq '.status.installplan.name'Check if the status of an install plan is
Completeby running the following command:$ oc -n external-dns-operator get ip <install_plan_name> -o yaml | yq '.status.phase'View the status of the
external-dns-operatordeployment by running the following command:$ oc get -n external-dns-operator deployment/external-dns-operatorExample output
NAME READY UP-TO-DATE AVAILABLE AGE external-dns-operator 1/1 1 1 23h
5.3.2.3. Viewing External DNS Operator logs
To troubleshoot DNS configuration issues, view the External DNS Operator logs. Use the oc logs command to retrieve diagnostic information directly from the Operator pod.
Procedure
View the logs of the External DNS Operator by running the following command:
$ oc logs -n external-dns-operator deployment/external-dns-operator -c external-dns-operator
5.3.3. Installing the External DNS Operator
To manage DNS records on your cloud infrastructure, install the External DNS Operator. This Operator supports deployment on major cloud providers, including Amazon Web Services (AWS), Microsoft Azure, and Google Cloud.
5.3.3.1. Installing the External DNS Operator with OperatorHub
You can install the External DNS Operator by using the OpenShift Container Platform OperatorHub. You can then manage the Operator lifecycle directly from the web console.
Procedure
- Click Operators → OperatorHub in the OpenShift Container Platform web console.
- Click External DNS Operator. You can use the Filter by keyword text box or the filter list to search for External DNS Operator from the list of Operators.
-
Select the
external-dns-operatornamespace. - On the External DNS Operator page, click Install.
On the Install Operator page, ensure that you selected the following options:
- Update the channel as stable-v1.
- Installation mode as A specific name on the cluster.
-
Installed namespace as
external-dns-operator. If namespaceexternal-dns-operatordoes not exist, the Operator gets created during the Operator installation. - Select Approval Strategy as Automatic or Manual. The Approval Strategy defaults to Automatic.
Click Install.
If you select Automatic updates, the Operator Lifecycle Manager (OLM) automatically upgrades the running instance of your Operator without any intervention.
If you select Manual updates, the OLM creates an update request. As a cluster administrator, you must then manually approve that update request to have the Operator updated to the new version.
Verification
- Verify that the External DNS Operator shows the Status as Succeeded on the Installed Operators dashboard.
5.3.3.2. Installing the External DNS Operator by using the CLI
You can use the OpenShift CLI (oc) to install the External DNS Operator. The Operator manages the installation process directly from your terminal without you having to use the web console.
Prerequisites
-
You are logged in to the OpenShift CLI (
oc).
Procedure
Create a
Namespaceobject:Create a YAML file that defines the
Namespaceobject:Example
namespace.yamlfileapiVersion: v1 kind: Namespace metadata: name: external-dns-operator # ...Create the
Namespaceobject by running the following command:$ oc apply -f namespace.yaml
Create an
OperatorGroupobject:Create a YAML file that defines the
OperatorGroupobject:Example
operatorgroup.yamlfileapiVersion: operators.coreos.com/v1 kind: OperatorGroup metadata: name: external-dns-operator namespace: external-dns-operator spec: upgradeStrategy: Default targetNamespaces: - external-dns-operator # ...Create the
OperatorGroupobject by running the following command:$ oc apply -f operatorgroup.yaml
Create a
Subscriptionobject:Create a YAML file that defines the
Subscriptionobject:Example
subscription.yamlfileapiVersion: operators.coreos.com/v1alpha1 kind: Subscription metadata: name: external-dns-operator namespace: external-dns-operator spec: channel: stable-v1 installPlanApproval: Automatic name: external-dns-operator source: redhat-operators sourceNamespace: openshift-marketplace # ...Create the
Subscriptionobject by running the following command:$ oc apply -f subscription.yaml
Verification
Get the name of the install plan from the subscription by running the following command:
$ oc -n external-dns-operator \ get subscription external-dns-operator \ --template='{{.status.installplan.name}}{{"\n"}}'Verify that the status of the install plan is
Completeby running the following command:$ oc -n external-dns-operator \ get ip <install_plan_name> \ --template='{{.status.phase}}{{"\n"}}'Verify that the status of the
external-dns-operatorpod isRunningby running the following command:$ oc -n external-dns-operator get podExample output
NAME READY STATUS RESTARTS AGE external-dns-operator-5584585fd7-5lwqm 2/2 Running 0 11mVerify that the catalog source of the subscription is
redhat-operatorsby running the following command:$ oc -n external-dns-operator get subscriptionCheck the
external-dns-operatorversion by running the following command:$ oc -n external-dns-operator get csv
5.3.4. External DNS Operator configuration parameters
To customize the behavior of the External DNS Operator, configure the available parameters in the ExternalDNS custom resource (CR). By configuraing parameters, you can control how the Operator synchronizes services and routes with your external DNS provider.
5.3.4.1. External DNS Operator configuration parameters
To customize the behavior of the External DNS Operator, configure the available parameters in the ExternalDNS custom resource (CR). By configuring parameters, you can control how the Operator synchronizes services and routes with your external DNS provider.
| Parameter | Description |
|---|---|
|
| Enables the type of a cloud provider.
|
|
|
Enables you to specify DNS zones by their domains. If you do not specify zones, the
|
|
|
Enables you to specify AWS zones by their domains. If you do not specify domains, the
|
|
|
Enables you to specify the source for the DNS records,
|
5.3.5. Creating DNS records on AWS
To create DNS records on AWS and AWS GovCloud, use the External DNS Operator. The Operator manages external name resolution for your cluster services directly through the Operator.
5.3.5.1. Creating DNS records on a public hosted zone for AWS by using Red Hat External DNS Operator
You can create DNS records on a public hosted zone for AWS by using the Red Hat External DNS Operator. You can use the same instructions to create DNS records on a hosted zone for AWS GovCloud.
Procedure
Check the user profile by running the following command. The profile, such as
system:admin, must have access to thekube-systemnamespace. If you do not have the credentials, you can fetch the credentials from thekube-systemnamespace to use the cloud provider client by running the following command:$ oc whoamiFetch the values from the
aws-credssecret that exists in thekube-systemnamespace.$ export AWS_ACCESS_KEY_ID=$(oc get secrets aws-creds -n kube-system --template={{.data.aws_access_key_id}} | base64 -d)$ export AWS_SECRET_ACCESS_KEY=$(oc get secrets aws-creds -n kube-system --template={{.data.aws_secret_access_key}} | base64 -d)Get the routes to check the domain:
$ oc get routes --all-namespaces | grep consoleExample output
openshift-console console console-openshift-console.apps.testextdnsoperator.apacshift.support console https reencrypt/Redirect None openshift-console downloads downloads-openshift-console.apps.testextdnsoperator.apacshift.support downloads http edge/Redirect NoneGet the list of DNS zones and find the DNS zone that corresponds to the domain of the route that you previously queried:
$ aws route53 list-hosted-zones | grep testextdnsoperator.apacshift.supportExample output
HOSTEDZONES terraform /hostedzone/Z02355203TNN1XXXX1J6O testextdnsoperator.apacshift.support. 5Create the
ExternalDNSCR for theroutesource:$ cat <<EOF | oc create -f - apiVersion: externaldns.olm.openshift.io/v1beta1 kind: ExternalDNS metadata: name: sample-aws spec: domains: - filterType: Include matchType: Exact name: testextdnsoperator.apacshift.support provider: type: AWS source: type: OpenShiftRoute openshiftRouteOptions: routerName: default EOFwhere:
metadata.name- Specifies the name of the external DNS resource.
spec.domains- By default all hosted zones are selected as potential targets. You can include a hosted zone that you need.
domains.matchType- Specifies that the matching of the domain from the target zone has to be exact. Exact as opposed to regular expression match.
domains.name- Specifies the exact domain of the zone you want to update. The hostname of the routes must be subdomains of the specified domain.
provider.type-
Specifies the
AWS Route53DNS provider. source- Specifies the options for the source of DNS records.
source.type-
Specifies the
OpenShiftRouteresource as the source for the DNS records which gets created in the previously specified DNS provider. openshiftRouteOptions.routerName-
If the source is
OpenShiftRoute, then you can pass the OpenShift Ingress Controller name. External DNS Operator selects the canonical hostname of that router as the target while creating the CNAME record.
Check the records created for OpenShift Container Platform routes by using the following command:
$ aws route53 list-resource-record-sets --hosted-zone-id Z02355203TNN1XXXX1J6O --query "ResourceRecordSets[?Type == 'CNAME']" | grep console
5.3.5.2. Creating DNS records in a different AWS account by using a shared VPC
To create DNS records in a different AWS account, configure the ExternalDNS Operator to use a shared Virtual Private Cloud (VPC). Your organization can then use a single Route 53 instance for name resolution across multiple accounts and projects.
Prerequisites
- You have created two Amazon AWS accounts: one with a VPC and a Route 53 private hosted zone configured (Account A), and another for installing a cluster (Account B).
- You have created an IAM Policy and IAM Role with the appropriate permissions in Account A for Account B to create DNS records in the Route 53 hosted zone of Account A.
- You have installed a cluster in Account B into the existing VPC for Account A.
- You have installed the ExternalDNS Operator in the cluster in Account B.
Procedure
Get the Role ARN of the IAM Role that you created to allow Account B to access Account A’s Route 53 hosted zone by running the following command:
$ aws --profile account-a iam get-role --role-name user-rol1 | head -1Example output
ROLE arn:aws:iam::1234567890123:role/user-rol1 2023-09-14T17:21:54+00:00 3600 / AROA3SGB2ZRKRT5NISNJN user-rol1Locate the private hosted zone to use with Account A’s credentials by running the following command:
$ aws --profile account-a route53 list-hosted-zones | grep testextdnsoperator.apacshift.supportExample output
HOSTEDZONES terraform /hostedzone/Z02355203TNN1XXXX1J6O testextdnsoperator.apacshift.support. 5Create the
ExternalDNSobject by running the following command:$ cat <<EOF | oc create -f - apiVersion: externaldns.olm.openshift.io/v1beta1 kind: ExternalDNS metadata: name: sample-aws spec: domains: - filterType: Include matchType: Exact name: testextdnsoperator.apacshift.support provider: type: AWS aws: assumeRole: arn: arn:aws:iam::12345678901234:role/user-rol1 source: type: OpenShiftRoute openshiftRouteOptions: routerName: default EOFwhere:
arn- Specifies the Role ARN to have DNS records created in Account A.
Check the records created for OpenShift Container Platform routes by entering the following command:
$ aws --profile account-a route53 list-resource-record-sets --hosted-zone-id Z02355203TNN1XXXX1J6O --query "ResourceRecordSets[?Type == 'CNAME']" | grep console-openshift-console
5.3.6. Creating DNS records on Azure
To create DNS records on Microsoft Azure, use the External DNS Operator. By using this Operator, you can manage external name resolution for your cluster services.
Using the External DNS Operator on a Microsoft Entra Workload ID-enabled cluster or a cluster that runs in Microsoft Azure Government (MAG) regions is not supported.
5.3.6.1. Creating DNS records on an Azure DNS zone
To create DNS records on a public or private DNS zone for Azure, use the External DNS Operator. The Operator manages external name resolution for your cluster.
Prerequisites
- You must have administrator privileges.
-
The
adminuser must have access to thekube-systemnamespace.
Procedure
Fetch the credentials from the
kube-systemnamespace to use the cloud provider client by running the following command:$ CLIENT_ID=$(oc get secrets azure-credentials -n kube-system --template={{.data.azure_client_id}} | base64 -d)$ CLIENT_SECRET=$(oc get secrets azure-credentials -n kube-system --template={{.data.azure_client_secret}} | base64 -d)$ RESOURCE_GROUP=$(oc get secrets azure-credentials -n kube-system --template={{.data.azure_resourcegroup}} | base64 -d)$ SUBSCRIPTION_ID=$(oc get secrets azure-credentials -n kube-system --template={{.data.azure_subscription_id}} | base64 -d)$ TENANT_ID=$(oc get secrets azure-credentials -n kube-system --template={{.data.azure_tenant_id}} | base64 -d)Log in to Azure by running the following command:
$ az login --service-principal -u "${CLIENT_ID}" -p "${CLIENT_SECRET}" --tenant "${TENANT_ID}"Get a list of routes by running the following command:
$ oc get routes --all-namespaces | grep consoleExample output
openshift-console console console-openshift-console.apps.test.azure.example.com console https reencrypt/Redirect None openshift-console downloads downloads-openshift-console.apps.test.azure.example.com downloads http edge/Redirect NoneGet a list of DNS zones.
For public DNS zones, enter the following command:
$ az network dns zone list --resource-group "${RESOURCE_GROUP}"For private DNS zones, enter the following command:
$ az network private-dns zone list -g "${RESOURCE_GROUP}"
Create a YAML file, for example,
external-dns-sample-azure.yaml, that defines theExternalDNSobject:Example
external-dns-sample-azure.yamlfileapiVersion: externaldns.olm.openshift.io/v1beta1 kind: ExternalDNS metadata: name: sample-azure spec: zones: - "/subscriptions/1234567890/resourceGroups/test-azure-xxxxx-rg/providers/Microsoft.Network/dnszones/test.azure.example.com" provider: type: Azure source: openshiftRouteOptions: routerName: default type: OpenShiftRoute # ...where:
metadata.name- Specifies the External DNS name.
spec.zones-
Specifies the zone ID. For a private DNS zone, change
dnszonestoprivateDnsZones. provider.type- Specifies the provider type.
source.openshiftRouteOptions- Specifies the options for the source of DNS records.
routerName-
If the source type is
OpenShiftRoute, you can pass the OpenShift Ingress Controller name. The External DNS Operator selects the canonical hostname of that router as the target while creating the CNAME record. source.type-
Specifies the
routeresource as the source for the Azure DNS records.
Troubleshooting
Check the records created for the routes.
For public DNS zones, enter the following command:
$ az network dns record-set list -g "${RESOURCE_GROUP}" -z "${ZONE_NAME}" | grep consoleFor private DNS zones, enter the following command:
$ az network private-dns record-set list -g "${RESOURCE_GROUP}" -z "${ZONE_NAME}" | grep console
5.3.7. Creating DNS records on Google Cloud Platform
To create DNS records on Google Cloud, use the External DNS Operator. The DNS Operator manages external name resolution for your cluster services.
Using the External DNS Operator on a cluster with Google Cloud Workload Identity enabled is not supported. For more information about the Google Cloud Workload Identity, see Google Cloud Workload Identity.
5.3.7.1. Creating DNS records on a public managed zone for Google Cloud
To create DNS records on Google Cloud, use the External DNS Operator. The DNS Operator manages external name resolution for your cluster services.
Prerequisites
- You must have administrator privileges.
Procedure
Copy the
gcp-credentialssecret in theencoded-gcloud.jsonfile by running the following command:$ oc get secret gcp-credentials -n kube-system --template='{{$v := index .data "service_account.json"}}{{$v}}' | base64 -d - > decoded-gcloud.jsonExport your Google credentials by running the following command:
$ export GOOGLE_CREDENTIALS=decoded-gcloud.jsonActivate your account by using the following command:
$ gcloud auth activate-service-account <client_email as per decoded-gcloud.json> --key-file=decoded-gcloud.jsonSet your project by running the following command:
$ gcloud config set project <project_id as per decoded-gcloud.json>Get a list of routes by running the following command:
$ oc get routes --all-namespaces | grep consoleExample output
openshift-console console console-openshift-console.apps.test.gcp.example.com console https reencrypt/Redirect None openshift-console downloads downloads-openshift-console.apps.test.gcp.example.com downloads http edge/Redirect NoneGet a list of managed zones, such as
qe-cvs4g-private-zone test.gcp.example.com, by running the following command:$ gcloud dns managed-zones list | grep test.gcp.example.comCreate a YAML file, for example,
external-dns-sample-gcp.yaml, that defines theExternalDNSobject:Example
external-dns-sample-gcp.yamlfileapiVersion: externaldns.olm.openshift.io/v1beta1 kind: ExternalDNS metadata: name: sample-gcp spec: domains: - filterType: Include matchType: Exact name: test.gcp.example.com provider: type: GCP source: openshiftRouteOptions: routerName: default type: OpenShiftRoute # ...where:
metadata.name- Specifies the External DNS name.
spec.domains.filterType- By default, all hosted zones are selected as potential targets. You can include your hosted zone.
spec.domains.matchType-
Specifies the domain of the target that must match the string defined by the
namekey. spec.domains.name- Specifies the exact domain of the zone you want to update. The hostname of the routes must be subdomains of the specified domain.
spec.provider.type- Specifies the provider type.
source.openshiftRouteOptions- Specifies options for the source of DNS records.
openshiftRouteOptions.routerName-
If the source type is
OpenShiftRoute, you can pass the OpenShift Ingress Controller name. External DNS selects the canonical hostname of that router as the target while creating a CNAME record. type-
Specifies the
routeresource as the source for Google Cloud DNS records.
Check the DNS records created for OpenShift Container Platform routes by running the following command:
$ gcloud dns record-sets list --zone=qe-cvs4g-private-zone | grep console
5.3.8. Creating DNS records on Infoblox
To create DNS records on Infoblox, use the External DNS Operator. The Operator manages external name resolution for your cluster services.
5.3.8.1. Creating DNS records on a public DNS zone on Infoblox
To create DNS records on Infoblox, use the External DNS Operator. The Operator manages external name resolution for your cluster services.
Prerequisites
-
You have access to the OpenShift CLI (
oc). - You have access to the Infoblox UI.
Procedure
Create a
secretobject with Infoblox credentials by running the following command:$ oc -n external-dns-operator create secret generic infoblox-credentials --from-literal=EXTERNAL_DNS_INFOBLOX_WAPI_USERNAME=<infoblox_username> --from-literal=EXTERNAL_DNS_INFOBLOX_WAPI_PASSWORD=<infoblox_password>Get a list of routes by running the following command:
$ oc get routes --all-namespaces | grep consoleExample output
openshift-console console console-openshift-console.apps.test.example.com console https reencrypt/Redirect None openshift-console downloads downloads-openshift-console.apps.test.example.com downloads http edge/Redirect NoneCreate a YAML file, for example,
external-dns-sample-infoblox.yaml, that defines theExternalDNSobject:Example
external-dns-sample-infoblox.yamlfileapiVersion: externaldns.olm.openshift.io/v1beta1 kind: ExternalDNS metadata: name: sample-infoblox spec: provider: type: Infoblox infoblox: credentials: name: infoblox-credentials gridHost: ${INFOBLOX_GRID_PUBLIC_IP} wapiPort: 443 wapiVersion: "2.3.1" domains: - filterType: Include matchType: Exact name: test.example.com source: type: OpenShiftRoute openshiftRouteOptions: routerName: defaultwhere:
metadata.name- Specifies the External DNS name.
provider.type- Specifies the provider type.
source.type- Specifies options for the source of DNS records.
routerName-
If the source type is
OpenShiftRoute, you can pass the OpenShift Ingress Controller name. External DNS selects the canonical hostname of that router as the target while creating a CNAME record.
Create the
ExternalDNSresource on Infoblox by running the following command:$ oc create -f external-dns-sample-infoblox.yamlFrom the Infoblox UI, check the DNS records created for
consoleroutes:- Click Data Management → DNS → Zones.
- Select the zone name.
5.3.9. Configuring the cluster-wide proxy on the External DNS Operator
To propagate proxy settings to your deployed Operators, configure the cluster-wide proxy. The Operator Lifecycle Manager (OLM) automatically updates these Operators with the new HTTP_PROXY, HTTPS_PROXY, and NO_PROXY environment variables.
5.3.9.1. Trusting the certificate authority of the cluster-wide proxy
To enable the External DNS Operator to authenticate with the cluster-wide proxy, configure the Operator to trust the certificate authority (CA) of the proxy. This ensures secure communication when routing DNS traffic through the proxy.
Procedure
Create the config map to contain the CA bundle in the
external-dns-operatornamespace by running the following command:$ oc -n external-dns-operator create configmap trusted-caTo inject the trusted CA bundle into the config map, add the
config.openshift.io/inject-trusted-cabundle=truelabel to the config map by running the following command:$ oc -n external-dns-operator label cm trusted-ca config.openshift.io/inject-trusted-cabundle=trueUpdate the subscription of the External DNS Operator by running the following command:
$ oc -n external-dns-operator patch subscription external-dns-operator --type='json' -p='[{"op": "add", "path": "/spec/config", "value":{"env":[{"name":"TRUSTED_CA_CONFIGMAP_NAME","value":"trusted-ca"}]}}]'
Verification
After deploying the External DNS Operator, verify that the trusted CA environment variable is added by running the following command. The output must show
trusted-cafor theexternal-dns-operatordeployment.$ oc -n external-dns-operator exec deploy/external-dns-operator -c external-dns-operator -- printenv TRUSTED_CA_CONFIGMAP_NAME
5.4. MetalLB Operator
5.4.1. About MetalLB and the MetalLB Operator
In OpenShift Container Platform clusters running on bare metal or without a cloud load balancer, you can use the MetalLB Operator to assign external IP addresses to LoadBalancer services. These services receive external IPs on the host network.
5.4.1.1. When to use MetalLB
To get fault-tolerant access to applications through an external IP on bare metal in OpenShift Container Platform, you can use MetalLB.
MetalLB is useful when you have a bare-metal cluster, or an on-premise infrastructure without a native load balancer, and you need to expose services through external IP addresses.
You must configure your networking infrastructure to route network traffic for the external IP address from clients to the host network for the cluster.
When you deploy MetalLB with the MetalLB Operator, and add a service of type LoadBalancer, MetalLB provides a platform-native load balancer.
When external traffic enters your OpenShift Container Platform cluster through a MetalLB LoadBalancer service, the return traffic to the client has the external IP address of the load balancer as the source IP.
MetalLB operating in layer2 mode provides support for failover by utilizing a mechanism similar to IP failover. However, instead of relying on the virtual router redundancy protocol (VRRP) and keepalived, MetalLB leverages a gossip-based protocol to identify instances of node failure. When a failover is detected, another node assumes the role of the leader node, and a gratuitous ARP message is dispatched to broadcast this change.
MetalLB operating in layer3 or border gateway protocol (BGP) mode delegates failure detection to the network. The BGP router or routers that the OpenShift Container Platform nodes have established a connection with will identify any node failure and terminate the routes to that node.
Using MetalLB instead of IP failover is preferable for ensuring high availability of pods and services.
5.4.1.2. MetalLB Operator custom resources
In OpenShift Container Platform, you configure MetalLB deployment and IP advertisement through custom resources that the MetalLB Operator monitors. The resources include MetalLB, IPAddressPool, L2Advertisement, BGPAdvertisement, BGPPeer, and BFDProfile.
MetalLB-
When you add a
MetalLBcustom resource to the cluster, the MetalLB Operator deploys MetalLB on the cluster. The Operator only supports a single instance of the custom resource. If the instance is deleted, the Operator removes MetalLB from the cluster. IPAddressPoolMetalLB requires one or more pools of IP addresses that it can assign to a service when you add a service of type
LoadBalancer. AnIPAddressPoolincludes a list of IP addresses. The list can be a single IP address that is set using a range, such as 1.1.1.1-1.1.1.1, a range specified in CIDR notation, a range specified as a starting and ending address separated by a hyphen, or a combination of the three. AnIPAddressPoolrequires a name. The documentation uses names likedoc-example,doc-example-reserved, anddoc-example-ipv6. The MetalLBcontrollerassigns IP addresses from a pool of addresses in anIPAddressPool.L2AdvertisementandBGPAdvertisementcustom resources enable the advertisement of a given IP from a given pool. You can assign IP addresses from anIPAddressPoolto services and namespaces by using thespec.serviceAllocationspecification in theIPAddressPoolcustom resource.NoteA single
IPAddressPoolcan be referenced by a L2 advertisement and a BGP advertisement.BGPPeer- The BGP peer custom resource identifies the BGP router for MetalLB to communicate with, the AS number of the router, the AS number for MetalLB, and customizations for route advertisement. MetalLB advertises the routes for service load-balancer IP addresses to one or more BGP peers.
BFDProfile- The BFD profile custom resource configures Bidirectional Forwarding Detection (BFD) for a BGP peer. BFD provides faster path failure detection than BGP alone provides.
L2Advertisement-
The L2Advertisement custom resource advertises an IP coming from an
IPAddressPoolusing the L2 protocol. BGPAdvertisement-
The BGPAdvertisement custom resource advertises an IP coming from an
IPAddressPoolusing the BGP protocol.
After you add the MetalLB custom resource to the cluster and the Operator deploys MetalLB, the controller and speaker MetalLB software components begin running.
MetalLB validates all relevant custom resources.
5.4.1.3. MetalLB software components
In OpenShift Container Platform, you get external IPs for LoadBalancer services from two MetalLB components. The controller assigns IPs from address pools, and the speaker advertises them via layer 2 or BGP.
When you install the MetalLB Operator, the metallb-operator-controller-manager deployment starts a pod. The pod is the implementation of the Operator. The pod monitors for changes to all the relevant resources.
When the Operator starts an instance of MetalLB, it starts a controller deployment and a speaker daemon set.
You can configure deployment specifications in the MetalLB custom resource to manage how controller and speaker pods deploy and run in your cluster. For more information about these deployment specifications, see the Additional resources section.
controllerThe Operator starts the deployment and a single pod. When you add a service of type
LoadBalancer, Kubernetes uses thecontrollerto allocate an IP address from an address pool. In case of a service failure, verify you have the following entry in yourcontrollerpod logs:Example output
"event":"ipAllocated","ip":"172.22.0.201","msg":"IP address assigned by controllerspeakerThe Operator starts a daemon set for
speakerpods. By default, a pod is started on each node in your cluster. You can limit the pods to specific nodes by specifying a node selector in theMetalLBcustom resource when you start MetalLB. If thecontrollerallocated the IP address to the service and service is still unavailable, read thespeakerpod logs. If thespeakerpod is unavailable, run theoc describe pod -ncommand.For layer 2 mode, after the
controllerallocates an IP address for the service, thespeakerpods use an algorithm to determine whichspeakerpod on which node will announce the load balancer IP address. The algorithm involves hashing the node name and the load balancer IP address. For more information, see "MetalLB and external traffic policy". Thespeakeruses Address Resolution Protocol (ARP) to announce IPv4 addresses and Neighbor Discovery Protocol (NDP) to announce IPv6 addresses.
For Border Gateway Protocol (BGP) mode, after the controller allocates an IP address for the service, each speaker pod advertises the load balancer IP address with its BGP peers. You can configure which nodes start BGP sessions with BGP peers.
Requests for the load balancer IP address are routed to the node with the speaker that announces the IP address. After the node receives the packets, the service proxy routes the packets to an endpoint for the service. The endpoint can be on the same node in the optimal case, or it can be on another node. The service proxy chooses an endpoint each time a connection is established.
5.4.1.4. MetalLB and external traffic policy
External traffic policy for MetalLB LoadBalancer services determines how the service proxy distributes traffic to pods. Set the policy to cluster for uniform distribution or to local to preserve client IP addresses.
With layer 2 mode, one node in your cluster receives all the traffic for the service IP address.
With BGP mode, a router on the host network opens a connection to one of the nodes in the cluster for a new client connection.
How your cluster handles the traffic after it enters the node is affected by the external traffic policy.
clusterThis is the default value for
spec.externalTrafficPolicy.With the
clustertraffic policy, after the node receives the traffic, the service proxy distributes the traffic to all the pods in your service. This policy provides uniform traffic distribution across the pods, but it obscures the client IP address and it can appear to the application in your pods that the traffic originates from the node rather than the client.localWith the
localtraffic policy, after the node receives the traffic, the service proxy only sends traffic to the pods on the same node. For example, if thespeakerpod on node A announces the external service IP, then all traffic is sent to node A. After the traffic enters node A, the service proxy only sends traffic to pods for the service that are also on node A. Pods for the service that are on additional nodes do not receive any traffic from node A. Pods for the service on additional nodes act as replicas in case failover is needed.This policy does not affect the client IP address. Application pods can determine the client IP address from the incoming connections.
The following information is important when configuring the external traffic policy in BGP mode.
Although MetalLB advertises the load balancer IP address from all the eligible nodes, the number of nodes loadbalancing the service can be limited by the capacity of the router to establish equal-cost multipath (ECMP) routes. If the number of nodes advertising the IP is greater than the ECMP group limit of the router, the router will use less nodes than the ones advertising the IP.
For example, if the external traffic policy is set to local and the router has an ECMP group limit set to 16 and the pods implementing a LoadBalancer service are deployed on 30 nodes, this would result in pods deployed on 14 nodes not receiving any traffic. In this situation, it would be preferable to set the external traffic policy for the service to cluster.
5.4.1.5. MetalLB concepts for layer 2 mode
MetalLB in layer 2 mode announces the external IP for a LoadBalancer service from one node via ARP or NDP. All traffic for the service goes through that node, and failover to another node is automatic when the node becomes unavailable.
In layer 2 mode, MetalLB relies on ARP and NDP. These protocols implement local address resolution within a specific subnet. In this context, the client must be able to reach the VIP assigned by MetalLB that exists on the same subnet as the nodes announcing the service in order for MetalLB to work.
The speaker pod responds to ARP requests for IPv4 services and NDP requests for IPv6.
In layer 2 mode, all traffic for a service IP address is routed through one node. After traffic enters the node, the service proxy for the CNI network provider distributes the traffic to all the pods for the service.
Because all traffic for a service enters through a single node in layer 2 mode, in a strict sense, MetalLB does not implement a load balancer for layer 2. Rather, MetalLB implements a failover mechanism for layer 2 so that when a speaker pod becomes unavailable, a speaker pod on a different node can announce the service IP address.
When a node becomes unavailable, failover is automatic. The speaker pods on the other nodes detect that a node is unavailable and a new speaker pod and node take ownership of the service IP address from the failed node.
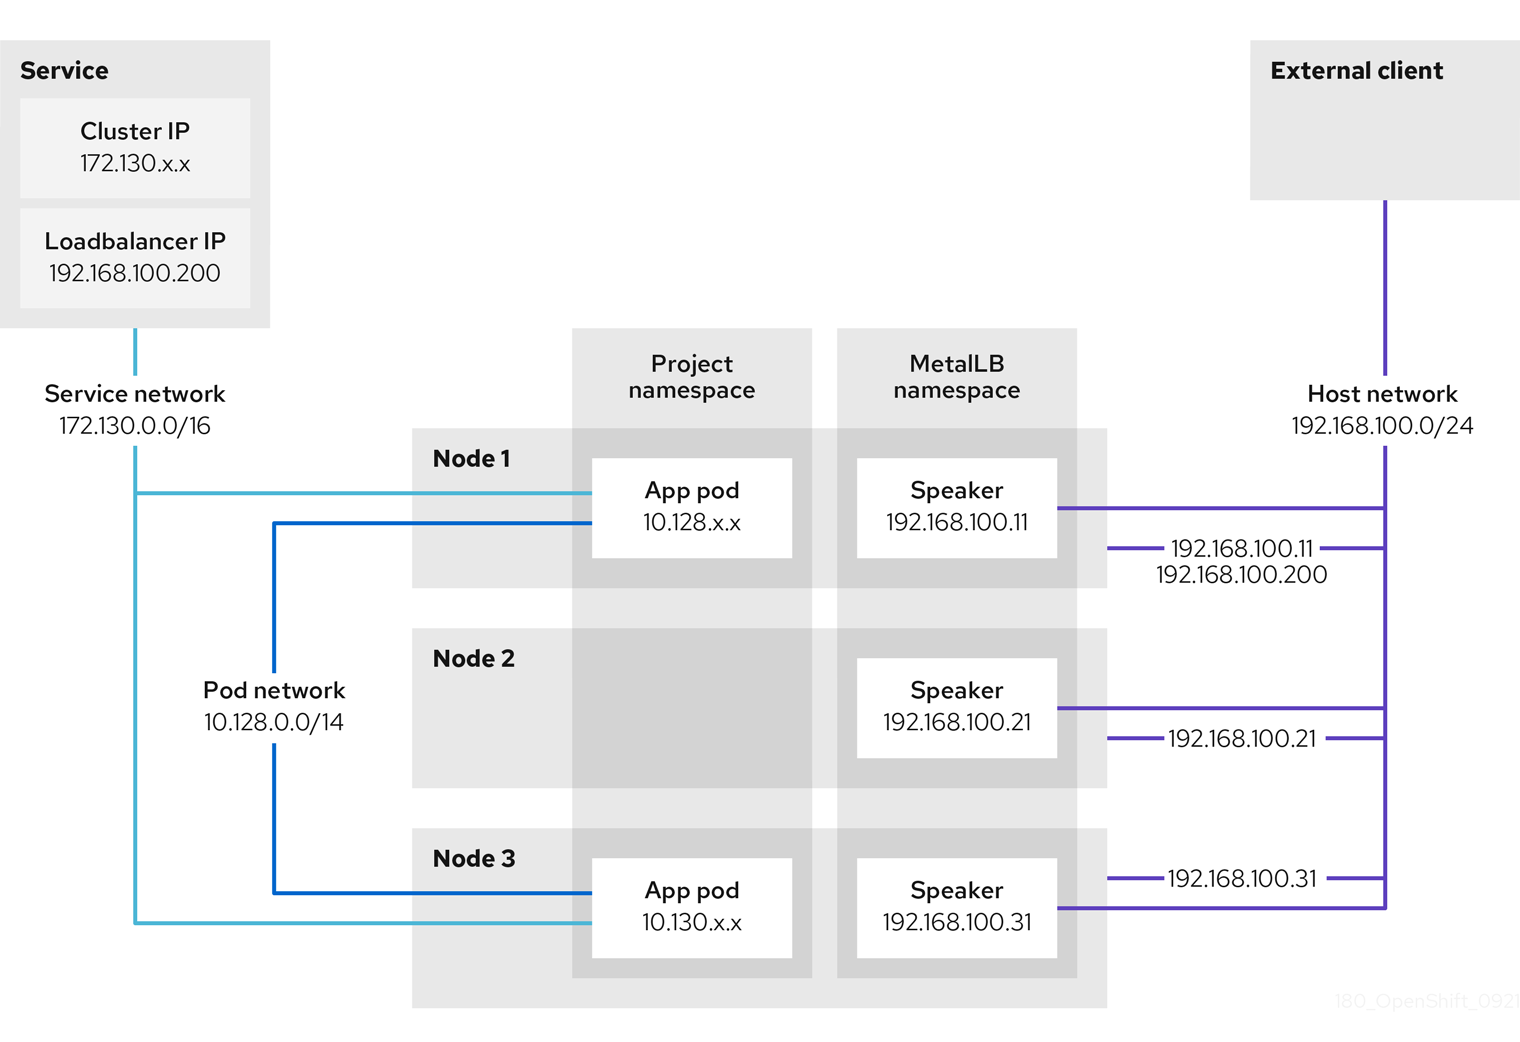
The preceding graphic shows the following concepts related to MetalLB:
-
An application is available through a service that has a cluster IP on the
172.130.0.0/16subnet. That IP address is accessible from inside the cluster. The service also has an external IP address that MetalLB assigned to the service,192.168.100.200. - Nodes 1 and 3 have a pod for the application.
-
The
speakerdaemon set runs a pod on each node. The MetalLB Operator starts these pods. -
Each
speakerpod is a host-networked pod. The IP address for the pod is identical to the IP address for the node on the host network. -
The
speakerpod on node 1 uses ARP to announce the external IP address for the service,192.168.100.200. Thespeakerpod that announces the external IP address must be on the same node as an endpoint for the service and the endpoint must be in theReadycondition. Client traffic is routed to the host network and connects to the
192.168.100.200IP address. After traffic enters the node, the service proxy sends the traffic to the application pod on the same node or another node according to the external traffic policy that you set for the service.-
If the external traffic policy for the service is set to
cluster, the node that advertises the192.168.100.200load balancer IP address is selected from the nodes where aspeakerpod is running. Only that node can receive traffic for the service. -
If the external traffic policy for the service is set to
local, the node that advertises the192.168.100.200load balancer IP address is selected from the nodes where aspeakerpod is running and at least an endpoint of the service. Only that node can receive traffic for the service. In the preceding graphic, either node 1 or 3 would advertise192.168.100.200.
-
If the external traffic policy for the service is set to
-
If node 1 becomes unavailable, the external IP address fails over to another node. On another node that has an instance of the application pod and service endpoint, the
speakerpod begins to announce the external IP address,192.168.100.200and the new node receives the client traffic. In the diagram, the only candidate is node 3.
5.4.1.6. MetalLB concepts for BGP mode
MetalLB in border gateway protocol (BGP) mode advertises load balancer IP addresses to BGP peers from each speaker pod. The router sends traffic to one of the nodes, so load is distributed across nodes and the router switches to another node when one becomes unavailable.
It is also possible to advertise the IPs coming from a given pool to a specific set of peers by adding an optional list of BGP peers.
BGP peers are commonly network routers that are configured to use the BGP protocol. When a router receives traffic for the load balancer IP address, the router picks one of the nodes with a speaker pod that advertised the IP address. The router sends the traffic to that node. After traffic enters the node, the service proxy for the CNI network plugin distributes the traffic to all the pods for the service.
The directly-connected router on the same layer 2 network segment as the cluster nodes can be configured as a BGP peer. If the directly-connected router is not configured as a BGP peer, you need to configure your network so that packets for load balancer IP addresses are routed between the BGP peers and the cluster nodes that run the speaker pods.
Each time a router receives new traffic for the load balancer IP address, it creates a new connection to a node. Each router manufacturer has an implementation-specific algorithm for choosing which node to initiate the connection with. However, the algorithms commonly are designed to distribute traffic across the available nodes for the purpose of balancing the network load.
If a node becomes unavailable, the router initiates a new connection with another node that has a speaker pod that advertises the load balancer IP address.
Figure 5.1. MetalLB topology diagram for BGP mode
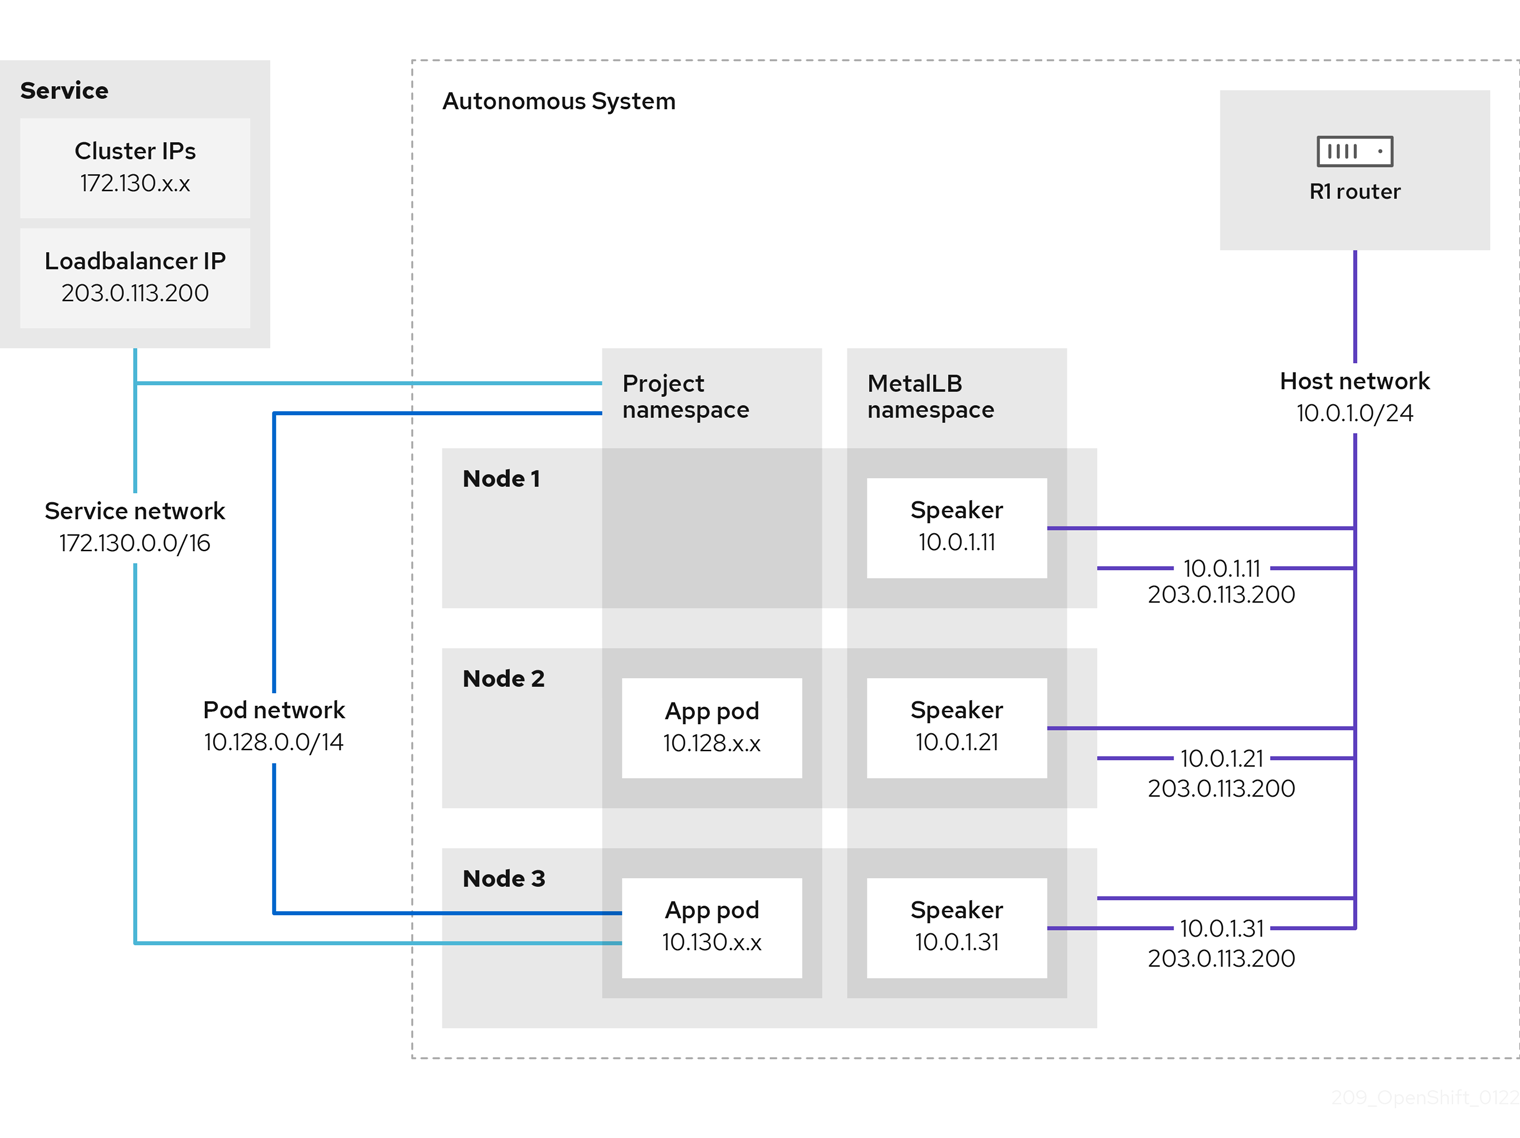
The preceding graphic shows the following concepts related to MetalLB:
-
An application is available through a service that has an IPv4 cluster IP on the
172.130.0.0/16subnet. That IP address is accessible from inside the cluster. The service also has an external IP address that MetalLB assigned to the service,203.0.113.200. - Nodes 2 and 3 have a pod for the application.
-
The
speakerdaemon set runs a pod on each node. The MetalLB Operator starts these pods. You can configure MetalLB to specify which nodes run thespeakerpods. -
Each
speakerpod is a host-networked pod. The IP address for the pod is identical to the IP address for the node on the host network. -
Each
speakerpod starts a BGP session with all BGP peers and advertises the load balancer IP addresses or aggregated routes to the BGP peers. Thespeakerpods advertise that they are part of Autonomous System 65010. The diagram shows a router, R1, as a BGP peer within the same Autonomous System. However, you can configure MetalLB to start BGP sessions with peers that belong to other Autonomous Systems. All the nodes with a
speakerpod that advertises the load balancer IP address can receive traffic for the service.-
If the external traffic policy for the service is set to
cluster, all the nodes where a speaker pod is running advertise the203.0.113.200load balancer IP address and all the nodes with aspeakerpod can receive traffic for the service. The host prefix is advertised to the router peer only if the external traffic policy is set to cluster. -
If the external traffic policy for the service is set to
local, then all the nodes where aspeakerpod is running and at least an endpoint of the service is running can advertise the203.0.113.200load balancer IP address. Only those nodes can receive traffic for the service. In the preceding graphic, nodes 2 and 3 would advertise203.0.113.200.
-
If the external traffic policy for the service is set to
-
You can configure MetalLB to control which
speakerpods start BGP sessions with specific BGP peers by specifying a node selector when you add a BGP peer custom resource. - Any routers, such as R1, that are configured to use BGP can be set as BGP peers.
- Client traffic is routed to one of the nodes on the host network. After traffic enters the node, the service proxy sends the traffic to the application pod on the same node or another node according to the external traffic policy that you set for the service.
- If a node becomes unavailable, the router detects the failure and initiates a new connection with another node. You can configure MetalLB to use a Bidirectional Forwarding Detection (BFD) profile for BGP peers. BFD provides faster link failure detection so that routers can initiate new connections earlier than without BFD.
5.4.1.7. Limitations and restrictions
MetalLB has limitations for infrastructure, layer 2 mode, and BGP mode in OpenShift Container Platform. Consider infrastructure fit, layer 2 single-node bandwidth and failover, and BGP connection resets and single ASN when you plan your deployment.
5.4.1.7.1. Infrastructure considerations for MetalLB
MetalLB is designed for bare metal and on-premise environments where no native cloud load balancer is available. Before you deploy MetalLB, verify that your infrastructure meets the networking requirements for your chosen mode.
MetalLB is not supported on cloud provider platforms such as AWS, Azure, or Google Cloud. Cloud platforms virtualize the network layer and expose proprietary APIs instead of standard network protocols. As a result, MetalLB cannot function correctly on these platforms.
Use the load balancing service that the platform provides if your cluster runs on a cloud platform.
5.4.1.7.1.1. Supported platforms
The following infrastructure platforms support MetalLB:
- Bare metal
- VMware vSphere
- IBM Z® and IBM® LinuxONE
- IBM Z® and IBM® LinuxONE for Red Hat Enterprise Linux (RHEL) KVM
- IBM Power®
MetalLB Operator and MetalLB are supported with the OpenShift SDN and OVN-Kubernetes network providers.
5.4.1.7.1.2. Network prerequisites
MetalLB requires the following network capabilities, depending on the operating mode:
- For Layer 2 mode
- Standard ARP (IPv4) or NDP (IPv6) must function on the network. The network must not block or emulate ARP/NDP traffic.
- Anti-ARP-spoofing protections, if present, must be disabled on nodes running MetalLB speakers. Some virtualization platforms, such as Red Hat OpenStack Platform (RHOSP), enable this protection by default.
- For BGP mode
- An external BGP-capable router must be available and reachable from the cluster nodes.
- The network must allow BGP sessions (TCP port 179) between the cluster nodes and the upstream router.
- For both modes
- Configure external network infrastructure to route traffic destined for the external IP addresses to the cluster nodes.
5.4.1.7.2. Limitations for layer 2 mode
In OpenShift Container Platform, MetalLB layer 2 mode is limited to single-node bandwidth and failover depends on client ARP handling. Avoid using the same VLAN for MetalLB and an additional network to prevent connection failures.
5.4.1.7.2.1. Single-node bottleneck
MetalLB routes all traffic for a service through a single node, the node can become a bottleneck and limit performance.
Layer 2 mode limits the ingress bandwidth for your service to the bandwidth of a single node. This is a fundamental limitation of using ARP and NDP to direct traffic.
5.4.1.7.2.2. Slow failover performance
Failover between nodes depends on cooperation from the clients. When a failover occurs, MetalLB sends gratuitous ARP packets to notify clients that the MAC address associated with the service IP has changed.
Most client operating systems handle gratuitous ARP packets correctly and update their neighbor caches promptly. When clients update their caches quickly, failover completes within a few seconds. Clients typically fail over to a new node within 10 seconds. However, some client operating systems either do not handle gratuitous ARP packets at all or have outdated implementations that delay the cache update.
Recent versions of common operating systems such as Windows, macOS, and Linux implement layer 2 failover correctly. Issues with slow failover are not expected except for older and less common client operating systems.
To minimize the impact from a planned failover on outdated clients, keep the old node running for a few minutes after flipping leadership. The old node can continue to forward traffic for outdated clients until their caches refresh.
During an unplanned failover, the service IPs are unreachable until the outdated clients refresh their cache entries.
5.4.1.7.2.3. Additional Network and MetalLB cannot use same network
Using the same VLAN for both MetalLB and an additional network interface set up on a source pod might result in a connection failure. This occurs when both the MetalLB IP and the source pod reside on the same node.
To avoid connection failures, place the MetalLB IP in a different subnet from the one where the source pod resides. This configuration ensures that traffic from the source pod will take the default gateway. Consequently, the traffic can effectively reach its destination by using the OVN overlay network, ensuring that the connection functions as intended.
5.4.1.7.3. Limitations for BGP mode
In OpenShift Container Platform, MetalLB border gateway protocol (BGP) mode can reset active connections when a BGP session terminates and requires a single ASN and router ID for all BGP peers. Use a node selector when adding a BGP peer to limit which nodes run BGP sessions and reduce the impact of node faults.
5.4.1.7.3.1. Node failure can break all active connections
MetalLB shares a limitation that is common to BGP-based load balancing. When a BGP session terminates, such as when a node fails or when a speaker pod restarts, the session termination might result in resetting all active connections. End users can experience a Connection reset by peer message.
The consequence of a terminated BGP session is implementation-specific for each router manufacturer. However, you can anticipate that a change in the number of speaker pods affects the number of BGP sessions and that active connections with BGP peers will break.
To avoid or reduce the likelihood of a service interruption, you can specify a node selector when you add a BGP peer. By limiting the number of nodes that start BGP sessions, a fault on a node that does not have a BGP session has no affect on connections to the service.
5.4.1.7.3.2. Support for a single ASN and a single router ID only
When you add a BGP peer custom resource, you specify the spec.myASN field to identify the Autonomous System Number (ASN) that MetalLB belongs to. OpenShift Container Platform uses an implementation of BGP with MetalLB that requires MetalLB to belong to a single ASN. If you attempt to add a BGP peer and specify a different value for spec.myASN than an existing BGP peer custom resource, you receive an error.
Similarly, when you add a BGP peer custom resource, the spec.routerID field is optional. If you specify a value for this field, you must specify the same value for all other BGP peer custom resources that you add.
The limitation to support a single ASN and single router ID is a difference with the community-supported implementation of MetalLB.
5.4.2. Installing the MetalLB Operator
As a cluster administrator, you can add the MetalLB Operator so that the Operator can manage the lifecycle for an instance of MetalLB on your cluster.
MetalLB and IP failover are incompatible. If you configured IP failover for your cluster, perform the steps to remove IP failover before you install the Operator.
5.4.2.1. Installing the MetalLB Operator from the OperatorHub by using the web console
As a cluster administrator, you can install the MetalLB Operator by using the OpenShift Container Platform web console.
Prerequisites
-
Log in as a user with
cluster-adminprivileges.
Procedure
- In the OpenShift Container Platform web console, navigate to Operators → OperatorHub.
Type a keyword into the Filter by keyword box or scroll to find the Operator you want. For example, type
metallbto find the MetalLB Operator.You can also filter options by Infrastructure Features. For example, select Disconnected if you want to see Operators that work in disconnected environments, also known as restricted network environments.
- On the Install Operator page, accept the defaults and click Install.
Verification
To confirm that the installation is successful:
- Navigate to the Operators → Installed Operators page.
-
Check that the Operator is installed in the
openshift-operatorsnamespace and that its status isSucceeded.
If the Operator is not installed successfully, check the status of the Operator and review the logs:
-
Navigate to the Operators → Installed Operators page and inspect the
Statuscolumn for any errors or failures. -
Navigate to the Workloads → Pods page and check the logs in any pods in the
openshift-operatorsproject that are reporting issues.
-
Navigate to the Operators → Installed Operators page and inspect the
5.4.2.2. Installing from OperatorHub using the CLI
To install the MetalLB Operator from the software catalog in OpenShift Container Platform without using the web console, you can use the OpenShift CLI (oc).
It is recommended that when using the CLI you install the Operator in the metallb-system namespace.
Prerequisites
- A cluster installed on bare-metal hardware.
-
Install the OpenShift CLI (
oc). -
Log in as a user with
cluster-adminprivileges.
Procedure
Create a namespace for the MetalLB Operator by entering the following command:
$ cat << EOF | oc apply -f - apiVersion: v1 kind: Namespace metadata: name: metallb-system EOFCreate an Operator group custom resource (CR) in the namespace:
$ cat << EOF | oc apply -f - apiVersion: operators.coreos.com/v1 kind: OperatorGroup metadata: name: metallb-operator namespace: metallb-system EOFConfirm the Operator group is installed in the namespace:
$ oc get operatorgroup -n metallb-systemExample output
NAME AGE metallb-operator 14mCreate a
SubscriptionCR:Define the
SubscriptionCR and save the YAML file, for example,metallb-sub.yaml:apiVersion: operators.coreos.com/v1alpha1 kind: Subscription metadata: name: metallb-operator-sub namespace: metallb-system spec: channel: stable name: metallb-operator source: redhat-operators sourceNamespace: openshift-marketplace-
For the
spec.sourceparameter, must specify theredhat-operatorsvalue.
-
For the
To create the
SubscriptionCR, run the following command:$ oc create -f metallb-sub.yaml
Optional: To ensure BGP and BFD metrics appear in Prometheus, you can label the namespace as in the following command:
$ oc label ns metallb-system "openshift.io/cluster-monitoring=true"
Verification
The verification steps assume the MetalLB Operator is installed in the metallb-system namespace.
Confirm the install plan is in the namespace:
$ oc get installplan -n metallb-systemExample output
NAME CSV APPROVAL APPROVED install-wzg94 metallb-operator.4.16.0-nnnnnnnnnnnn Automatic trueNoteInstallation of the Operator might take a few seconds.
To verify that the Operator is installed, enter the following command and then check that output shows
Succeededfor the Operator:$ oc get clusterserviceversion -n metallb-system \ -o custom-columns=Name:.metadata.name,Phase:.status.phase
5.4.2.3. Starting MetalLB on your cluster
To start MetalLB on your cluster after installing the MetalLB Operator in OpenShift Container Platform, you create a single MetalLB custom resource.
Prerequisites
-
Install the OpenShift CLI (
oc). -
Log in as a user with
cluster-adminprivileges. - Install the MetalLB Operator.
Procedure
Create a single instance of a MetalLB custom resource:
$ cat << EOF | oc apply -f - apiVersion: metallb.io/v1beta1 kind: MetalLB metadata: name: metallb namespace: metallb-system EOF-
For the
metdata.namespaceparameter, substitutemetallb-systemwithopenshift-operatorsif you installed the MetalLB Operator using the web console.
-
For the
Verification
Confirm that the deployment for the MetalLB controller and the daemon set for the MetalLB speaker are running.
Verify that the deployment for the controller is running:
$ oc get deployment -n metallb-system controllerExample output
NAME READY UP-TO-DATE AVAILABLE AGE controller 1/1 1 1 11mVerify that the daemon set for the speaker is running:
$ oc get daemonset -n metallb-system speakerExample output
NAME DESIRED CURRENT READY UP-TO-DATE AVAILABLE NODE SELECTOR AGE speaker 6 6 6 6 6 kubernetes.io/os=linux 18mThe example output indicates 6 speaker pods. The number of speaker pods in your cluster might differ from the example output. Make sure the output indicates one pod for each node in your cluster.
5.4.2.4. Deployment specifications for MetalLB
Deployment specifications in the MetalLB custom resource control how the MetalLB controller and speaker pods deploy and run in OpenShift Container Platform.
Use deployment specifications to manage the following tasks:
- Select nodes for MetalLB pod deployment.
- Manage scheduling by using pod priority and pod affinity.
- Assign CPU limits for MetalLB pods.
- Assign a container RuntimeClass for MetalLB pods.
- Assign metadata for MetalLB pods.
5.4.2.4.1. Limit speaker pods to specific nodes
You can limit MetalLB speaker pods to specific nodes in OpenShift Container Platform by configuring a node selector in the MetalLB custom resource. Only nodes that run a speaker pod advertise load balancer IP addresses, so you control which nodes serve MetalLB traffic.
The most common reason to limit the speaker pods to specific nodes is to ensure that only nodes with network interfaces on specific networks advertise load balancer IP addresses.
If you limit the speaker pods to specific nodes and specify local for the external traffic policy of a service, then you must ensure that the application pods for the service are deployed to the same nodes.
Example configuration to limit speaker pods to worker nodes
apiVersion: metallb.io/v1beta1
kind: MetalLB
metadata:
name: metallb
namespace: metallb-system
spec:
nodeSelector:
node-role.kubernetes.io/worker: ""
speakerTolerations:
- key: "Example"
operator: "Exists"
effect: "NoExecute"-
In this example configuration, the
spec.nodeSelectorfield assigns thespeakerpods to worker nodes. You can specify labels that you assigned to nodes or any valid node selector. -
In this example configuration,
spec.speakerToTolerationspod that this toleration is attached to tolerates any taint that matches thekeyandeffectvalues by using theoperatorvalue.
After you apply a manifest with the spec.nodeSelector field, you can check the number of pods that the Operator deployed with the oc get daemonset -n metallb-system speaker command. Similarly, you can display the nodes that match your labels with a command like oc get nodes -l node-role.kubernetes.io/worker=.
You can optionally allow the node to control which speaker pods should, or should not, be scheduled on them by using affinity rules. You can also limit these pods by applying a list of tolerations. For more information about affinity rules, taints, and tolerations, see the additional resources.
5.4.2.4.2. Configuring pod priority and pod affinity in a MetalLB deployment
To control scheduling of MetalLB controller and speaker pods in OpenShift Container Platform, you can assign pod priority and pod affinity in the MetalLB custom resource. You create a PriorityClass and set priorityClassName and affinity in the MetalLB spec, then apply the configuration.
The pod priority indicates the relative importance of a pod on a node and schedules the pod based on this priority. Set a high priority on your controller or speaker pod to ensure scheduling priority over other pods on the node.
Pod affinity manages relationships among pods. Assign pod affinity to the controller or speaker pods to control on what node the scheduler places the pod in the context of pod relationships. For example, you can use pod affinity rules to ensure that certain pods are located on the same node or nodes, which can help improve network communication and reduce latency between those components.
Prerequisites
-
You are logged in as a user with
cluster-adminprivileges. - You have installed the MetalLB Operator.
- You have started the MetalLB Operator on your cluster.
Procedure
Create a
PriorityClasscustom resource, such asmyPriorityClass.yaml, to configure the priority level. This example defines aPriorityClassnamedhigh-prioritywith a value of1000000. Pods that are assigned this priority class are considered higher priority during scheduling compared to pods with lower priority classes:apiVersion: scheduling.k8s.io/v1 kind: PriorityClass metadata: name: high-priority value: 1000000Apply the
PriorityClasscustom resource configuration:$ oc apply -f myPriorityClass.yamlCreate a
MetalLBcustom resource, such asMetalLBPodConfig.yaml, to specify thepriorityClassNameandpodAffinityvalues:apiVersion: metallb.io/v1beta1 kind: MetalLB metadata: name: metallb namespace: metallb-system spec: logLevel: debug controllerConfig: priorityClassName: high-priority affinity: podAffinity: requiredDuringSchedulingIgnoredDuringExecution: - labelSelector: matchLabels: app: metallb topologyKey: kubernetes.io/hostname speakerConfig: priorityClassName: high-priority affinity: podAffinity: requiredDuringSchedulingIgnoredDuringExecution: - labelSelector: matchLabels: app: metallb topologyKey: kubernetes.io/hostnamewhere:
spec.controllerConfig.priorityClassName-
Specifies the priority class for the MetalLB controller pods. In this case, it is set to
high-priority. spec.controllerConfig.affinity.podAffinity-
Specifies that you are configuring pod affinity rules. These rules dictate how pods are scheduled in relation to other pods or nodes. This configuration instructs the scheduler to schedule pods that have the label
app: metallbonto nodes that share the same hostname. This helps to co-locate MetalLB-related pods on the same nodes, potentially optimizing network communication, latency, and resource usage between these pods.
Apply the
MetalLBcustom resource configuration by running the following command:$ oc apply -f MetalLBPodConfig.yaml
Verification
To view the priority class that you assigned to pods in the
metallb-systemnamespace, run the following command:$ oc get pods -n metallb-system -o custom-columns=NAME:.metadata.name,PRIORITY:.spec.priorityClassNameExample output
NAME PRIORITY controller-584f5c8cd8-5zbvg high-priority metallb-operator-controller-manager-9c8d9985-szkqg <none> metallb-operator-webhook-server-c895594d4-shjgx <none> speaker-dddf7 high-priorityVerify that the scheduler placed pods according to pod affinity rules by viewing the metadata for the node of the pod. For example:
$ oc get pod -o=custom-columns=NODE:.spec.nodeName,NAME:.metadata.name -n metallb-system
5.4.2.4.3. Configuring pod CPU limits in a MetalLB deployment
To manage compute resources on nodes running MetalLB in OpenShift Container Platform, you can assign CPU limits to the controller and speaker pods in the MetalLB custom resource. This ensures that all pods on the node have the necessary compute resources to manage workloads and cluster housekeeping.
Prerequisites
-
You are logged in as a user with
cluster-adminprivileges. - You have installed the MetalLB Operator.
Procedure
Create a
MetalLBcustom resource file, such asCPULimits.yaml, to specify thecpuvalue for thecontrollerandspeakerpods:apiVersion: metallb.io/v1beta1 kind: MetalLB metadata: name: metallb namespace: metallb-system spec: logLevel: debug controllerConfig: resources: limits: cpu: "200m" speakerConfig: resources: limits: cpu: "300m"Apply the
MetalLBcustom resource configuration:$ oc apply -f CPULimits.yaml
Verification
To view compute resources for a pod, run the following command, replacing
<pod_name>with your target pod:$ oc describe pod <pod_name>
5.4.3. Upgrading the MetalLB Operator
The Subscription custom resource (CR) for the MetalLB Operator is used to manage whether the Operator is upgraded automatically or manually.
By default, the Subscription CR assigns the namespace to metallb-system and automatically sets the installPlanApproval parameter to Automatic. This means that when Red Hat-provided Operator catalogs include a newer version of the MetalLB Operator, the MetalLB Operator is automatically upgraded.
If you need to manually control upgrading the MetalLB Operator, set the installPlanApproval parameter to Manual.
5.4.3.1. Manually upgrading the MetalLB Operator
To manually control when the MetalLB Operator upgrades in OpenShift Container Platform, you set installPlanApproval to Manual in the Subscription custom resource and approve the install plan. You then verify the upgrade by using the ClusterServiceVersion status.
Prerequisites
- You updated your cluster to the latest z-stream release.
- You used OperatorHub to install the MetalLB Operator.
-
Access the cluster as a user with the
cluster-adminrole.
Procedure
Get the YAML definition of the
metallb-operatorsubscription in themetallb-systemnamespace by entering the following command:$ oc -n metallb-system get subscription metallb-operator -o yamlEdit the
SubscriptionCR by setting theinstallPlanApprovalparameter toManual:apiVersion: operators.coreos.com/v1alpha1 kind: Subscription metadata: name: metallb-operator namespace: metallb-system # ... spec: channel: stable installPlanApproval: Manual name: metallb-operator source: redhat-operators sourceNamespace: openshift-marketplace # ...Find the latest OpenShift Container Platform 4.16 version of the MetalLB Operator by entering the following command:
$ oc -n metallb-system get csvCheck the install plan that exists in the namespace by entering the following command.
$ oc -n metallb-system get installplanExample output that shows install-tsz2g as a manual install plan
NAME CSV APPROVAL APPROVED install-shpmd metallb-operator.v4.16.0-202502261233 Automatic true install-tsz2g metallb-operator.v4.16.0-202503102139 Manual falseEdit the install plan that exists in the namespace by entering the following command. Ensure that you replace
<name_of_installplan>with the name of the install plan, such asinstall-tsz2g.$ oc edit installplan <name_of_installplan> -n metallb-systemWith the install plan open in your editor, set the
spec.approvalparameter toManualand set thespec.approvedparameter totrue.NoteAfter you edit the install plan, the upgrade operation starts. If you enter the
oc -n metallb-system get csvcommand during the upgrade operation, the output might show theReplacingor thePendingstatus.
Verification
To verify that the Operator is upgraded, enter the following command and then check that output shows
Succeededfor the Operator:$ oc -n metallb-system get csv
5.4.3.2. Additional resources
5.5. Cluster Network Operator in OpenShift Container Platform
With the Cluster Network Operator, you can manage networking in OpenShift Container Platform, including how to view status, enable IP forwarding, and collect logs.
You can use the Cluster Network Operator (CNO) to deploy and manage cluster network components on an OpenShift Container Platform cluster, including the Container Network Interface (CNI) network plugin selected for the cluster during installation.
5.5.1. Cluster Network Operator
The Cluster Network Operator implements the network API from the operator.openshift.io API group. The Operator deploys the OVN-Kubernetes network plugin, or the network provider plugin that you selected during cluster installation, by using a daemon set.
The Cluster Network Operator is deployed during installation as a Kubernetes Deployment.
Procedure
Run the following command to view the Deployment status:
$ oc get -n openshift-network-operator deployment/network-operatorExample output
NAME READY UP-TO-DATE AVAILABLE AGE network-operator 1/1 1 1 56mRun the following command to view the state of the Cluster Network Operator:
$ oc get clusteroperator/networkExample output
NAME VERSION AVAILABLE PROGRESSING DEGRADED SINCE network 4.16.1 True False False 50mThe following fields provide information about the status of the operator:
AVAILABLE,PROGRESSING, andDEGRADED. TheAVAILABLEfield isTruewhen the Cluster Network Operator reports an available status condition.
5.5.2. Viewing the cluster network configuration
You can view your OpenShift Container Platform cluster network configuration by using the oc describe command for the network.config/cluster resource.
Procedure
Use the
oc describecommand to view the cluster network configuration:$ oc describe network.config/clusterExample output
Name: cluster Namespace: Labels: <none> Annotations: <none> API Version: config.openshift.io/v1 Kind: Network Metadata: Creation Timestamp: 2024-08-08T11:25:56Z Generation: 3 Resource Version: 29821 UID: 808dd2be-5077-4ff7-b6bb-21b7110126c7 Spec: Cluster Network: Cidr: 10.128.0.0/14 Host Prefix: 23 Network Type: OVNKubernetes Service Network: 172.30.0.0/16 Status Cluster Network: Cidr: 10.128.0.0/14 Host Prefix: 23 Cluster Network MTU: 8951 Network Type: OVNKubernetes Service Network: 172.30.0.0/16 Events: <none>where:
spec- Specifies the field that displays the configured state of the cluster network.
Status- Displays the current state of the cluster network configuration.
5.5.3. Viewing Cluster Network Operator status
You can inspect the status and view the details of the Cluster Network Operator by using the oc describe command.
Procedure
Run the following command to view the status of the Cluster Network Operator:
$ oc describe clusteroperators/network
5.5.4. Enabling IP forwarding globally
From OpenShift Container Platform 4.14 onward, OVN-Kubernetes disables global IP forwarding by default. By setting the Cluster Network Operator gatewayConfig.ipForwarding spec to Global, you can enable cluster-wide forwarding.
Procedure
Backup the existing network configuration by running the following command:
$ oc get network.operator cluster -o yaml > network-config-backup.yamlRun the following command to modify the existing network configuration:
$ oc edit network.operator clusterAdd or update the following block under
specas illustrated in the following example:spec: clusterNetwork: - cidr: 10.128.0.0/14 hostPrefix: 23 serviceNetwork: - 172.30.0.0/16 networkType: OVNKubernetes clusterNetworkMTU: 8900 defaultNetwork: ovnKubernetesConfig: gatewayConfig: ipForwarding: Global- Save and close the file.
After applying the changes, the OpenShift Cluster Network Operator (CNO) applies the update across the cluster. You can monitor the progress by using the following command:
$ oc get clusteroperators networkThe status should eventually report as
Available,Progressing=False, andDegraded=False.Alternatively, you can enable IP forwarding globally by running the following command:
$ oc patch network.operator cluster -p '{"spec":{"defaultNetwork":{"ovnKubernetesConfig":{"gatewayConfig":{"ipForwarding": "Global"}}}}}' --type=mergeNoteThe other valid option for this parameter is
Restrictedin case you want to revert this change.Restrictedis the default and with that setting global IP address forwarding is disabled.
5.5.5. Viewing Cluster Network Operator logs
You can view Cluster Network Operator logs by using the oc logs command.
Procedure
Run the following command to view the logs of the Cluster Network Operator:
$ oc logs --namespace=openshift-network-operator deployment/network-operator
5.5.6. Cluster Network Operator configuration
To manage cluster networking, configure the Cluster Network Operator (CNO) Network custom resource (CR) named cluster so the cluster uses the correct IP ranges and network plugin settings for reliable pod and service connectivity. Some settings and fields are inherited at the time of install.
The CNO configuration inherits the following fields during cluster installation from the Network API in the Network.config.openshift.io API group:
clusterNetwork- IP address pools from which pod IP addresses are allocated.
serviceNetwork- IP address pool for services.
defaultNetwork.type-
Cluster network plugin.
OVNKubernetesis the only supported plugin during installation.
After cluster installation, you can only modify the clusterNetwork IP address range. The default network type can only be changed from OpenShift SDN to OVN-Kubernetes through migration.
You can specify the cluster network plugin configuration for your cluster by setting the fields for the defaultNetwork object in the CNO object named cluster.
5.5.6.1. Cluster Network Operator configuration object
The fields for the Cluster Network Operator (CNO) are described in the following table:
| Field | Type | Description |
|---|---|---|
|
|
|
The name of the CNO object. This name is always |
|
|
| A list specifying the blocks of IP addresses from which pod IP addresses are allocated and the subnet prefix length assigned to each individual node in the cluster. For example: |
|
|
| A block of IP addresses for services. The OpenShift SDN and OVN-Kubernetes network plugins support only a single IP address block for the service network. For example:
This value is ready-only and inherited from the |
|
|
| Configures the network plugin for the cluster network. |
|
|
| The fields for this object specify the kube-proxy configuration. If you are using the OVN-Kubernetes cluster network plugin, the kube-proxy configuration has no effect. |
For a cluster that needs to deploy objects across multiple networks, ensure that you specify the same value for the clusterNetwork.hostPrefix parameter for each network type that is defined in the install-config.yaml file. Setting a different value for each clusterNetwork.hostPrefix parameter can impact the OVN-Kubernetes network plugin, where the plugin cannot effectively route object traffic among different nodes.
5.5.6.2. defaultNetwork object configuration
The values for the defaultNetwork object are defined in the following table:
| Field | Type | Description |
|---|---|---|
|
|
|
Note OpenShift Container Platform uses the OVN-Kubernetes network plugin by default. OpenShift SDN is no longer available as an installation choice for new clusters. |
|
|
| This object is only valid for the OVN-Kubernetes network plugin. |
5.5.6.3. Configuration for the OpenShift SDN network plugin
The following table describes the configuration fields for the OpenShift SDN network plugin:
| Field | Type | Description |
|---|---|---|
|
|
| The network isolation mode for OpenShift SDN. |
|
|
| The maximum transmission unit (MTU) for the VXLAN overlay network. This value is normally configured automatically. |
|
|
|
The port to use for all VXLAN packets. The default value is |
Example OpenShift SDN configuration
defaultNetwork:
type: OpenShiftSDN
openshiftSDNConfig:
mode: NetworkPolicy
mtu: 1450
vxlanPort: 47895.5.6.4. Configuration for the OVN-Kubernetes network plugin
The following table describes the configuration fields for the OVN-Kubernetes network plugin:
| Field | Type | Description |
|---|---|---|
|
|
| The maximum transmission unit (MTU) for the Geneve (Generic Network Virtualization Encapsulation) overlay network. This value is normally configured automatically. |
|
|
| The UDP port for the Geneve overlay network. |
|
|
| An object describing the IPsec mode for the cluster. |
|
|
| Specifies a configuration object for IPv4 settings. |
|
|
| Specifies a configuration object for IPv6 settings. |
|
|
| Specify a configuration object for customizing network policy audit logging. If unset, the defaults audit log settings are used. |
|
|
|
Optional: Specify a configuration object for customizing how egress traffic is sent to the node gateway. Valid values are Note While migrating egress traffic, you can expect some disruption to workloads and service traffic until the Cluster Network Operator (CNO) successfully rolls out the changes. |
| Field | Type | Description |
|---|---|---|
|
| string |
If your existing network infrastructure overlaps with the
The default value is |
|
| string |
If your existing network infrastructure overlaps with the
The default value is |
| Field | Type | Description |
|---|---|---|
|
| string |
If your existing network infrastructure overlaps with the
The default value is |
|
| string |
If your existing network infrastructure overlaps with the
The default value is |
| Field | Type | Description |
|---|---|---|
|
| integer |
The maximum number of messages to generate every second per node. The default value is |
|
| integer |
The maximum size for the audit log in bytes. The default value is |
|
| integer | The maximum number of log files that are retained. |
|
| string | One of the following additional audit log targets:
|
|
| string |
The syslog facility, such as |
| Field | Type | Description |
|---|---|---|
|
|
|
Set this field to
This field has an interaction with the Open vSwitch hardware offloading feature. If you set this field to |
|
|
|
You can control IP forwarding for all traffic on OVN-Kubernetes managed interfaces by using the |
|
|
| Optional: Specify an object to configure the internal OVN-Kubernetes masquerade address for host to service traffic for IPv4 addresses. |
|
|
| Optional: Specify an object to configure the internal OVN-Kubernetes masquerade address for host to service traffic for IPv6 addresses. |
| Field | Type | Description |
|---|---|---|
|
|
|
The masquerade IPv4 addresses that are used internally to enable host to service traffic. The host is configured with these IP addresses as well as the shared gateway bridge interface. The default value is |
| Field | Type | Description |
|---|---|---|
|
|
|
The masquerade IPv6 addresses that are used internally to enable host to service traffic. The host is configured with these IP addresses as well as the shared gateway bridge interface. The default value is |
| Field | Type | Description |
|---|---|---|
|
|
| Specifies the behavior of the IPsec implementation. Must be one of the following values:
|
You can only change the configuration for your cluster network plugin during cluster installation, except for the gatewayConfig field that can be changed at runtime as a postinstallation activity.
Example OVN-Kubernetes configuration with IPSec enabled
defaultNetwork:
type: OVNKubernetes
ovnKubernetesConfig:
mtu: 1400
genevePort: 6081
ipsecConfig:
mode: FullUsing OVNKubernetes can lead to a stack exhaustion problem on IBM Power®.
5.5.6.5. kubeProxyConfig object configuration (OpenShiftSDN container network interface only)
The values for the kubeProxyConfig object are defined in the following table:
| Field | Type | Description |
|---|---|---|
|
|
|
The refresh period for Note
Because of performance improvements introduced in OpenShift Container Platform 4.3 and greater, adjusting the |
|
|
|
The minimum duration before refreshing |
5.5.6.6. Cluster Network Operator example configuration
A complete CNO configuration is specified in the following example:
Example Cluster Network Operator object
apiVersion: operator.openshift.io/v1
kind: Network
metadata:
name: cluster
spec:
clusterNetwork:
- cidr: 10.128.0.0/14
hostPrefix: 23
serviceNetwork:
- 172.30.0.0/16
networkType: OVNKubernetes5.6. DNS Operator in OpenShift Container Platform
In OpenShift Container Platform, the DNS Operator deploys and manages a CoreDNS instance to provide a name resolution service to pods inside the cluster, enables DNS-based Kubernetes Service discovery, and resolves internal cluster.local names.
5.6.1. Checking the status of the DNS Operator
You can check the DNS Operator deployment and Cluster Operator status. The DNS Operator is deployed during installation with a Deployment object.
The DNS Operator implements the dns API from the operator.openshift.io API group. The Operator deploys CoreDNS using a daemon set, creates a service for the daemon set, and configures the kubelet to instruct pods to use the CoreDNS service IP address for name resolution.
Procedure
Use the
oc getcommand to view the deployment status:$ oc get -n openshift-dns-operator deployment/dns-operatorExample output
NAME READY UP-TO-DATE AVAILABLE AGE dns-operator 1/1 1 1 23hUse the
oc getcommand to view the state of the DNS Operator:$ oc get clusteroperator/dnsExample output
NAME VERSION AVAILABLE PROGRESSING DEGRADED SINCE MESSAGE dns 4.1.15-0.11 True False False 92mAVAILABLE,PROGRESSING, andDEGRADEDprovide information about the status of the Operator.AVAILABLEisTruewhen at least 1 pod from the CoreDNS daemon set reports anAvailablestatus condition, and the DNS service has a cluster IP address.
5.6.2. View the default DNS
View the default DNS resource and cluster DNS settings to verify the DNS configuration or troubleshoot DNS issues.
Every new OpenShift Container Platform installation has a dns.operator named default.
Procedure
Use the
oc describecommand to view the defaultdns:$ oc describe dns.operator/defaultExample output
Name: default Namespace: Labels: <none> Annotations: <none> API Version: operator.openshift.io/v1 Kind: DNS ... Status: Cluster Domain: cluster.local Cluster IP: 172.30.0.10 ...where:
Status.Cluster Domain- Specifiecs the base DNS domain used to construct fully qualified pod and service domain names.
Status.Cluster IP- Specifies the address that pods query for name resolution. The IP is defined as the 10th address in the service CIDR range.
To find the service CIDR range, such as
172.30.0.0/16, of your cluster, use theoc getcommand:$ oc get networks.config/cluster -o jsonpath='{$.status.serviceNetwork}'
5.6.3. Using DNS forwarding
Configure DNS forwarding servers and upstream resolvers for the cluster.
You can use DNS forwarding to override the default forwarding configuration in the /etc/resolv.conf file in the following ways:
-
Specify name servers (
spec.servers) for every zone. If the forwarded zone is the ingress domain managed by OpenShift Container Platform, then the upstream name server must be authorized for the domain. -
Provide a list of upstream DNS servers (
spec.upstreamResolvers). - Change the default forwarding policy.
A DNS forwarding configuration for the default domain can have both the default servers specified in the /etc/resolv.conf file and the upstream DNS servers.
Procedure
Modify the DNS Operator object named
default:$ oc edit dns.operator/defaultAfter you issue the previous command, the Operator creates and updates the config map named
dns-defaultwith additional server configuration blocks based onspec.servers. If none of the servers have a zone that matches the query, then name resolution falls back to the upstream DNS servers.Configuring DNS forwarding
apiVersion: operator.openshift.io/v1 kind: DNS metadata: name: default spec: cache: negativeTTL: 0s positiveTTL: 0s logLevel: Normal nodePlacement: {} operatorLogLevel: Normal servers: - name: example-server zones: - example.com forwardPlugin: policy: Random upstreams: - 1.1.1.1 - 2.2.2.2:5353 upstreamResolvers: policy: Random protocolStrategy: "" transportConfig: {} upstreams: - type: SystemResolvConf - type: Network address: 1.2.3.4 port: 53 status: clusterDomain: cluster.local clusterIP: x.y.z.10 conditions: ...where:
spec.servers.name-
Must comply with the
rfc6335service name syntax. spec.servers.zones-
Must conform to the
rfc1123subdomain syntax. The cluster domaincluster.localis invalid forzones. spec.servers.forwardPlugin.policy-
Specifies the upstream selection policy. Defaults to
Random; allowed values areRoundRobinandSequential. spec.servers.forwardPlugin.upstreams-
Must provide no more than 15
upstreamsentries perforwardPlugin. spec.upstreamResolvers.upstreams-
Specifies an
upstreamResolversto override the default forwarding policy and forward DNS resolution to the specified DNS resolvers (upstream resolvers) for the default domain. You can use this field when you need custom upstream resolvers; otherwise queries use the servers declared in/etc/resolv.conf. spec.upstreamResolvers.policy-
Specifies the upstream selection order. Defaults to
Sequential; allowed values areRandom,RoundRobin, andSequential. spec.upstreamResolvers.protocolStrategy-
Specify
TCPto force the protocol to use for upstream DNS requests, even if the request uses UDP. Valid values areTCPand omitted. When omitted, the platform chooses a default, normally the protocol of the original client request. spec.upstreamResolvers.transportConfig- Specifies the transport type, server name, and optional custom CA or CA bundle to use when forwarding DNS requests to an upstream resolver.
spec.upstreamResolvers.upstreams.type-
Specifies two types of
upstreams:SystemResolvConforNetwork.SystemResolvConfconfigures the upstream to use/etc/resolv.confandNetworkdefines aNetworkresolver. You can specify one or both. spec.upstreamResolvers.upstreams.address-
Specifies a valid IPv4 or IPv6 address when type is
Network. spec.upstreamResolvers.upstreams.port-
Specifies an optional field to provide a port number. Valid values are between
1and65535; defaults to 853 when omitted.
5.6.4. Checking DNS Operator status
You can inspect the status and view the details of the DNS Operator by using the oc describe command.
Procedure
View the status of the DNS Operator:
$ oc describe clusteroperators/dnsThough the messages and spelling might vary in a specific release, the expected status output looks like:
Status: Conditions: Last Transition Time: <date> Message: DNS "default" is available. Reason: AsExpected Status: True Type: Available Last Transition Time: <date> Message: Desired and current number of DNSes are equal Reason: AsExpected Status: False Type: Progressing Last Transition Time: <date> Reason: DNSNotDegraded Status: False Type: Degraded Last Transition Time: <date> Message: DNS default is upgradeable: DNS Operator can be upgraded Reason: DNSUpgradeable Status: True Type: Upgradeable
5.6.5. Viewing DNS Operator logs
You can view DNS Operator logs to troubleshoot DNS issues, verify configuration changes, and monitor activity by using the by using the oc logs command.
Procedure
View the logs of the DNS Operator by running the following command:
$ oc logs -n openshift-dns-operator deployment/dns-operator -c dns-operator
5.6.6. Setting the CoreDNS log level
Set CoreDNS log levels to control the detail of DNS error logging.
Log levels for CoreDNS and the CoreDNS Operator are set by using different methods. You can configure the CoreDNS log level to determine the amount of detail in logged error messages. The valid values for CoreDNS log level are Normal, Debug, and Trace. The default logLevel is Normal.
The CoreDNS error log level is always enabled. The following log level settings report different error responses:
-
logLevel:Normalenables the "errors" class:log . { class error }. -
logLevel:Debugenables the "denial" class:log . { class denial error }. -
logLevel:Traceenables the "all" class:log . { class all }.
Procedure
To set
logLeveltoDebug, enter the following command:$ oc patch dnses.operator.openshift.io/default -p '{"spec":{"logLevel":"Debug"}}' --type=mergeTo set
logLeveltoTrace, enter the following command:$ oc patch dnses.operator.openshift.io/default -p '{"spec":{"logLevel":"Trace"}}' --type=merge
Verification
To ensure the desired log level was set, check the config map:
$ oc get configmap/dns-default -n openshift-dns -o yamlFor example, after setting the
logLeveltoTrace, you should see this stanza in each server block:errors log . { class all }
5.6.7. Viewing the CoreDNS logs
You can view CoreDNS pod logs to troubleshoot DNS issues by using the oc logs command.
Procedure
View the logs of a specific CoreDNS pod by entering the following command:
$ oc -n openshift-dns logs -c dns <core_dns_pod_name>Follow the logs of all CoreDNS pods by entering the following command:
$ oc -n openshift-dns logs -c dns -l dns.operator.openshift.io/daemonset-dns=default -f --max-log-requests=<number>1 -
<number>: Specifies the number of DNS pods to stream logs from. The maximum is 6.
-
5.6.8. Setting the CoreDNS Operator log level
You can configure the Operator log level to quickly track down OpenShift DNS issues.
The valid values for operatorLogLevel are Normal, Debug, and Trace. Trace has the most detailed information. The default operatorlogLevel is Normal. There are seven logging levels for Operator issues: Trace, Debug, Info, Warning, Error, Unrecoverable, and Panic. After the logging level is set, log entries with that severity or anything above it will be logged.
-
operatorLogLevel: "Normal"setslogrus.SetLogLevel("Info"). -
operatorLogLevel: "Debug"setslogrus.SetLogLevel("Debug"). -
operatorLogLevel: "Trace"setslogrus.SetLogLevel("Trace").
Procedure
To set
operatorLogLeveltoDebug, enter the following command:$ oc patch dnses.operator.openshift.io/default -p '{"spec":{"operatorLogLevel":"Debug"}}' --type=mergeTo set
operatorLogLeveltoTrace, enter the following command:$ oc patch dnses.operator.openshift.io/default -p '{"spec":{"operatorLogLevel":"Trace"}}' --type=merge
Verification
To review the resulting change, enter the following command:
$ oc get dnses.operator -A -oyamlYou should see two log level entries. The
operatorLogLevelapplies to OpenShift DNS Operator issues, and thelogLevelapplies to the daemonset of CoreDNS pods:logLevel: Trace operatorLogLevel: DebugTo review the logs for the daemonset, enter the following command:
$ oc logs -n openshift-dns ds/dns-default
5.6.9. Tuning the CoreDNS cache
For CoreDNS, you can configure the maximum duration of both successful or unsuccessful caching, also known respectively as positive or negative caching. Tuning the cache duration of DNS query responses can reduce the load for any upstream DNS resolvers.
Setting TTL fields to low values could lead to an increased load on the cluster, any upstream resolvers, or both.
Procedure
Edit the DNS Operator object named
defaultby running the following command:$ oc edit dns.operator.openshift.io/defaultModify the time-to-live (TTL) caching values:
Configuring DNS caching
apiVersion: operator.openshift.io/v1 kind: DNS metadata: name: default spec: cache: positiveTTL: 1h negativeTTL: 0.5h10mwhere:
spec.cache.positiveTTL-
Specifies a string value that is converted to its respective number of seconds by CoreDNS. If this field is omitted, the value is assumed to be
0sand the cluster uses the internal default value of900sas a fallback. spec.cache.negativeTTL-
Specifies a string value that is converted to its respective number of seconds by CoreDNS. If this field is omitted, the value is assumed to be
0sand the cluster uses the internal default value of30sas a fallback.
Verification
To review the change, look at the config map again by running the following command:
$ oc get configmap/dns-default -n openshift-dns -o yamlVerify that you see entries that look like the following example:
cache 3600 { denial 9984 2400 }
5.6.9.1. Changing the DNS Operator managementState
You can change from the default Managed state to Unmanaged to stop the DNS Operator from managing its resources in order to apply a workaround or test a configuration change.
The DNS Operator manages the CoreDNS component to provide a name resolution service for pods and services in the cluster. The managementState of the DNS Operator is set to Managed by default, which means that the DNS Operator is actively managing its resources. You can change it to Unmanaged, which means the DNS Operator is not managing its resources.
The following are use cases for changing the DNS Operator managementState:
-
You are a developer and want to test a configuration change to see if it fixes an issue in CoreDNS. You can stop the DNS Operator from overwriting the configuration change by setting the
managementStatetoUnmanaged. -
You are a cluster administrator and have reported an issue with CoreDNS, but need to apply a workaround until the issue is fixed. You can set the
managementStatefield of the DNS Operator toUnmanagedto apply the workaround.
You cannot upgrade while the managementState is set to Unmanaged.
Procedure
Change
managementStatetoUnmanagedin the DNS Operator by running the following command:oc patch dns.operator.openshift.io default --type merge --patch '{"spec":{"managementState":"Unmanaged"}}'Review
managementStateof the DNS Operator by using thejsonpathcommand-line JSON parser:$ oc get dns.operator.openshift.io default -ojsonpath='{.spec.managementState}'
5.6.9.2. Controlling DNS pod placement
Control where CoreDNS and node-resolver pods run by using taints, tolerations, and selectors.
The DNS Operator has two daemon sets: one for CoreDNS called dns-default and one for managing the /etc/hosts file called node-resolver.
You can assign and run CoreDNS pods on specified nodes. For example, if the cluster administrator has configured security policies that prohibit communication between pairs of nodes, you can configure CoreDNS pods to run on a restricted set of nodes.
DNS service is available to all pods if the following circumstances are true:
- DNS pods are running on some nodes in the cluster.
- The nodes on which DNS pods are not running have network connectivity to nodes on which DNS pods are running,
The node-resolver daemon set must run on every node host because it adds an entry for the cluster image registry to support pulling images. The node-resolver pods have only one job: to look up the image-registry.openshift-image-registry.svc service’s cluster IP address and add it to /etc/hosts on the node host so that the container runtime can resolve the service name.
As a cluster administrator, you can use a custom node selector to configure the daemon set for CoreDNS to run or not run on certain nodes.
Prerequisites
-
You installed the
ocCLI. -
You are logged in to the cluster as a user with
cluster-adminprivileges. -
Your DNS Operator
managementStateis set toManaged.
Procedure
To allow the daemon set for CoreDNS to run on certain nodes, configure a taint and toleration:
$ oc adm taint nodes <node_name> dns-only=abc:NoExecuteReplace
<node_name>with the actual name of the node.Modify the DNS Operator object named
defaultto include the corresponding toleration by entering the following command:$ oc edit dns.operator/defaultSpecify a taint key and a toleration for the taint:
apiVersion: operator.openshift.io/v1 kind: DNS metadata: name: default spec: nodePlacement: tolerations: - effect: NoExecute key: "dns-only" operator: Equal value: abc tolerationSeconds: 3600
-
If the
keyfield is set todns-only, it can be tolerated indefinitely. The
tolerationSecondsfield is optional.Optional: To specify node placement using a node selector, modify the default DNS Operator:
Edit the DNS Operator object named
defaultto include a node selector:apiVersion: operator.openshift.io/v1 kind: DNS metadata: name: default spec: nodePlacement: nodeSelector: node-role.kubernetes.io/control-plane: ""
-
The
spec.nodePlacement.nodeSelectorfield in the example ensures that the CoreDNS pods run only on control plane nodes.
5.6.9.3. Configuring DNS forwarding with TLS
Configure DNS forwarding with TLS to secure queries to upstream resolvers.
When working in a highly regulated environment, you might need the ability to secure DNS traffic when forwarding requests to upstream resolvers so that you can ensure additional DNS traffic and data privacy.
Be aware that CoreDNS caches forwarded connections for 10 seconds. CoreDNS will hold a TCP connection open for those 10 seconds if no request is issued.
With large clusters, ensure that your DNS server is aware that it might get many new connections to hold open because you can initiate a connection per node. Set up your DNS hierarchy accordingly to avoid performance issues.
Procedure
Modify the DNS Operator object named
default:$ oc edit dns.operator/defaultCluster administrators can configure transport layer security (TLS) for forwarded DNS queries.
Configuring DNS forwarding with TLS
apiVersion: operator.openshift.io/v1 kind: DNS metadata: name: default spec: servers: - name: example_server zones: - example.com forwardPlugin: transportConfig: transport: TLS tls: caBundle: name: mycacert serverName: dnstls.example.com policy: Random upstreams: - 1.1.1.1 - 2.2.2.2:5353 upstreamResolvers: transportConfig: transport: TLS tls: caBundle: name: mycacert serverName: dnstls.example.com upstreams: - type: Network address: 1.2.3.4 port: 53where:
spec.servers.name-
Must comply with the
rfc6335service name syntax. spec.servers.zones-
Must conform to the
rfc1123subdomain syntax. The cluster domain,cluster.local, is invalid forzones. spec.servers.forwardPlugin.transportConfig.transport-
Must be set to
TLSwhen configuring TLS forwarding. spec.servers.forwardPlugin.transportConfig.tls.serverName- Must be set to the server name indication (SNI) server name used to validate the upstream TLS certificate.
spec.servers.forwardPlugin.policy-
Specifies the upstream selection policy. Defaults to
Random; valid values areRoundRobinandSequential. spec.servers.forwardPlugin.upstreams-
Must provide upstream resolvers; maximum 15 entries per
forwardPlugin. spec.upstreamResolvers.upstreams-
Specifies an optional field to override the default policy for the default domain. Use the
Networktype only when TLS is enabled and provide an IP address. If omitted, queries use/etc/resolv.conf. spec.upstreamResolvers.upstreams.address- Must be a valid IPv4 or IPv6 address.
spec.upstreamResolvers.upstreams.portSpecifies an optional field to provide a port number. Valid values are between
1and65535; defaults to 853 when omitted.NoteIf
serversis undefined or invalid, the config map only contains the default server.
Verification
View the config map:
$ oc get configmap/dns-default -n openshift-dns -o yamlSample DNS ConfigMap based on TLS forwarding example
apiVersion: v1 data: Corefile: | example.com:5353 { forward . 1.1.1.1 2.2.2.2:5353 } bar.com:5353 example.com:5353 { forward . 3.3.3.3 4.4.4.4:5454 } .:5353 { errors health kubernetes cluster.local in-addr.arpa ip6.arpa { pods insecure upstream fallthrough in-addr.arpa ip6.arpa } prometheus :9153 forward . /etc/resolv.conf 1.2.3.4:53 { policy Random } cache 30 reload } kind: ConfigMap metadata: labels: dns.operator.openshift.io/owning-dns: default name: dns-default namespace: openshift-dns-
The
data.Corefilekey contains the Corefile configuration for the DNS server. Changes to theforwardPlugintriggers a rolling update of the CoreDNS daemon set.
-
The
5.7. Ingress Operator in OpenShift Container Platform
The Ingress Operator implements the IngressController API and is the component responsible for enabling external access to OpenShift Container Platform cluster services.
5.7.1. OpenShift Container Platform Ingress Operator
When you create your OpenShift Container Platform cluster, pods and services running on the cluster are each allocated their own IP addresses. The IP addresses are accessible to other pods and services running nearby but are not accessible to outside clients.
The Ingress Operator makes it possible for external clients to access your service by deploying and managing one or more HAProxy-based Ingress Controllers to handle routing. You can use the Ingress Operator to route traffic by specifying OpenShift Container Platform Route and Kubernetes Ingress resources. Configurations within the Ingress Controller, such as the ability to define endpointPublishingStrategy type and internal load balancing, provide ways to publish Ingress Controller endpoints.
5.7.2. The Ingress configuration asset
The installation program generates an asset with an Ingress resource in the config.openshift.io API group, cluster-ingress-02-config.yml.
YAML Definition of the Ingress resource
apiVersion: config.openshift.io/v1
kind: Ingress
metadata:
name: cluster
spec:
domain: apps.openshiftdemos.com
The installation program stores this asset in the cluster-ingress-02-config.yml file in the manifests/ directory. This Ingress resource defines the cluster-wide configuration for Ingress. This Ingress configuration is used as follows:
- The Ingress Operator uses the domain from the cluster Ingress configuration as the domain for the default Ingress Controller.
-
The OpenShift API Server Operator uses the domain from the cluster Ingress configuration. This domain is also used when generating a default host for a
Routeresource that does not specify an explicit host.
5.7.3. Ingress Controller configuration parameters
The IngressController custom resource (CR) includes optional configuration parameters that you can configure to meet specific needs for your organization.
| Parameter | Description |
|---|---|
|
|
The
If empty, the default value is |
|
|
|
|
|
For cloud environments, use the
On Google Cloud, AWS, and Azure you can configure the following
If not set, the default value is based on
For most platforms, the
For non-cloud environments, such as a bare-metal platform, use the
If you do not set a value in one of these fields, the default value is based on binding ports specified in the
If you need to update the
|
|
|
The
The secret must contain the following keys and data: *
If not set, a wildcard certificate is automatically generated and used. The certificate is valid for the Ingress Controller The in-use certificate, whether generated or user-specified, is automatically integrated with OpenShift Container Platform built-in OAuth server. |
|
|
|
|
|
|
|
|
If not set, the defaults values are used. Note
The |
|
|
If not set, the default value is based on the
When using the
The minimum TLS version for Ingress Controllers is Note
Ciphers and the minimum TLS version of the configured security profile are reflected in the Important
The Ingress Operator converts the TLS |
|
|
The
The |
|
|
|
|
|
|
|
|
By setting the
By default, the policy is set to
By setting These adjustments are only applied to cleartext, edge-terminated, and re-encrypt routes, and only when using HTTP/1.
For request headers, these adjustments are applied only for routes that have the
|
|
|
|
|
|
|
|
|
For any cookie that you want to capture, the following parameters must be in your
For example: |
|
|
|
|
|
|
|
|
The
|
|
|
The
These connections come from load balancer health probes or web browser speculative connections (preconnect) and can be safely ignored. However, these requests can be caused by network errors, so setting this field to |
5.7.3.1. Ingress Controller TLS security profiles
TLS security profiles provide a way for servers to regulate which ciphers a connecting client can use when connecting to the server.
5.7.3.1.1. Understanding TLS security profiles
You can use a TLS (Transport Layer Security) security profile, as described in this section, to define which TLS ciphers are required by various OpenShift Container Platform components.
The OpenShift Container Platform TLS security profiles are based on Mozilla recommended configurations.
You can specify one of the following TLS security profiles for each component:
| Profile | Description |
|---|---|
|
| This profile is intended for use with legacy clients or libraries. The profile is based on the Old backward compatibility recommended configuration.
The Note For the Ingress Controller, the minimum TLS version is converted from 1.0 to 1.1. |
|
| This profile is the default TLS security profile for the Ingress Controller, kubelet, and control plane. The profile is based on the Intermediate compatibility recommended configuration.
The Note This profile is the recommended configuration for the majority of clients. |
|
| This profile is intended for use with modern clients that have no need for backwards compatibility. This profile is based on the Modern compatibility recommended configuration.
The |
|
| This profile allows you to define the TLS version and ciphers to use. Warning
Use caution when using a |
When using one of the predefined profile types, the effective profile configuration is subject to change between releases. For example, given a specification to use the Intermediate profile deployed on release X.Y.Z, an upgrade to release X.Y.Z+1 might cause a new profile configuration to be applied, resulting in a rollout.
5.7.3.1.2. Configuring the TLS security profile for the Ingress Controller
To configure a TLS security profile for an Ingress Controller, edit the IngressController custom resource (CR) to specify a predefined or custom TLS security profile. If a TLS security profile is not configured, the default value is based on the TLS security profile set for the API server.
Sample IngressController CR that configures the Old TLS security profile
apiVersion: operator.openshift.io/v1
kind: IngressController
...
spec:
tlsSecurityProfile:
old: {}
type: Old
...The TLS security profile defines the minimum TLS version and the TLS ciphers for TLS connections for Ingress Controllers.
You can see the ciphers and the minimum TLS version of the configured TLS security profile in the IngressController custom resource (CR) under Status.Tls Profile and the configured TLS security profile under Spec.Tls Security Profile. For the Custom TLS security profile, the specific ciphers and minimum TLS version are listed under both parameters.
The HAProxy Ingress Controller image supports TLS 1.3 and the Modern profile.
The Ingress Operator also converts the TLS 1.0 of an Old or Custom profile to 1.1.
Prerequisites
-
You have access to the cluster as a user with the
cluster-adminrole.
Procedure
Edit the
IngressControllerCR in theopenshift-ingress-operatorproject to configure the TLS security profile:$ oc edit IngressController default -n openshift-ingress-operatorAdd the
spec.tlsSecurityProfilefield:Sample
IngressControllerCR for aCustomprofileapiVersion: operator.openshift.io/v1 kind: IngressController ... spec: tlsSecurityProfile: type: Custom1 custom:2 ciphers:3 - ECDHE-ECDSA-CHACHA20-POLY1305 - ECDHE-RSA-CHACHA20-POLY1305 - ECDHE-RSA-AES128-GCM-SHA256 - ECDHE-ECDSA-AES128-GCM-SHA256 minTLSVersion: VersionTLS11 ...- Save the file to apply the changes.
Verification
Verify that the profile is set in the
IngressControllerCR:$ oc describe IngressController default -n openshift-ingress-operatorExample output
Name: default Namespace: openshift-ingress-operator Labels: <none> Annotations: <none> API Version: operator.openshift.io/v1 Kind: IngressController ... Spec: ... Tls Security Profile: Custom: Ciphers: ECDHE-ECDSA-CHACHA20-POLY1305 ECDHE-RSA-CHACHA20-POLY1305 ECDHE-RSA-AES128-GCM-SHA256 ECDHE-ECDSA-AES128-GCM-SHA256 Min TLS Version: VersionTLS11 Type: Custom ...
5.7.3.1.3. Configuring mutual TLS authentication
You can configure the Ingress Controller to enable mutual TLS (mTLS) authentication by setting a spec.clientTLS value. The clientTLS value configures the Ingress Controller to verify client certificates. This configuration includes setting a clientCA value, which is a reference to a config map. The config map contains the PEM-encoded CA certificate bundle that is used to verify a client’s certificate. Optionally, you can also configure a list of certificate subject filters.
If the clientCA value specifies an X509v3 certificate revocation list (CRL) distribution point, the Ingress Operator downloads and manages a CRL config map based on the HTTP URI X509v3 CRL Distribution Point specified in each provided certificate. The Ingress Controller uses this config map during mTLS/TLS negotiation. Requests that do not provide valid certificates are rejected.
Prerequisites
-
You have access to the cluster as a user with the
cluster-adminrole. - You have a PEM-encoded CA certificate bundle.
If your CA bundle references a CRL distribution point, you must have also included the end-entity or leaf certificate to the client CA bundle. This certificate must have included an HTTP URI under
CRL Distribution Points, as described in RFC 5280. For example:Issuer: C=US, O=Example Inc, CN=Example Global G2 TLS RSA SHA256 2020 CA1 Subject: SOME SIGNED CERT X509v3 CRL Distribution Points: Full Name: URI:http://crl.example.com/example.crl
Procedure
In the
openshift-confignamespace, create a config map from your CA bundle:$ oc create configmap \ router-ca-certs-default \ --from-file=ca-bundle.pem=client-ca.crt \1 -n openshift-config- 1
- The config map data key must be
ca-bundle.pem, and the data value must be a CA certificate in PEM format.
Edit the
IngressControllerresource in theopenshift-ingress-operatorproject:$ oc edit IngressController default -n openshift-ingress-operatorAdd the
spec.clientTLSfield and subfields to configure mutual TLS:Sample
IngressControllerCR for aclientTLSprofile that specifies filtering patternsapiVersion: operator.openshift.io/v1 kind: IngressController metadata: name: default namespace: openshift-ingress-operator spec: clientTLS: clientCertificatePolicy: Required clientCA: name: router-ca-certs-default allowedSubjectPatterns: - "^/CN=example.com/ST=NC/C=US/O=Security/OU=OpenShift$"Optional, get the Distinguished Name (DN) for
allowedSubjectPatternsby entering the following command.$ openssl x509 -in custom-cert.pem -noout -subjectExample output
subject=C=US, ST=NC, O=Security, OU=OpenShift, CN=example.com
5.7.4. View the default Ingress Controller
The Ingress Operator is a core feature of OpenShift Container Platform and is enabled out of the box.
Every new OpenShift Container Platform installation has an ingresscontroller named default. It can be supplemented with additional Ingress Controllers. If the default ingresscontroller is deleted, the Ingress Operator will automatically recreate it within a minute.
Procedure
View the default Ingress Controller:
$ oc describe --namespace=openshift-ingress-operator ingresscontroller/default
5.7.5. View Ingress Operator status
You can view and inspect the status of your Ingress Operator.
Procedure
View your Ingress Operator status:
$ oc describe clusteroperators/ingress
5.7.6. View Ingress Controller logs
You can view your Ingress Controller logs.
Procedure
View your Ingress Controller logs:
$ oc logs --namespace=openshift-ingress-operator deployments/ingress-operator -c <container_name>
5.7.7. View Ingress Controller status
Your can view the status of a particular Ingress Controller.
Procedure
View the status of an Ingress Controller:
$ oc describe --namespace=openshift-ingress-operator ingresscontroller/<name>
5.7.8. Creating a custom Ingress Controller
As a cluster administrator, you can create a new custom Ingress Controller. Because the default Ingress Controller might change during OpenShift Container Platform updates, creating a custom Ingress Controller can be helpful when maintaining a configuration manually that persists across cluster updates.
This example provides a minimal spec for a custom Ingress Controller. To further customize your custom Ingress Controller, see "Configuring the Ingress Controller".
Prerequisites
-
Install the OpenShift CLI (
oc). -
Log in as a user with
cluster-adminprivileges.
Procedure
Create a YAML file that defines the custom
IngressControllerobject:Example
custom-ingress-controller.yamlfileapiVersion: operator.openshift.io/v1 kind: IngressController metadata: name: <custom_name>1 namespace: openshift-ingress-operator spec: defaultCertificate: name: <custom-ingress-custom-certs>2 replicas: 13 domain: <custom_domain>4 - 1
- Specify the a custom
namefor theIngressControllerobject. - 2
- Specify the name of the secret with the custom wildcard certificate.
- 3
- Minimum replica needs to be ONE
- 4
- Specify the domain to your domain name. The domain specified on the IngressController object and the domain used for the certificate must match. For example, if the domain value is "custom_domain.mycompany.com", then the certificate must have SAN *.custom_domain.mycompany.com (with the
*.added to the domain).
Create the object by running the following command:
$ oc create -f custom-ingress-controller.yaml
5.7.9. Configuring the Ingress Controller
5.7.9.1. Setting a custom default certificate
As an administrator, you can configure an Ingress Controller to use a custom certificate by creating a Secret resource and editing the IngressController custom resource (CR).
Prerequisites
- You must have a certificate/key pair in PEM-encoded files, where the certificate is signed by a trusted certificate authority or by a private trusted certificate authority that you configured in a custom PKI.
Your certificate meets the following requirements:
- The certificate is valid for the ingress domain.
-
The certificate uses the
subjectAltNameextension to specify a wildcard domain, such as*.apps.ocp4.example.com.
You must have an
IngressControllerCR, which includes just having thedefaultIngressControllerCR. You can run the following command to check that you have anIngressControllerCR:$ oc --namespace openshift-ingress-operator get ingresscontrollers
If you have intermediate certificates, they must be included in the tls.crt file of the secret containing a custom default certificate. Order matters when specifying a certificate; list your intermediate certificate(s) after any server certificate(s).
Procedure
The following assumes that the custom certificate and key pair are in the tls.crt and tls.key files in the current working directory. Substitute the actual path names for tls.crt and tls.key. You also may substitute another name for custom-certs-default when creating the Secret resource and referencing it in the IngressController CR.
This action will cause the Ingress Controller to be redeployed, using a rolling deployment strategy.
Create a Secret resource containing the custom certificate in the
openshift-ingressnamespace using thetls.crtandtls.keyfiles.$ oc --namespace openshift-ingress create secret tls custom-certs-default --cert=tls.crt --key=tls.keyUpdate the IngressController CR to reference the new certificate secret:
$ oc patch --type=merge --namespace openshift-ingress-operator ingresscontrollers/default \ --patch '{"spec":{"defaultCertificate":{"name":"custom-certs-default"}}}'Verify the update was effective:
$ echo Q |\ openssl s_client -connect console-openshift-console.apps.<domain>:443 -showcerts 2>/dev/null |\ openssl x509 -noout -subject -issuer -enddatewhere:
<domain>- Specifies the base domain name for your cluster.
Example output
subject=C = US, ST = NC, L = Raleigh, O = RH, OU = OCP4, CN = *.apps.example.com issuer=C = US, ST = NC, L = Raleigh, O = RH, OU = OCP4, CN = example.com notAfter=May 10 08:32:45 2022 GMTipYou can alternatively apply the following YAML to set a custom default certificate:
apiVersion: operator.openshift.io/v1 kind: IngressController metadata: name: default namespace: openshift-ingress-operator spec: defaultCertificate: name: custom-certs-defaultThe certificate secret name should match the value used to update the CR.
Once the IngressController CR has been modified, the Ingress Operator updates the Ingress Controller’s deployment to use the custom certificate.
5.7.9.2. Removing a custom default certificate
As an administrator, you can remove a custom certificate that you configured an Ingress Controller to use.
Prerequisites
-
You have access to the cluster as a user with the
cluster-adminrole. -
You have installed the OpenShift CLI (
oc). - You previously configured a custom default certificate for the Ingress Controller.
Procedure
To remove the custom certificate and restore the certificate that ships with OpenShift Container Platform, enter the following command:
$ oc patch -n openshift-ingress-operator ingresscontrollers/default \ --type json -p $'- op: remove\n path: /spec/defaultCertificate'There can be a delay while the cluster reconciles the new certificate configuration.
Verification
To confirm that the original cluster certificate is restored, enter the following command:
$ echo Q | \ openssl s_client -connect console-openshift-console.apps.<domain>:443 -showcerts 2>/dev/null | \ openssl x509 -noout -subject -issuer -enddatewhere:
<domain>- Specifies the base domain name for your cluster.
Example output
subject=CN = *.apps.<domain> issuer=CN = ingress-operator@1620633373 notAfter=May 10 10:44:36 2023 GMT
5.7.9.3. Autoscaling an Ingress Controller
You can automatically scale an Ingress Controller to dynamically meet routing performance or availability requirements. For example, the requirement to increase throughput.
The following procedure provides an example for scaling up the default Ingress Controller.
Prerequisites
-
You have the OpenShift CLI (
oc) installed. -
You have access to an OpenShift Container Platform cluster as a user with the
cluster-adminrole. On VMware vSphere, bare-metal, and Nutanix installer-provisioned infrastructure, scaling up Ingress Controller pods does not improve external traffic performance. To improve performance, ensure that you complete the following prerequisites:
- You manually configured a user-managed load balancer for your cluster.
- You ensured that the load balancer was configured for the cluster nodes that handle incoming traffic from the Ingress Controller.
You installed the Custom Metrics Autoscaler Operator and an associated KEDA Controller.
-
You can install the Operator by using OperatorHub on the web console. After you install the Operator, you can create an instance of
KedaController.
-
You can install the Operator by using OperatorHub on the web console. After you install the Operator, you can create an instance of
Procedure
Create a service account to authenticate with Thanos by running the following command:
$ oc create -n openshift-ingress-operator serviceaccount thanos && oc describe -n openshift-ingress-operator serviceaccount thanosExample output
Name: thanos Namespace: openshift-ingress-operator Labels: <none> Annotations: <none> Image pull secrets: thanos-dockercfg-kfvf2 Mountable secrets: thanos-dockercfg-kfvf2 Tokens: <none> Events: <none>Manually create the service account secret token with the following command:
$ oc apply -f - <<EOF apiVersion: v1 kind: Secret metadata: name: thanos-token namespace: openshift-ingress-operator annotations: kubernetes.io/service-account.name: thanos type: kubernetes.io/service-account-token EOFDefine a
TriggerAuthenticationobject within theopenshift-ingress-operatornamespace by using the service account’s token.Create the
TriggerAuthenticationobject and pass the value of thesecretvariable to theTOKENparameter:$ oc apply -f - <<EOF apiVersion: keda.sh/v1alpha1 kind: TriggerAuthentication metadata: name: keda-trigger-auth-prometheus namespace: openshift-ingress-operator spec: secretTargetRef: - parameter: bearerToken name: thanos-token key: token - parameter: ca name: thanos-token key: ca.crt EOF
Create and apply a role for reading metrics from Thanos:
Create a new role,
thanos-metrics-reader.yaml, that reads metrics from pods and nodes:thanos-metrics-reader.yaml
apiVersion: rbac.authorization.k8s.io/v1 kind: Role metadata: name: thanos-metrics-reader namespace: openshift-ingress-operator rules: - apiGroups: - "" resources: - pods - nodes verbs: - get - apiGroups: - metrics.k8s.io resources: - pods - nodes verbs: - get - list - watch - apiGroups: - "" resources: - namespaces verbs: - getApply the new role by running the following command:
$ oc apply -f thanos-metrics-reader.yaml
Add the new role to the service account by entering the following commands:
$ oc adm policy -n openshift-ingress-operator add-role-to-user thanos-metrics-reader -z thanos --role-namespace=openshift-ingress-operator$ oc adm policy -n openshift-ingress-operator add-cluster-role-to-user cluster-monitoring-view -z thanosNoteThe argument
add-cluster-role-to-useris only required if you use cross-namespace queries. The following step uses a query from thekube-metricsnamespace which requires this argument.Create a new
ScaledObjectYAML file,ingress-autoscaler.yaml, that targets the default Ingress Controller deployment:Example
ScaledObjectdefinitionapiVersion: keda.sh/v1alpha1 kind: ScaledObject metadata: name: ingress-scaler namespace: openshift-ingress-operator spec: scaleTargetRef:1 apiVersion: operator.openshift.io/v1 kind: IngressController name: default envSourceContainerName: ingress-operator minReplicaCount: 1 maxReplicaCount: 202 cooldownPeriod: 1 pollingInterval: 1 triggers: - type: prometheus metricType: AverageValue metadata: serverAddress: https://thanos-querier.openshift-monitoring.svc.cluster.local:90913 namespace: openshift-ingress-operator4 metricName: 'kube-node-role' threshold: '1' query: 'sum(kube_node_role{role="worker",service="kube-state-metrics"})'5 authModes: "bearer" authenticationRef: name: keda-trigger-auth-prometheus- 1
- The custom resource that you are targeting. In this case, the Ingress Controller.
- 2
- Optional: The maximum number of replicas. If you omit this field, the default maximum is set to 100 replicas.
- 3
- The Thanos service endpoint in the
openshift-monitoringnamespace. - 4
- The Ingress Operator namespace.
- 5
- This expression evaluates to however many worker nodes are present in the deployed cluster.
ImportantIf you are using cross-namespace queries, you must target port 9091 and not port 9092 in the
serverAddressfield. You also must have elevated privileges to read metrics from this port.Apply the custom resource definition by running the following command:
$ oc apply -f ingress-autoscaler.yaml
Verification
Verify that the default Ingress Controller is scaled out to match the value returned by the
kube-state-metricsquery by running the following commands:Use the
grepcommand to search the Ingress Controller YAML file for the number of replicas:$ oc get -n openshift-ingress-operator ingresscontroller/default -o yaml | grep replicas:Get the pods in the
openshift-ingressproject:$ oc get pods -n openshift-ingressExample output
NAME READY STATUS RESTARTS AGE router-default-7b5df44ff-l9pmm 2/2 Running 0 17h router-default-7b5df44ff-s5sl5 2/2 Running 0 3d22h router-default-7b5df44ff-wwsth 2/2 Running 0 66s
5.7.9.4. Scaling an Ingress Controller
Manually scale an Ingress Controller to meeting routing performance or availability requirements such as the requirement to increase throughput. oc commands are used to scale the IngressController resource. The following procedure provides an example for scaling up the default IngressController.
Scaling is not an immediate action, as it takes time to create the desired number of replicas.
Prerequisites
On VMware vSphere, bare-metal, and Nutanix installer-provisioned infrastructure, scaling up Ingress Controller pods does not improve external traffic performance. To improve performance, ensure that you complete the following prerequisites:
- You manually configured a user-managed load balancer for your cluster.
- You ensured that the load balancer was configured for the cluster nodes that handle incoming traffic from the Ingress Controller.
Procedure
View the current number of available replicas for the default
IngressController:$ oc get -n openshift-ingress-operator ingresscontrollers/default -o jsonpath='{$.status.availableReplicas}'Scale the default
IngressControllerto the desired number of replicas by using theoc patchcommand. The following example scales the defaultIngressControllerto 3 replicas.$ oc patch -n openshift-ingress-operator ingresscontroller/default --patch '{"spec":{"replicas": 3}}' --type=mergeVerify that the default
IngressControllerscaled to the number of replicas that you specified:$ oc get -n openshift-ingress-operator ingresscontrollers/default -o jsonpath='{$.status.availableReplicas}'TipYou can alternatively apply the following YAML to scale an Ingress Controller to three replicas:
apiVersion: operator.openshift.io/v1 kind: IngressController metadata: name: default namespace: openshift-ingress-operator spec: replicas: 31 - 1
- If you need a different amount of replicas, change the
replicasvalue.
5.7.9.5. Configuring Ingress access logging
You can configure the Ingress Controller to enable access logs. If you have clusters that do not receive much traffic, then you can log to a sidecar. If you have high traffic clusters, to avoid exceeding the capacity of the logging stack or to integrate with a logging infrastructure outside of OpenShift Container Platform, you can forward logs to a custom syslog endpoint. You can also specify the format for access logs.
Container logging is useful to enable access logs on low-traffic clusters when there is no existing Syslog logging infrastructure, or for short-term use while diagnosing problems with the Ingress Controller.
Syslog is needed for high-traffic clusters where access logs could exceed the OpenShift Logging stack’s capacity, or for environments where any logging solution needs to integrate with an existing Syslog logging infrastructure. The Syslog use-cases can overlap.
Prerequisites
-
Log in as a user with
cluster-adminprivileges.
Procedure
For Ingress access logging to a sidecar, complete the following commands:
To enable Ingress access logging to a sidecar, enter the following command:
$ oc patch ingresscontroller default -n openshift-ingress-operator --type=merge \ -p '{"spec":{"logging":{"access":{"destination":{"type":"Container"}}}}}'After you configure the Ingress Controller to log to a sidecar, the Operator creates a container named
logsinside a router pod that exists in theopenshift-ingressnamespace.If you need to disable Ingress access logging, enter the following command that does not specify any values for
spec.logging:$ oc patch ingresscontroller default -n openshift-ingress-operator --type=json \ -p='[{"op": "remove", "path": "/spec/logging"}]'To stream the access logs and system events from the OpenShift Container Platform Ingress Controller, enter the following command:
$ oc -n openshift-ingress logs deployment.apps/router-default -c logsExample output
2020-05-11T19:11:50.135710+00:00 router-default-57dfc6cd95-bpmk6 router-default-57dfc6cd95-bpmk6 haproxy[108]: 174.19.21.82:39654 [11/May/2020:19:11:50.133] public be_http:hello-openshift:hello-openshift/pod:hello-openshift:hello-openshift:10.128.2.12:8080 0/0/1/0/1 200 142 - - --NI 1/1/0/0/0 0/0 "GET / HTTP/1.1"
To enable logging to an external Syslog server, enter the following command. Use this option if you need to forward logs to a centralized logging solution such as Splunk, Rsyslog, or Logstash.
$ oc patch ingresscontroller default -n openshift-ingress-operator --type=merge \ -p '{"spec":{"logging":{"access":{"destination":{"type":"Syslog","syslog":{"address":"1.2.3.4","port":514,"maxLenght":1024}}}}}}'-
Replace
1.2.3.4with the destination IP address of your logging server. Syslog does not support a DNS hostname value. -
Replace
514with the UDP destination port of your logging server. -
Replace
1024with the maximum length of a log message in bytes that you want to set for log messages.
-
Replace
To customize the log format, append an HAProxy-compatible log string to the following command. The string determines what information gets captured in the log format, such as a client IP address.
$ oc patch ingresscontroller default -n openshift-ingress-operator --type=merge \ -p '{"spec":{"logging":{"access":{"httpLogFormat":"%ci:%cp [%t] %ft %b/%s %B %bq %HM %HU %HV"}}}}'NoteFor a list of HAProxy log variable descriptions, see Custom log format in the upstream HAProxy documentation.
To capture custom HTTP headers or response headers in your logs, enter the following command. Consider this option if you need to track an
X-Forwarded-Forheader or custom application IDs in the Ingress and application logs.$ oc patch ingresscontroller default -n openshift-ingress-operator --type=merge -p '{"spec":{"logging":{"access":{"httpCaptureHeaders":{"request":[{"name":"User-Agent","maxLength": 1024}],"response":[{"name":"Content-Type","maxLength": 1024}]}}}}}'To configure a log empty requests policy, enter the following command and set the
logEmptyRequestsparameter toLog. By default, HAProxy might not log empty requests or health checks, so you must manually enable this feature. To disable the feature, set thelogEmptyRequestsparameter toIgnore.$ oc patch ingresscontroller default -n openshift-ingress-operator --type=merge -p '{"spec":{"logging":{"access":{"logEmptyRequests":"Ignore"}}}}'
5.7.9.6. Setting Ingress Controller thread count
A cluster administrator can set the thread count to increase the amount of incoming connections a cluster can handle. You can patch an existing Ingress Controller to increase the amount of threads.
Prerequisites
- The following assumes that you already created an Ingress Controller.
Procedure
Update the Ingress Controller to increase the number of threads:
$ oc -n openshift-ingress-operator patch ingresscontroller/default --type=merge -p '{"spec":{"tuningOptions": {"threadCount": 8}}}'NoteIf you have a node that is capable of running large amounts of resources, you can configure
spec.nodePlacement.nodeSelectorwith labels that match the capacity of the intended node, and configurespec.tuningOptions.threadCountto an appropriately high value.
5.7.9.7. Configuring an Ingress Controller to use an internal load balancer
When creating an Ingress Controller on cloud platforms, the Ingress Controller is published by a public cloud load balancer by default. As an administrator, you can create an Ingress Controller that uses an internal cloud load balancer.
If your cloud provider is Microsoft Azure, you must have at least one public load balancer that points to your nodes. If you do not, all of your nodes will lose egress connectivity to the internet.
If you want to change the scope for an IngressController, you can change the .spec.endpointPublishingStrategy.loadBalancer.scope parameter after the custom resource (CR) is created.
Figure 5.2. Diagram of LoadBalancer
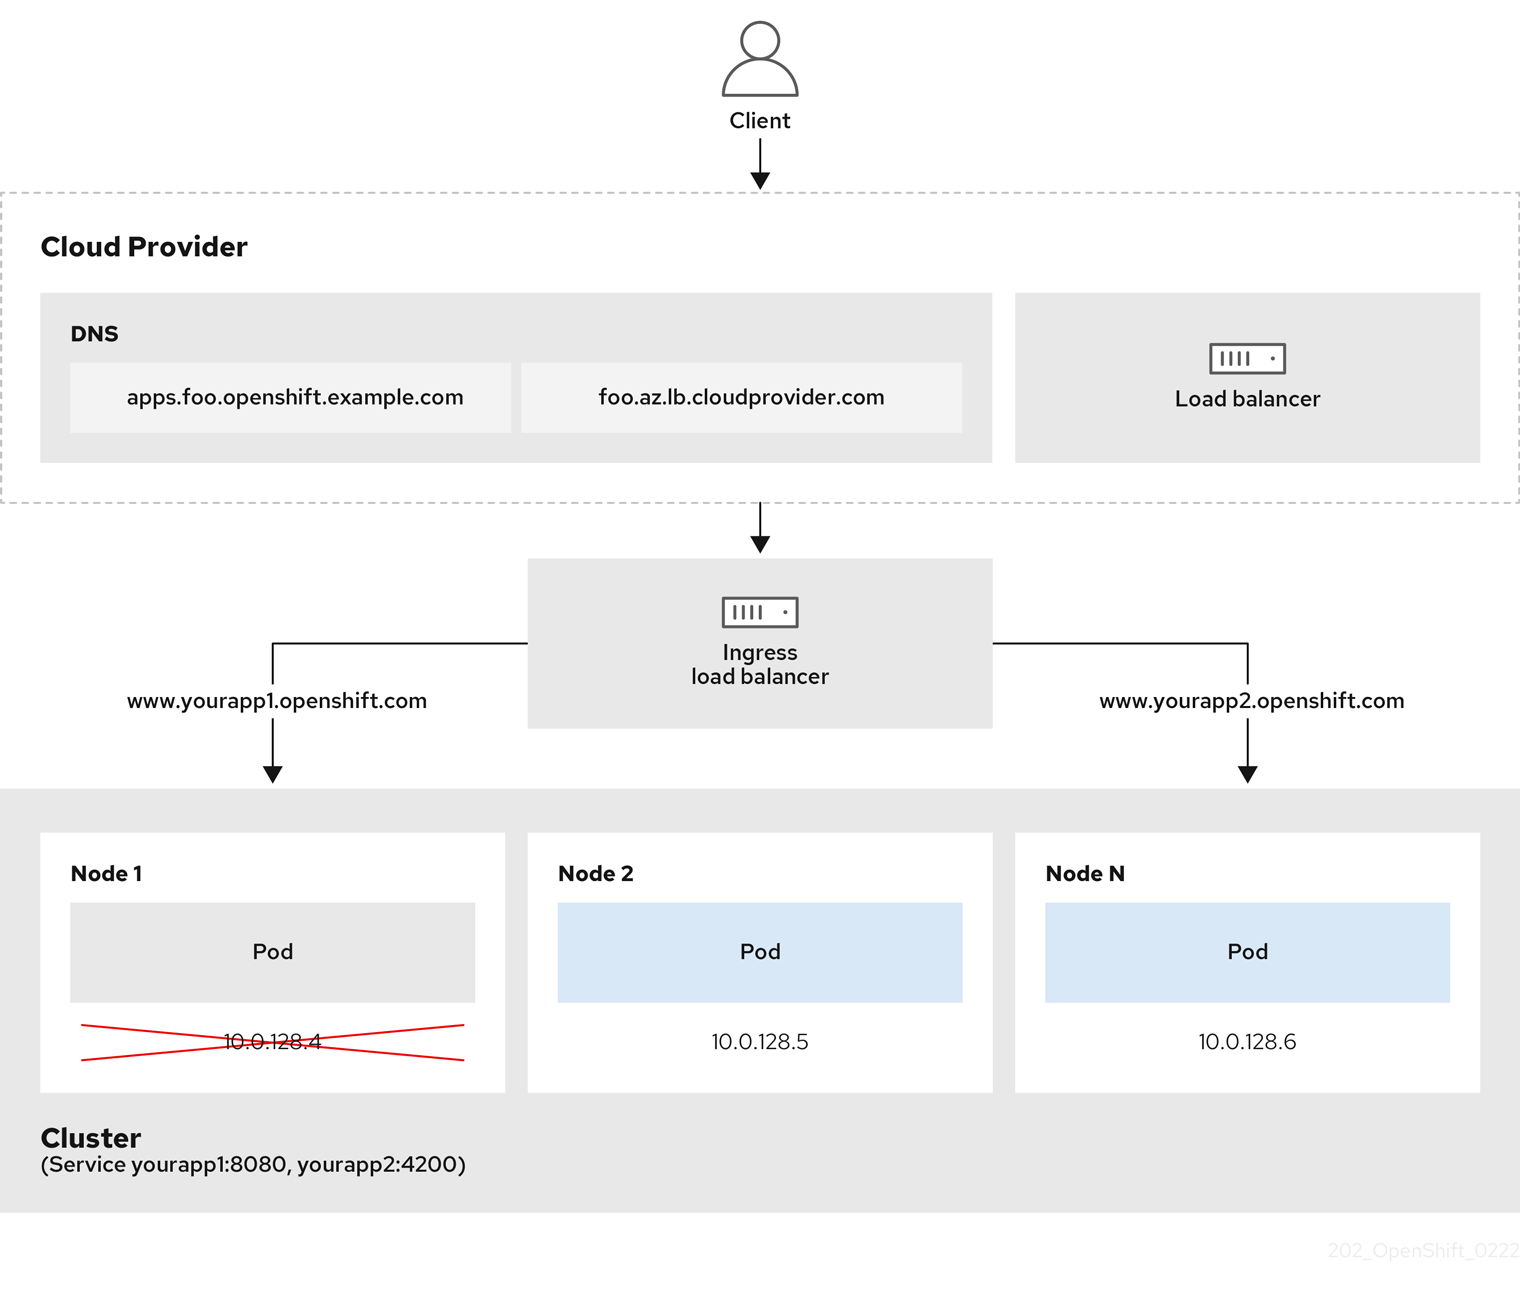
The preceding graphic shows the following concepts pertaining to OpenShift Container Platform Ingress LoadBalancerService endpoint publishing strategy:
- You can load balance externally, using the cloud provider load balancer, or internally, using the OpenShift Ingress Controller Load Balancer.
- You can use the single IP address of the load balancer and more familiar ports, such as 8080 and 4200 as shown on the cluster depicted in the graphic.
- Traffic from the external load balancer is directed at the pods, and managed by the load balancer, as depicted in the instance of a down node. See the Kubernetes Services documentation for implementation details.
Prerequisites
-
Install the OpenShift CLI (
oc). -
Log in as a user with
cluster-adminprivileges.
Procedure
Create an
IngressControllercustom resource (CR) in a file named<name>-ingress-controller.yaml, such as in the following example:apiVersion: operator.openshift.io/v1 kind: IngressController metadata: namespace: openshift-ingress-operator name: <name>1 spec: domain: <domain>2 endpointPublishingStrategy: type: LoadBalancerService loadBalancer: scope: Internal3 Create the Ingress Controller defined in the previous step by running the following command:
$ oc create -f <name>-ingress-controller.yaml1 - 1
- Replace
<name>with the name of theIngressControllerobject.
Optional: Confirm that the Ingress Controller was created by running the following command:
$ oc --all-namespaces=true get ingresscontrollers
5.7.9.8. Configuring global access for an Ingress Controller on Google Cloud
An Ingress Controller created on Google Cloud with an internal load balancer generates an internal IP address for the service. A cluster administrator can specify the global access option, which enables clients in any region within the same VPC network and compute region as the load balancer, to reach the workloads running on your cluster.
For more information, see the Google Cloud documentation for global access.
Prerequisites
- You deployed an OpenShift Container Platform cluster on Google Cloud infrastructure.
- You configured an Ingress Controller to use an internal load balancer.
-
You installed the OpenShift CLI (
oc).
Procedure
Configure the Ingress Controller resource to allow global access.
NoteYou can also create an Ingress Controller and specify the global access option.
Configure the Ingress Controller resource:
$ oc -n openshift-ingress-operator edit ingresscontroller/defaultEdit the YAML file:
Sample
clientAccessconfiguration toGlobalspec: endpointPublishingStrategy: loadBalancer: providerParameters: gcp: clientAccess: Global1 type: GCP scope: Internal type: LoadBalancerService- 1
- Set
gcp.clientAccesstoGlobal.
- Save the file to apply the changes.
Run the following command to verify that the service allows global access:
$ oc -n openshift-ingress edit svc/router-default -o yamlThe output shows that global access is enabled for Google Cloud with the annotation,
networking.gke.io/internal-load-balancer-allow-global-access.
5.7.9.9. Setting the Ingress Controller health check interval
A cluster administrator can set the health check interval to define how long the router waits between two consecutive health checks. This value is applied globally as a default for all routes. The default value is 5 seconds.
Prerequisites
- The following assumes that you already created an Ingress Controller.
Procedure
Update the Ingress Controller to change the interval between back end health checks:
$ oc -n openshift-ingress-operator patch ingresscontroller/default --type=merge -p '{"spec":{"tuningOptions": {"healthCheckInterval": "8s"}}}'NoteTo override the
healthCheckIntervalfor a single route, use the route annotationrouter.openshift.io/haproxy.health.check.interval
5.7.9.10. Configuring the default Ingress Controller for your cluster to be internal
You can configure the default Ingress Controller for your cluster to be internal by deleting and recreating it.
If your cloud provider is Microsoft Azure, you must have at least one public load balancer that points to your nodes. If you do not, all of your nodes will lose egress connectivity to the internet.
If you want to change the scope for an IngressController, you can change the .spec.endpointPublishingStrategy.loadBalancer.scope parameter after the custom resource (CR) is created.
Prerequisites
-
Install the OpenShift CLI (
oc). -
Log in as a user with
cluster-adminprivileges.
Procedure
Configure the
defaultIngress Controller for your cluster to be internal by deleting and recreating it.$ oc replace --force --wait --filename - <<EOF apiVersion: operator.openshift.io/v1 kind: IngressController metadata: namespace: openshift-ingress-operator name: default spec: endpointPublishingStrategy: type: LoadBalancerService loadBalancer: scope: Internal EOF
5.7.9.11. Configuring the route admission policy
Administrators and application developers can run applications in multiple namespaces with the same domain name. This is for organizations where multiple teams develop microservices that are exposed on the same hostname.
Allowing claims across namespaces should only be enabled for clusters with trust between namespaces, otherwise a malicious user could take over a hostname. For this reason, the default admission policy disallows hostname claims across namespaces.
Prerequisites
- Cluster administrator privileges.
Procedure
Edit the
.spec.routeAdmissionfield of theingresscontrollerresource variable using the following command:$ oc -n openshift-ingress-operator patch ingresscontroller/default --patch '{"spec":{"routeAdmission":{"namespaceOwnership":"InterNamespaceAllowed"}}}' --type=mergeSample Ingress Controller configuration
spec: routeAdmission: namespaceOwnership: InterNamespaceAllowed ...TipYou can alternatively apply the following YAML to configure the route admission policy:
apiVersion: operator.openshift.io/v1 kind: IngressController metadata: name: default namespace: openshift-ingress-operator spec: routeAdmission: namespaceOwnership: InterNamespaceAllowed
5.7.9.12. Using wildcard routes
The HAProxy Ingress Controller has support for wildcard routes. The Ingress Operator uses wildcardPolicy to configure the ROUTER_ALLOW_WILDCARD_ROUTES environment variable of the Ingress Controller.
The default behavior of the Ingress Controller is to admit routes with a wildcard policy of None, which is backwards compatible with existing IngressController resources.
Procedure
Configure the wildcard policy.
Use the following command to edit the
IngressControllerresource:$ oc edit IngressControllerUnder
spec, set thewildcardPolicyfield toWildcardsDisallowedorWildcardsAllowed:spec: routeAdmission: wildcardPolicy: WildcardsDisallowed # or WildcardsAllowed
5.7.9.13. HTTP header configuration
OpenShift Container Platform provides different methods for working with HTTP headers. When setting or deleting headers, you can use specific fields in the Ingress Controller or an individual route to modify request and response headers. You can also set certain headers by using route annotations. The various ways of configuring headers can present challenges when working together.
You can only set or delete headers within an IngressController or Route CR, you cannot append them. If an HTTP header is set with a value, that value must be complete and not require appending in the future. In situations where it makes sense to append a header, such as the X-Forwarded-For header, use the spec.httpHeaders.forwardedHeaderPolicy field, instead of spec.httpHeaders.actions.
5.7.9.13.1. Order of precedence
When the same HTTP header is modified both in the Ingress Controller and in a route, HAProxy prioritizes the actions in certain ways depending on whether it is a request or response header.
- For HTTP response headers, actions specified in the Ingress Controller are executed after the actions specified in a route. This means that the actions specified in the Ingress Controller take precedence.
- For HTTP request headers, actions specified in a route are executed after the actions specified in the Ingress Controller. This means that the actions specified in the route take precedence.
For example, a cluster administrator sets the X-Frame-Options response header with the value DENY in the Ingress Controller using the following configuration:
Example IngressController spec
apiVersion: operator.openshift.io/v1
kind: IngressController
# ...
spec:
httpHeaders:
actions:
response:
- name: X-Frame-Options
action:
type: Set
set:
value: DENY
A route owner sets the same response header that the cluster administrator set in the Ingress Controller, but with the value SAMEORIGIN using the following configuration:
Example Route spec
apiVersion: route.openshift.io/v1
kind: Route
# ...
spec:
httpHeaders:
actions:
response:
- name: X-Frame-Options
action:
type: Set
set:
value: SAMEORIGIN
When both the IngressController spec and Route spec are configuring the X-Frame-Options response header, then the value set for this header at the global level in the Ingress Controller takes precedence, even if a specific route allows frames. For a request header, the Route spec value overrides the IngressController spec value.
This prioritization occurs because the haproxy.config file uses the following logic, where the Ingress Controller is considered the front end and individual routes are considered the back end. The header value DENY applied to the front end configurations overrides the same header with the value SAMEORIGIN that is set in the back end:
frontend public
http-response set-header X-Frame-Options 'DENY'
frontend fe_sni
http-response set-header X-Frame-Options 'DENY'
frontend fe_no_sni
http-response set-header X-Frame-Options 'DENY'
backend be_secure:openshift-monitoring:alertmanager-main
http-response set-header X-Frame-Options 'SAMEORIGIN'Additionally, any actions defined in either the Ingress Controller or a route override values set using route annotations.
5.7.9.13.2. Special case headers
The following headers are either prevented entirely from being set or deleted, or allowed under specific circumstances:
| Header name | Configurable using IngressController spec | Configurable using Route spec | Reason for disallowment | Configurable using another method |
|---|---|---|---|---|
|
| No | No |
The | No |
|
| No | Yes |
When the | No |
|
| No | No |
The |
Yes: the |
|
| No | No | The cookies that HAProxy sets are used for session tracking to map client connections to particular back-end servers. Allowing these headers to be set could interfere with HAProxy’s session affinity and restrict HAProxy’s ownership of a cookie. | Yes:
|
5.7.9.14. Setting or deleting HTTP request and response headers in an Ingress Controller
You can set or delete certain HTTP request and response headers for compliance purposes or other reasons. You can set or delete these headers either for all routes served by an Ingress Controller or for specific routes.
For example, you might want to migrate an application running on your cluster to use mutual TLS, which requires that your application checks for an X-Forwarded-Client-Cert request header, but the OpenShift Container Platform default Ingress Controller provides an X-SSL-Client-Der request header.
The following procedure modifies the Ingress Controller to set the X-Forwarded-Client-Cert request header, and delete the X-SSL-Client-Der request header.
Prerequisites
-
You have installed the OpenShift CLI (
oc). -
You have access to an OpenShift Container Platform cluster as a user with the
cluster-adminrole.
Procedure
Edit the Ingress Controller resource:
$ oc -n openshift-ingress-operator edit ingresscontroller/defaultReplace the X-SSL-Client-Der HTTP request header with the X-Forwarded-Client-Cert HTTP request header:
apiVersion: operator.openshift.io/v1 kind: IngressController metadata: name: default namespace: openshift-ingress-operator spec: httpHeaders: actions:1 request:2 - name: X-Forwarded-Client-Cert3 action: type: Set4 set: value: "%{+Q}[ssl_c_der,base64]"5 - name: X-SSL-Client-Der action: type: Delete- 1
- The list of actions you want to perform on the HTTP headers.
- 2
- The type of header you want to change. In this case, a request header.
- 3
- The name of the header you want to change. For a list of available headers you can set or delete, see HTTP header configuration.
- 4
- The type of action being taken on the header. This field can have the value
SetorDelete. - 5
- When setting HTTP headers, you must provide a
value. The value can be a string from a list of available directives for that header, for exampleDENY, or it can be a dynamic value that will be interpreted using HAProxy’s dynamic value syntax. In this case, a dynamic value is added.
NoteFor setting dynamic header values for HTTP responses, allowed sample fetchers are
res.hdrandssl_c_der. For setting dynamic header values for HTTP requests, allowed sample fetchers arereq.hdrandssl_c_der. Both request and response dynamic values can use thelowerandbase64converters.- Save the file to apply the changes.
5.7.9.15. Using X-Forwarded headers
You configure the HAProxy Ingress Controller to specify a policy for how to handle HTTP headers including Forwarded and X-Forwarded-For. The Ingress Operator uses the HTTPHeaders field to configure the ROUTER_SET_FORWARDED_HEADERS environment variable of the Ingress Controller.
Procedure
Configure the
HTTPHeadersfield for the Ingress Controller.Use the following command to edit the
IngressControllerresource:$ oc edit IngressControllerUnder
spec, set theHTTPHeaderspolicy field toAppend,Replace,IfNone, orNever:apiVersion: operator.openshift.io/v1 kind: IngressController metadata: name: default namespace: openshift-ingress-operator spec: httpHeaders: forwardedHeaderPolicy: Append
5.7.9.15.1. Example use cases
As a cluster administrator, you can:
Configure an external proxy that injects the
X-Forwarded-Forheader into each request before forwarding it to an Ingress Controller.To configure the Ingress Controller to pass the header through unmodified, you specify the
neverpolicy. The Ingress Controller then never sets the headers, and applications receive only the headers that the external proxy provides.Configure the Ingress Controller to pass the
X-Forwarded-Forheader that your external proxy sets on external cluster requests through unmodified.To configure the Ingress Controller to set the
X-Forwarded-Forheader on internal cluster requests, which do not go through the external proxy, specify theif-nonepolicy. If an HTTP request already has the header set through the external proxy, then the Ingress Controller preserves it. If the header is absent because the request did not come through the proxy, then the Ingress Controller adds the header.
As an application developer, you can:
Configure an application-specific external proxy that injects the
X-Forwarded-Forheader.To configure an Ingress Controller to pass the header through unmodified for an application’s Route, without affecting the policy for other Routes, add an annotation
haproxy.router.openshift.io/set-forwarded-headers: if-noneorhaproxy.router.openshift.io/set-forwarded-headers: neveron the Route for the application.NoteYou can set the
haproxy.router.openshift.io/set-forwarded-headersannotation on a per route basis, independent from the globally set value for the Ingress Controller.
5.7.9.16. Enabling and disabling HTTP/2 on Ingress Controllers
You can enable or disable transparent end-to-end HTTP/2 connectivity in HAProxy. This allows application owners to make use of HTTP/2 protocol capabilities, including single connection, header compression, binary streams, and more.
You can enable or disable HTTP/2 connectivity for an individual Ingress Controller or for the entire cluster.
To enable the use of HTTP/2 for the connection from the client to HAProxy, a route must specify a custom certificate. A route that uses the default certificate cannot use HTTP/2. This restriction is necessary to avoid problems from connection coalescing, where the client re-uses a connection for different routes that use the same certificate.
The connection from HAProxy to the application pod can use HTTP/2 only for re-encrypt routes and not for edge-terminated or insecure routes. This restriction is because HAProxy uses Application-Level Protocol Negotiation (ALPN), which is a TLS extension, to negotiate the use of HTTP/2 with the back-end. The implication is that end-to-end HTTP/2 is possible with passthrough and re-encrypt and not with edge-terminated routes.
You can use HTTP/2 with an insecure route whether the Ingress Controller has HTTP/2 enabled or disabled.
For non-passthrough routes, the Ingress Controller negotiates its connection to the application independently of the connection from the client. This means a client may connect to the Ingress Controller and negotiate HTTP/1.1, and the Ingress Controller might then connect to the application, negotiate HTTP/2, and forward the request from the client HTTP/1.1 connection using the HTTP/2 connection to the application. This poses a problem if the client subsequently tries to upgrade its connection from HTTP/1.1 to the WebSocket protocol, because the Ingress Controller cannot forward WebSocket to HTTP/2 and cannot upgrade its HTTP/2 connection to WebSocket. Consequently, if you have an application that is intended to accept WebSocket connections, it must not allow negotiating the HTTP/2 protocol or else clients will fail to upgrade to the WebSocket protocol.
5.7.9.16.1. Enabling HTTP/2
You can enable HTTP/2 on a specific Ingress Controller, or you can enable HTTP/2 for the entire cluster.
Procedure
To enable HTTP/2 on a specific Ingress Controller, enter the
oc annotatecommand:$ oc -n openshift-ingress-operator annotate ingresscontrollers/<ingresscontroller_name> ingress.operator.openshift.io/default-enable-http2=true1 - 1
- Replace
<ingresscontroller_name>with the name of an Ingress Controller to enable HTTP/2.
To enable HTTP/2 for the entire cluster, enter the
oc annotatecommand:$ oc annotate ingresses.config/cluster ingress.operator.openshift.io/default-enable-http2=true
Alternatively, you can apply the following YAML code to enable HTTP/2:
apiVersion: config.openshift.io/v1
kind: Ingress
metadata:
name: cluster
annotations:
ingress.operator.openshift.io/default-enable-http2: "true"5.7.9.16.2. Disabling HTTP/2
You can disable HTTP/2 on a specific Ingress Controller, or you can disable HTTP/2 for the entire cluster.
Procedure
To disable HTTP/2 on a specific Ingress Controller, enter the
oc annotatecommand:$ oc -n openshift-ingress-operator annotate ingresscontrollers/<ingresscontroller_name> ingress.operator.openshift.io/default-enable-http2=false1 - 1
- Replace
<ingresscontroller_name>with the name of an Ingress Controller to disable HTTP/2.
To disable HTTP/2 for the entire cluster, enter the
oc annotatecommand:$ oc annotate ingresses.config/cluster ingress.operator.openshift.io/default-enable-http2=false
Alternatively, you can apply the following YAML code to disable HTTP/2:
apiVersion: config.openshift.io/v1
kind: Ingress
metadata:
name: cluster
annotations:
ingress.operator.openshift.io/default-enable-http2: "false"5.7.9.17. Configuring the PROXY protocol for an Ingress Controller
A cluster administrator can configure the PROXY protocol when an Ingress Controller uses either the HostNetwork, NodePortService, or Private endpoint publishing strategy types. The PROXY protocol enables the load balancer to preserve the original client addresses for connections that the Ingress Controller receives. The original client addresses are useful for logging, filtering, and injecting HTTP headers. In the default configuration, the connections that the Ingress Controller receives only contain the source address that is associated with the load balancer.
The default Ingress Controller with installer-provisioned clusters on non-cloud platforms that use a Keepalived Ingress Virtual IP (VIP) do not support the PROXY protocol.
The PROXY protocol enables the load balancer to preserve the original client addresses for connections that the Ingress Controller receives. The original client addresses are useful for logging, filtering, and injecting HTTP headers. In the default configuration, the connections that the Ingress Controller receives contain only the source IP address that is associated with the load balancer.
For a passthrough route configuration, servers in OpenShift Container Platform clusters cannot observe the original client source IP address. If you need to know the original client source IP address, configure Ingress access logging for your Ingress Controller so that you can view the client source IP addresses.
For re-encrypt and edge routes, the OpenShift Container Platform router sets the Forwarded and X-Forwarded-For headers so that application workloads check the client source IP address.
For more information about Ingress access logging, see "Configuring Ingress access logging".
Configuring the PROXY protocol for an Ingress Controller is not supported when using the LoadBalancerService endpoint publishing strategy type. This restriction is because when OpenShift Container Platform runs in a cloud platform, and an Ingress Controller specifies that a service load balancer should be used, the Ingress Operator configures the load balancer service and enables the PROXY protocol based on the platform requirement for preserving source addresses.
You must configure both OpenShift Container Platform and the external load balancer to use either the PROXY protocol or TCP.
This feature is not supported in cloud deployments. This restriction is because when OpenShift Container Platform runs in a cloud platform, and an Ingress Controller specifies that a service load balancer should be used, the Ingress Operator configures the load balancer service and enables the PROXY protocol based on the platform requirement for preserving source addresses.
You must configure both OpenShift Container Platform and the external load balancer to either use the PROXY protocol or to use Transmission Control Protocol (TCP).
Prerequisites
- You created an Ingress Controller.
Procedure
Edit the Ingress Controller resource by entering the following command in your CLI:
$ oc -n openshift-ingress-operator edit ingresscontroller/defaultSet the PROXY configuration:
If your Ingress Controller uses the
HostNetworkendpoint publishing strategy type, set thespec.endpointPublishingStrategy.hostNetwork.protocolsubfield toPROXY:Sample
hostNetworkconfiguration toPROXY# ... spec: endpointPublishingStrategy: hostNetwork: protocol: PROXY type: HostNetwork # ...If your Ingress Controller uses the
NodePortServiceendpoint publishing strategy type, set thespec.endpointPublishingStrategy.nodePort.protocolsubfield toPROXY:Sample
nodePortconfiguration toPROXY# ... spec: endpointPublishingStrategy: nodePort: protocol: PROXY type: NodePortService # ...If your Ingress Controller uses the
Privateendpoint publishing strategy type, set thespec.endpointPublishingStrategy.private.protocolsubfield toPROXY:Sample
privateconfiguration toPROXY# ... spec: endpointPublishingStrategy: private: protocol: PROXY type: Private # ...
5.7.9.18. Specifying an alternative cluster domain using the appsDomain option
As a cluster administrator, you can specify an alternative to the default cluster domain for user-created routes by configuring the appsDomain field. The appsDomain field is an optional domain for OpenShift Container Platform to use instead of the default, which is specified in the domain field. If you specify an alternative domain, it overrides the default cluster domain for the purpose of determining the default host for a new route.
For example, you can use the DNS domain for your company as the default domain for routes and ingresses for applications running on your cluster.
Prerequisites
- You deployed an OpenShift Container Platform cluster.
-
You installed the
occommand-line interface.
Procedure
Configure the
appsDomainfield by specifying an alternative default domain for user-created routes.Edit the ingress
clusterresource:$ oc edit ingresses.config/cluster -o yamlEdit the YAML file:
Sample
appsDomainconfiguration totest.example.comapiVersion: config.openshift.io/v1 kind: Ingress metadata: name: cluster spec: domain: apps.example.com1 appsDomain: <test.example.com>2
Verify that an existing route contains the domain name specified in the
appsDomainfield by exposing the route and verifying the route domain change:NoteWait for the
openshift-apiserverfinish rolling updates before exposing the route.Expose the route by entering the following command. The command outputs
route.route.openshift.io/hello-openshift exposedto designate exposure of the route.$ oc expose service hello-openshiftGet a list of routes by running the following command:
$ oc get routesExample output
NAME HOST/PORT PATH SERVICES PORT TERMINATION WILDCARD hello-openshift hello_openshift-<my_project>.test.example.com hello-openshift 8080-tcp None
5.7.9.19. Converting HTTP header case
HAProxy lowercases HTTP header names by default; for example, changing Host: xyz.com to host: xyz.com. If legacy applications are sensitive to the capitalization of HTTP header names, use the Ingress Controller spec.httpHeaders.headerNameCaseAdjustments API field for a solution to accommodate legacy applications until they can be fixed.
OpenShift Container Platform includes HAProxy 2.8. If you want to update to this version of the web-based load balancer, ensure that you add the spec.httpHeaders.headerNameCaseAdjustments section to your cluster’s configuration file.
As a cluster administrator, you can convert the HTTP header case by entering the oc patch command or by setting the HeaderNameCaseAdjustments field in the Ingress Controller YAML file.
Prerequisites
-
You have installed the OpenShift CLI (
oc). -
You have access to the cluster as a user with the
cluster-adminrole.
Procedure
Capitalize an HTTP header by using the
oc patchcommand.Change the HTTP header from
hosttoHostby running the following command:$ oc -n openshift-ingress-operator patch ingresscontrollers/default --type=merge --patch='{"spec":{"httpHeaders":{"headerNameCaseAdjustments":["Host"]}}}'Create a
Routeresource YAML file so that the annotation can be applied to the application.Example of a route named
my-applicationapiVersion: route.openshift.io/v1 kind: Route metadata: annotations: haproxy.router.openshift.io/h1-adjust-case: true1 name: <application_name> namespace: <application_name> # ...- 1
- Set
haproxy.router.openshift.io/h1-adjust-caseso that the Ingress Controller can adjust thehostrequest header as specified.
Specify adjustments by configuring the
HeaderNameCaseAdjustmentsfield in the Ingress Controller YAML configuration file.The following example Ingress Controller YAML file adjusts the
hostheader toHostfor HTTP/1 requests to appropriately annotated routes:Example Ingress Controller YAML
apiVersion: operator.openshift.io/v1 kind: IngressController metadata: name: default namespace: openshift-ingress-operator spec: httpHeaders: headerNameCaseAdjustments: - HostThe following example route enables HTTP response header name case adjustments by using the
haproxy.router.openshift.io/h1-adjust-caseannotation:Example route YAML
apiVersion: route.openshift.io/v1 kind: Route metadata: annotations: haproxy.router.openshift.io/h1-adjust-case: true1 name: my-application namespace: my-application spec: to: kind: Service name: my-application- 1
- Set
haproxy.router.openshift.io/h1-adjust-caseto true.
5.7.9.20. Using router compression
You configure the HAProxy Ingress Controller to specify router compression globally for specific MIME types. You can use the mimeTypes variable to define the formats of MIME types to which compression is applied. The types are: application, image, message, multipart, text, video, or a custom type prefaced by "X-". To see the full notation for MIME types and subtypes, see RFC1341.
Memory allocated for compression can affect the max connections. Additionally, compression of large buffers can cause latency, like heavy regex or long lists of regex.
Not all MIME types benefit from compression, but HAProxy still uses resources to try to compress if instructed to. Generally, text formats, such as html, css, and js, formats benefit from compression, but formats that are already compressed, such as image, audio, and video, benefit little in exchange for the time and resources spent on compression.
Procedure
Configure the
httpCompressionfield for the Ingress Controller.Use the following command to edit the
IngressControllerresource:$ oc edit -n openshift-ingress-operator ingresscontrollers/defaultUnder
spec, set thehttpCompressionpolicy field tomimeTypesand specify a list of MIME types that should have compression applied:apiVersion: operator.openshift.io/v1 kind: IngressController metadata: name: default namespace: openshift-ingress-operator spec: httpCompression: mimeTypes: - "text/html" - "text/css; charset=utf-8" - "application/json" ...
5.7.9.21. Exposing router metrics
You can expose the HAProxy router metrics by default in Prometheus format on the default stats port, 1936. The external metrics collection and aggregation systems such as Prometheus can access the HAProxy router metrics. You can view the HAProxy router metrics in a browser in the HTML and comma separated values (CSV) format.
Prerequisites
- You configured your firewall to access the default stats port, 1936.
Procedure
Get the router pod name by running the following command:
$ oc get pods -n openshift-ingressExample output
NAME READY STATUS RESTARTS AGE router-default-76bfffb66c-46qwp 1/1 Running 0 11hGet the router’s username and password, which the router pod stores in the
/var/lib/haproxy/conf/metrics-auth/statsUsernameand/var/lib/haproxy/conf/metrics-auth/statsPasswordfiles:Get the username by running the following command:
$ oc rsh <router_pod_name> cat metrics-auth/statsUsernameGet the password by running the following command:
$ oc rsh <router_pod_name> cat metrics-auth/statsPassword
Get the router IP and metrics certificates by running the following command:
$ oc describe pod <router_pod>Get the raw statistics in Prometheus format by running the following command:
$ curl -u <user>:<password> http://<router_IP>:<stats_port>/metricsAccess the metrics securely by running the following command:
$ curl -u user:password https://<router_IP>:<stats_port>/metrics -kAccess the default stats port, 1936, by running the following command:
$ curl -u <user>:<password> http://<router_IP>:<stats_port>/metricsExample 5.1. Example output
... # HELP haproxy_backend_connections_total Total number of connections. # TYPE haproxy_backend_connections_total gauge haproxy_backend_connections_total{backend="http",namespace="default",route="hello-route"} 0 haproxy_backend_connections_total{backend="http",namespace="default",route="hello-route-alt"} 0 haproxy_backend_connections_total{backend="http",namespace="default",route="hello-route01"} 0 ... # HELP haproxy_exporter_server_threshold Number of servers tracked and the current threshold value. # TYPE haproxy_exporter_server_threshold gauge haproxy_exporter_server_threshold{type="current"} 11 haproxy_exporter_server_threshold{type="limit"} 500 ... # HELP haproxy_frontend_bytes_in_total Current total of incoming bytes. # TYPE haproxy_frontend_bytes_in_total gauge haproxy_frontend_bytes_in_total{frontend="fe_no_sni"} 0 haproxy_frontend_bytes_in_total{frontend="fe_sni"} 0 haproxy_frontend_bytes_in_total{frontend="public"} 119070 ... # HELP haproxy_server_bytes_in_total Current total of incoming bytes. # TYPE haproxy_server_bytes_in_total gauge haproxy_server_bytes_in_total{namespace="",pod="",route="",server="fe_no_sni",service=""} 0 haproxy_server_bytes_in_total{namespace="",pod="",route="",server="fe_sni",service=""} 0 haproxy_server_bytes_in_total{namespace="default",pod="docker-registry-5-nk5fz",route="docker-registry",server="10.130.0.89:5000",service="docker-registry"} 0 haproxy_server_bytes_in_total{namespace="default",pod="hello-rc-vkjqx",route="hello-route",server="10.130.0.90:8080",service="hello-svc-1"} 0 ...Launch the stats window by entering the following URL in a browser:
http://<user>:<password>@<router_IP>:<stats_port>Optional: Get the stats in CSV format by entering the following URL in a browser:
http://<user>:<password>@<router_ip>:1936/metrics;csv
5.7.9.22. Customizing HAProxy error code response pages
As a cluster administrator, you can specify a custom error code response page for either 503, 404, or both error pages. The HAProxy router serves a 503 error page when the application pod is not running or a 404 error page when the requested URL does not exist. For example, if you customize the 503 error code response page, then the page is served when the application pod is not running, and the default 404 error code HTTP response page is served by the HAProxy router for an incorrect route or a non-existing route.
Custom error code response pages are specified in a config map then patched to the Ingress Controller. The config map keys have two available file names as follows: error-page-503.http and error-page-404.http.
Custom HTTP error code response pages must follow the HAProxy HTTP error page configuration guidelines. Here is an example of the default OpenShift Container Platform HAProxy router http 503 error code response page. You can use the default content as a template for creating your own custom page.
By default, the HAProxy router serves only a 503 error page when the application is not running or when the route is incorrect or non-existent. This default behavior is the same as the behavior on OpenShift Container Platform 4.8 and earlier. If a config map for the customization of an HTTP error code response is not provided, and you are using a custom HTTP error code response page, the router serves a default 404 or 503 error code response page.
If you use the OpenShift Container Platform default 503 error code page as a template for your customizations, the headers in the file require an editor that can use CRLF line endings.
Procedure
Create a config map named
my-custom-error-code-pagesin theopenshift-confignamespace:$ oc -n openshift-config create configmap my-custom-error-code-pages \ --from-file=error-page-503.http \ --from-file=error-page-404.httpImportantIf you do not specify the correct format for the custom error code response page, a router pod outage occurs. To resolve this outage, you must delete or correct the config map and delete the affected router pods so they can be recreated with the correct information.
Patch the Ingress Controller to reference the
my-custom-error-code-pagesconfig map by name:$ oc patch -n openshift-ingress-operator ingresscontroller/default --patch '{"spec":{"httpErrorCodePages":{"name":"my-custom-error-code-pages"}}}' --type=mergeThe Ingress Operator copies the
my-custom-error-code-pagesconfig map from theopenshift-confignamespace to theopenshift-ingressnamespace. The Operator names the config map according to the pattern,<your_ingresscontroller_name>-errorpages, in theopenshift-ingressnamespace.Display the copy:
$ oc get cm default-errorpages -n openshift-ingressExample output
NAME DATA AGE default-errorpages 2 25s1 - 1
- The example config map name is
default-errorpagesbecause thedefaultIngress Controller custom resource (CR) was patched.
Confirm that the config map containing the custom error response page mounts on the router volume where the config map key is the filename that has the custom HTTP error code response:
For 503 custom HTTP custom error code response:
$ oc -n openshift-ingress rsh <router_pod> cat /var/lib/haproxy/conf/error_code_pages/error-page-503.httpFor 404 custom HTTP custom error code response:
$ oc -n openshift-ingress rsh <router_pod> cat /var/lib/haproxy/conf/error_code_pages/error-page-404.http
Verification
Verify your custom error code HTTP response:
Create a test project and application:
$ oc new-project test-ingress$ oc new-app django-psql-exampleFor 503 custom http error code response:
- Stop all the pods for the application.
Run the following curl command or visit the route hostname in the browser:
$ curl -vk <route_hostname>
For 404 custom http error code response:
- Visit a non-existent route or an incorrect route.
Run the following curl command or visit the route hostname in the browser:
$ curl -vk <route_hostname>
Check if the
errorfileattribute is properly in thehaproxy.configfile:$ oc -n openshift-ingress rsh <router> cat /var/lib/haproxy/conf/haproxy.config | grep errorfile
5.7.9.23. Setting the Ingress Controller maximum connections
A cluster administrator can set the maximum number of simultaneous connections for OpenShift router deployments. You can patch an existing Ingress Controller to increase the maximum number of connections.
Prerequisites
- The following assumes that you already created an Ingress Controller
Procedure
Update the Ingress Controller to change the maximum number of connections for HAProxy:
$ oc -n openshift-ingress-operator patch ingresscontroller/default --type=merge -p '{"spec":{"tuningOptions": {"maxConnections": 7500}}}'WarningIf you set the
spec.tuningOptions.maxConnectionsvalue greater than the current operating system limit, the HAProxy process will not start. See the table in the "Ingress Controller configuration parameters" section for more information about this parameter.
5.8. Ingress Node Firewall Operator in OpenShift Container Platform
The Ingress Node Firewall Operator provides a stateless, eBPF-based firewall for managing node-level ingress traffic in OpenShift Container Platform.
5.8.1. Ingress Node Firewall Operator
The Ingress Node Firewall Operator provides ingress firewall rules at a node level that you can specify and manage in the firewall configurations.
To deploy the daemon set created by the Operator, you create an IngressNodeFirewallConfig custom resource (CR). The Operator applies the IngressNodeFirewallConfig CR to create ingress node firewall daemon set daemon, which run on all nodes that match the nodeSelector.
You configure rules of the IngressNodeFirewall CR and apply them to clusters using the nodeSelector and setting values to "true".
The Ingress Node Firewall Operator supports only stateless firewall rules.
Network interface controllers (NICs) that do not support native XDP drivers will run at a lower performance.
For OpenShift Container Platform 4.14 or later, you must run Ingress Node Firewall Operator on RHEL 9.0 or later.
5.8.2. Installing the Ingress Node Firewall Operator
As a cluster administrator, you can install the Ingress Node Firewall Operator to enable node-level ingress firewalling by using the OpenShift Container Platform CLI.
Prerequisites
-
You have installed the OpenShift CLI (
oc). - You have an account with administrator privileges.
Procedure
To create the
openshift-ingress-node-firewallnamespace, enter the following command:$ cat << EOF| oc create -f - apiVersion: v1 kind: Namespace metadata: labels: pod-security.kubernetes.io/enforce: privileged pod-security.kubernetes.io/enforce-version: v1.24 name: openshift-ingress-node-firewall EOFTo create an
OperatorGroupCR, enter the following command:$ cat << EOF| oc create -f - apiVersion: operators.coreos.com/v1 kind: OperatorGroup metadata: name: ingress-node-firewall-operators namespace: openshift-ingress-node-firewall EOFSubscribe to the Ingress Node Firewall Operator.
To create a
SubscriptionCR for the Ingress Node Firewall Operator, enter the following command:$ cat << EOF| oc create -f - apiVersion: operators.coreos.com/v1alpha1 kind: Subscription metadata: name: ingress-node-firewall-sub namespace: openshift-ingress-node-firewall spec: name: ingress-node-firewall channel: stable source: redhat-operators sourceNamespace: openshift-marketplace EOF
To verify that the Operator is installed, enter the following command:
$ oc get ip -n openshift-ingress-node-firewallExample output
NAME CSV APPROVAL APPROVED install-5cvnz ingress-node-firewall.4.16.0-202211122336 Automatic trueTo verify the version of the Operator, enter the following command:
$ oc get csv -n openshift-ingress-node-firewallExample output
NAME DISPLAY VERSION REPLACES PHASE ingress-node-firewall.4.16.0-202211122336 Ingress Node Firewall Operator 4.16.0-202211122336 ingress-node-firewall.4.16.0-202211102047 Succeeded
5.8.3. Installing the Ingress Node Firewall Operator using the web console
As a cluster administrator, you can install the Ingress Node Firewall Operator to enable node-level ingress firewalling by using the web console.
Prerequisites
-
You have installed the OpenShift CLI (
oc). - You have an account with administrator privileges.
Procedure
Install the Ingress Node Firewall Operator:
- In the OpenShift Container Platform web console, click Operators → OperatorHub.
- Select Ingress Node Firewall Operator from the list of available Operators, and then click Install.
- On the Install Operator page, under Installed Namespace, select Operator recommended Namespace.
- Click Install.
Verify that the Ingress Node Firewall Operator is installed successfully:
- Navigate to the Operators → Installed Operators page.
Ensure that Ingress Node Firewall Operator is listed in the openshift-ingress-node-firewall project with a Status of InstallSucceeded.
NoteDuring installation an Operator might display a Failed status. If the installation later succeeds with an InstallSucceeded message, you can ignore the Failed message.
If the Operator does not have a Status of InstallSucceeded, troubleshoot using the following steps:
- Inspect the Operator Subscriptions and Install Plans tabs for any failures or errors under Status.
-
Navigate to the Workloads → Pods page and check the logs for pods in the
openshift-ingress-node-firewallproject. Check the namespace of the YAML file. If the annotation is missing, you can add the annotation
workload.openshift.io/allowed=managementto the Operator namespace with the following command:$ oc annotate ns/openshift-ingress-node-firewall workload.openshift.io/allowed=managementNoteFor single-node OpenShift clusters, the
openshift-ingress-node-firewallnamespace requires theworkload.openshift.io/allowed=managementannotation.
5.8.4. Deploying Ingress Node Firewall Operator
To deploy the Ingress Node Firewall Operator, create a IngressNodeFirewallConfig custom resource that will deploy the Operator’s daemon set. You can deploy one or multiple IngressNodeFirewall CRDs to nodes by applying firewall rules.
Prerequisite
- The Ingress Node Firewall Operator is installed.
Procedure
-
Create the
IngressNodeFirewallConfiginside theopenshift-ingress-node-firewallnamespace namedingressnodefirewallconfig. Run the following command to deploy Ingress Node Firewall Operator rules:
$ oc apply -f rule.yaml
5.8.5. Ingress Node Firewall configuration object
Review configuration fields so you can define how the Operator deploys the firewall.
The fields for the Ingress Node Firewall configuration object are described in the following table:
| Field | Type | Description |
|---|---|---|
|
|
|
The name of the CR object. The name of the firewall rules object must be |
|
|
|
Namespace for the Ingress Firewall Operator CR object. The |
|
|
| A node selection constraint used to target nodes through specified node labels. For example: Note
One label used in |
The Operator consumes the CR and creates an ingress node firewall daemon set on all the nodes that match the nodeSelector.
5.8.5.1. Ingress Node Firewall Operator example configuration
A complete Ingress Node Firewall Configuration is specified in the following example:
Example Ingress Node Firewall Configuration object
apiVersion: ingressnodefirewall.openshift.io/v1alpha1
kind: IngressNodeFirewallConfig
metadata:
name: ingressnodefirewallconfig
namespace: openshift-ingress-node-firewall
spec:
nodeSelector:
node-role.kubernetes.io/worker: ""
The Operator consumes the CR and creates an ingress node firewall daemon set on all the nodes that match the nodeSelector.
5.8.5.2. Ingress Node Firewall rules object
You can review rule fields and examples to define which ingress traffic is allowed or denied by using the Ingress Node Firewall rules object.
The fields for the Ingress Node Firewall rules object are described in the following table:
| Field | Type | Description |
|---|---|---|
|
|
| The name of the CR object. |
|
|
|
The fields for this object specify the interfaces to apply the firewall rules to. For example, |
|
|
|
You can use |
|
|
|
|
5.8.5.2.1. Ingress object configuration
The values for the ingress object are defined in the following table:
| Field | Type | Description |
|---|---|---|
|
|
| Allows you to set the CIDR block. You can configure multiple CIDRs from different address families. Note
Different CIDRs allow you to use the same order rule. In the case that there are multiple |
|
|
|
Ingress firewall
Set Note Ingress firewall rules are verified using a verification webhook that blocks any invalid configuration. The verification webhook prevents you from blocking any critical cluster services such as the API server. |
5.8.5.2.2. Ingress Node Firewall rules object example
A complete Ingress Node Firewall configuration is specified in the following example:
Example Ingress Node Firewall configuration
apiVersion: ingressnodefirewall.openshift.io/v1alpha1
kind: IngressNodeFirewall
metadata:
name: ingressnodefirewall
spec:
interfaces:
- eth0
nodeSelector:
matchLabels:
<label_name>: <label_value>
ingress:
- sourceCIDRs:
- 172.16.0.0/12
rules:
- order: 10
protocolConfig:
protocol: ICMP
icmp:
icmpType: 8 #ICMP Echo request
action: Deny
- order: 20
protocolConfig:
protocol: TCP
tcp:
ports: "8000-9000"
action: Deny
- sourceCIDRs:
- fc00:f853:ccd:e793::0/64
rules:
- order: 10
protocolConfig:
protocol: ICMPv6
icmpv6:
icmpType: 128 #ICMPV6 Echo request
action: Deny
+ A <label_name> and a <label_value> must exist on the node and must match the nodeselector label and value applied to the nodes you want the ingressfirewallconfig CR to run on. The <label_value> can be true or false. By using nodeSelector labels, you can target separate groups of nodes to apply different rules to using the ingressfirewallconfig CR.
5.8.5.2.3. Zero trust Ingress Node Firewall rules object example
Zero trust Ingress Node Firewall rules can provide additional security to multi-interface clusters. For example, you can use zero trust Ingress Node Firewall rules to drop all traffic on a specific interface except for SSH.
A complete configuration of a zero trust Ingress Node Firewall rule for a network-interface cluster is specified in the following example:
Users need to add all ports their application will use to their allowlist in the following case to ensure proper functionality.
Example zero trust Ingress Node Firewall rules
apiVersion: ingressnodefirewall.openshift.io/v1alpha1
kind: IngressNodeFirewall
metadata:
name: ingressnodefirewall-zero-trust
spec:
interfaces:
- eth1
nodeSelector:
matchLabels:
<ingress_firewall_label_name>: <label_value>
ingress:
- sourceCIDRs:
- 0.0.0.0/0
rules:
- order: 10
protocolConfig:
protocol: TCP
tcp:
ports: 22
action: Allow
- order: 20
action: Deny5.8.6. Viewing Ingress Node Firewall Operator rules
Inspect existing rules and configs to confirm the firewall is applied as intended.
Procedure
Run the following command to view all current rules :
$ oc get ingressnodefirewallChoose one of the returned
<resource>names and run the following command to view the rules or configs:$ oc get <resource> <name> -o yaml
5.8.7. Troubleshooting the Ingress Node Firewall Operator
You can verify the status and view the logs to diagnose ingress firewall deployment or rule issues.
Procedure
Run the following command to list installed Ingress Node Firewall custom resource definitions (CRD):
$ oc get crds | grep ingressnodefirewallExample output
NAME READY UP-TO-DATE AVAILABLE AGE ingressnodefirewallconfigs.ingressnodefirewall.openshift.io 2022-08-25T10:03:01Z ingressnodefirewallnodestates.ingressnodefirewall.openshift.io 2022-08-25T10:03:00Z ingressnodefirewalls.ingressnodefirewall.openshift.io 2022-08-25T10:03:00ZRun the following command to view the state of the Ingress Node Firewall Operator:
$ oc get pods -n openshift-ingress-node-firewallExample output
NAME READY STATUS RESTARTS AGE ingress-node-firewall-controller-manager 2/2 Running 0 5d21h ingress-node-firewall-daemon-pqx56 3/3 Running 0 5d21hThe following fields provide information about the status of the Operator:
READY,STATUS,AGE, andRESTARTS. TheSTATUSfield isRunningwhen the Ingress Node Firewall Operator is deploying a daemon set to the assigned nodes.Run the following command to collect all ingress firewall node pods' logs:
$ oc adm must-gather – gather_ingress_node_firewallThe logs are available in the sos node’s report containing eBPF
bpftooloutputs at/sos_commands/ebpf. These reports include lookup tables used or updated as the ingress firewall XDP handles packet processing, updates statistics, and emits events.
5.9. SR-IOV Operator
5.9.1. Installing the SR-IOV Network Operator
To manage SR-IOV network devices and network attachments on your cluster, install the Single Root I/O Virtualization (SR-IOV) Network Operator. By using this Operator, you can centralize the configuration and lifecycle management of your SR-IOV resources.
As a cluster administrator, you can install the Single Root I/O Virtualization (SR-IOV) Network Operator by using the OpenShift Container Platform CLI or the web console.
5.9.1.1. Using the CLI to install the SR-IOV Network Operator
You can use the CLI to install the SR-IOV Network Operator. By using the CLI, you can deploy the Operator directly from your terminal to manage SR-IOV network devices and attachments without navigating the web console.
Prerequisites
-
You installed the OpenShift CLI (
oc). -
You have an account with
cluster-adminprivileges. - You installed a cluster on bare-metal hardware, and you ensured that cluster nodes have hardware that supports SR-IOV.
Procedure
Create the
openshift-sriov-network-operatornamespace by entering the following command:$ cat << EOF| oc create -f - apiVersion: v1 kind: Namespace metadata: name: openshift-sriov-network-operator annotations: workload.openshift.io/allowed: management EOFCreate an
OperatorGroupcustom resource (CR) by entering the following command:$ cat << EOF| oc create -f - apiVersion: operators.coreos.com/v1 kind: OperatorGroup metadata: name: sriov-network-operators namespace: openshift-sriov-network-operator spec: targetNamespaces: - openshift-sriov-network-operator EOFCreate a
SubscriptionCR for the SR-IOV Network Operator by entering the following command:$ cat << EOF| oc create -f - apiVersion: operators.coreos.com/v1alpha1 kind: Subscription metadata: name: sriov-network-operator-subscription namespace: openshift-sriov-network-operator spec: channel: stable name: sriov-network-operator source: redhat-operators sourceNamespace: openshift-marketplace EOFCreate an
SriovoperatorConfigresource by entering the following command:$ cat <<EOF | oc create -f - apiVersion: sriovnetwork.openshift.io/v1 kind: SriovOperatorConfig metadata: name: default namespace: openshift-sriov-network-operator spec: enableInjector: true enableOperatorWebhook: true logLevel: 2 disableDrain: false EOF
Verification
To verify that the Operator is installed, enter the following command and then check that the output shows
Succeededfor the Operator:$ oc get csv -n openshift-sriov-network-operator \ -o custom-columns=Name:.metadata.name,Phase:.status.phase
5.9.1.2. Using the web console to install the SR-IOV Network Operator
You can use the web console to install the SR-IOV Network Operator. By using the web console, you can deploy the Operator and manage SR-IOV network devices and attachments directly from a graphical interface without having to the CLI.
Prerequisites
-
You have an account with
cluster-adminprivileges. - You installed a cluster on bare-metal hardware, and you ensured that cluster nodes have hardware that supports SR-IOV.
Procedure
Install the SR-IOV Network Operator:
- In the OpenShift Container Platform web console, click Operators → OperatorHub.
- Select SR-IOV Network Operator from the list of available Operators, and then click Install.
- On the Install Operator page, under Installed Namespace, select Operator recommended Namespace.
- Click Install.
Verification
- Navigate to the Operators → Installed Operators page.
Ensure that SR-IOV Network Operator is listed in the openshift-sriov-network-operator project with a Status of InstallSucceeded.
NoteDuring installation an Operator might display a Failed status. If the installation later succeeds with an InstallSucceeded message, you can ignore the Failed message.
If the Operator does not show as installed, complete any of the following steps to troubleshoot the issue:
- Inspect the Operator Subscriptions and Install Plans tabs for any failure or errors under Status.
-
Navigate to the Workloads → Pods page and check the logs for pods in the
openshift-sriov-network-operatorproject. Check the namespace of the YAML file. If the annotation is missing, you can add the annotation
workload.openshift.io/allowed=managementto the Operator namespace with the following command:$ oc annotate ns/openshift-sriov-network-operator workload.openshift.io/allowed=managementNoteFor single-node OpenShift clusters, the annotation
workload.openshift.io/allowed=managementis required for the namespace.
5.9.2. Configuring the SR-IOV Network Operator
To manage SR-IOV network devices and network attachments in your cluster, use the Single Root I/O Virtualization (SR-IOV) Network Operator.
5.9.2.1. Configuring the SR-IOV Network Operator
To manage SR-IOV network devices and network attachments in your cluster, configure the Single Root I/O Virtualization (SR-IOV) Network Operator. You can then deploy the Operator components to your cluster.
Procedure
Create a
SriovOperatorConfigcustom resource (CR). The following example creates a file namedsriovOperatorConfig.yaml:apiVersion: sriovnetwork.openshift.io/v1 kind: SriovOperatorConfig metadata: name: default namespace: openshift-sriov-network-operator spec: disableDrain: false enableInjector: true enableOperatorWebhook: true logLevel: 2 featureGates: metricsExporter: false # ...where:
metadata.name-
Specifies the name of the SR-IOV Network Operator instance. The only valid name for the
SriovOperatorConfigresource isdefaultand the name must be in the namespace where the Operator is deployed. spec.enableInjector-
Specifies if any
network-resources-injectorpod can run in the namespace. If not specified in the CR or explicitly set totrue, defaults tofalseor<none>, preventing anynetwork-resources-injectorpod from running in the namespace. The recommended setting istrue. spec.enableOperatorWebhook-
Specifies if any
operator-webhookpods can run in the namespace. TheenableOperatorWebhookfield, if not specified in the CR or explicitly set to true, defaults tofalseor<none>, preventing anyoperator-webhookpod from running in the namespace. The recommended setting istrue.
Apply the resource to your cluster by running the following command:
$ oc apply -f sriovOperatorConfig.yaml
5.9.2.2. SR-IOV Network Operator config custom resource
To customize the SR-IOV Network Operator, configure the sriovoperatorconfig custom resource. The reference lists the parameters available for controlling the global settings and deployment behavior of the Operator.
The following table describes the sriovoperatorconfig CR fields:
| Field | Type | Description |
|---|---|---|
|
|
|
Specifies the name of the SR-IOV Network Operator instance. The default value is |
|
|
|
Specifies the namespace of the SR-IOV Network Operator instance. The default value is |
|
|
| Specifies the node selection to control scheduling the SR-IOV Network Config Daemon on selected nodes. By default, this field is not set and the Operator deploys the SR-IOV Network Config daemon set on compute nodes. |
|
|
|
Specifies whether to disable the node draining process or enable the node draining process when you apply a new policy to configure the NIC on a node. Setting this field to |
|
|
| Specifies whether to enable or disable the Network Resources Injector daemon set. |
|
|
| Specifies whether to enable or disable the Operator Admission Controller webhook daemon set. |
|
|
|
Specifies the log verbosity level of the Operator. By default, this field is set to |
|
|
|
Specifies whether to enable or disable the optional features. For example, |
|
|
|
Specifies whether to enable or disable the SR-IOV Network Operator metrics. By default, this field is set to |
5.9.2.3. About the Network Resources Injector
To automate network configuration for your workloads, use the Network Resources Injector. This Kubernetes Dynamic Admission Controller intercepts pod creation requests to automatically inject the necessary network resources and parameters defined for your cluster.
The Network Resources Injector provides the following capabilities:
- Mutation of resource requests and limits in a pod specification to add an SR-IOV resource name according to an SR-IOV network attachment definition annotation.
-
Mutation of a pod specification with a Downward API volume to expose pod annotations, labels, and huge pages requests and limits. Containers that run in the pod can access the exposed information as files under the
/etc/podnetinfopath.
The SR-IOV Network Operator enables the Network Resources Injector when the enableInjector is set to true in the SriovOperatorConfig CR. The network-resources-injector pod runs as a daemon set on all control plane nodes. The following is an example of Network Resources Injector pods running in a cluster with three control plane nodes:
$ oc get pods -n openshift-sriov-network-operatorExample output
NAME READY STATUS RESTARTS AGE
network-resources-injector-5cz5p 1/1 Running 0 10m
network-resources-injector-dwqpx 1/1 Running 0 10m
network-resources-injector-lktz5 1/1 Running 0 10m5.9.2.4. Disabling or enabling the Network Resources Injector
To control the automatic configuration of your cluster workloads, enable or disable the Network Resources Injector. By adjusting these settings you can better manage whether the Kubernetes Dynamic Admission Controller automatically injects network resources and parameters into pods during their creation.
Prerequisites
-
Install the OpenShift CLI (
oc). -
Log in as a user with
cluster-adminprivileges. - You must have installed the SR-IOV Network Operator.
Procedure
Set the
enableInjectorfield. Replace<value>withfalseto disable the feature ortrueto enable the feature.$ oc patch sriovoperatorconfig default \ --type=merge -n openshift-sriov-network-operator \ --patch '{ "spec": { "enableInjector": <value> } }'TipYou can alternatively apply the following YAML to update the Operator:
apiVersion: sriovnetwork.openshift.io/v1 kind: SriovOperatorConfig metadata: name: default namespace: openshift-sriov-network-operator spec: enableInjector: <value> # ...
5.9.2.5. About the SR-IOV Network Operator admission controller webhook
To validate network configurations and prevent errors, rely on the SR-IOV Network Operator admission controller webhook. This Kubernetes Dynamic Admission Controller intercepts API requests to ensure that your SR-IOV resource definitions and pod specifications comply with cluster policies.
The SR-IOV Network Operator Admission Controller webhook provides the following capabilities:
-
Validation of the
SriovNetworkNodePolicyCR when it is created or updated. -
Mutation of the
SriovNetworkNodePolicyCR by setting the default value for thepriorityanddeviceTypefields when the CR is created or updated.
The SR-IOV Network Operator Admission Controller webhook is enabled by the Operator when the enableOperatorWebhook is set to true in the SriovOperatorConfig CR. The operator-webhook pod runs as a daemon set on all control plane nodes.
Use caution when disabling the SR-IOV Network Operator Admission Controller webhook. You can disable the webhook under specific circumstances, such as troubleshooting, or if you want to use unsupported devices. For information about configuring unsupported devices, see "Configuring the SR-IOV Network Operator to use an unsupported NIC".
The following is an example of the Operator Admission Controller webhook pods running in a cluster with three control plane nodes:
$ oc get pods -n openshift-sriov-network-operatorExample output
NAME READY STATUS RESTARTS AGE
operator-webhook-9jkw6 1/1 Running 0 16m
operator-webhook-kbr5p 1/1 Running 0 16m
operator-webhook-rpfrl 1/1 Running 0 16m5.9.2.6. Disabling or enabling the SR-IOV Network Operator admission controller webhook
To manage validation of your network configurations, enable or disable the SR-IOV Network Operator admission controller webhook. When enabled, the Operator automatically verifies SR-IOV resource definitions and pod specifications against cluster policies.
Prerequisites
-
Install the OpenShift CLI (
oc). -
Log in as a user with
cluster-adminprivileges. - You must have installed the SR-IOV Network Operator.
Procedure
Set the
enableOperatorWebhookfield. Replace<value>withfalseto disable the feature ortrueto enable it:$ oc patch sriovoperatorconfig default --type=merge \ -n openshift-sriov-network-operator \ --patch '{ "spec": { "enableOperatorWebhook": <value> } }'TipYou can alternatively apply the following YAML to update the Operator:
apiVersion: sriovnetwork.openshift.io/v1 kind: SriovOperatorConfig metadata: name: default namespace: openshift-sriov-network-operator spec: enableOperatorWebhook: <value> # ...
5.9.2.7. Configuring a custom NodeSelector for the SR-IOV Network Config daemon
To specify which nodes host the SR-IOV Network Config daemon, configure a custom node selector by using node labels. By completing this task, you can restrict deployment to specific nodes instead of the default compute nodes.
The SR-IOV Network Config daemon discovers and configures the SR-IOV network devices on cluster nodes. By default, the daemon is deployed to all the compute nodes in the cluster.
When you update the configDaemonNodeSelector field, the SR-IOV Network Config daemon is recreated on each selected node. While the daemon is recreated, cluster users are unable to apply any new SR-IOV Network node policy or create new SR-IOV pods.
Procedure
To update the node selector for the Operator, enter the following command:
$ oc patch sriovoperatorconfig default --type=json \ -n openshift-sriov-network-operator \ --patch '[{ "op": "replace", "path": "/spec/configDaemonNodeSelector", "value": {<node_label>} }]'Replace
<node_label>with a label to apply as in the following example:"node-role.kubernetes.io/worker": "".TipYou can alternatively apply the following YAML to update the Operator:
apiVersion: sriovnetwork.openshift.io/v1 kind: SriovOperatorConfig metadata: name: default namespace: openshift-sriov-network-operator spec: configDaemonNodeSelector: <node_label> # ...
5.9.2.8. Configuring the SR-IOV Network Operator for single node installations
By default, the SR-IOV Network Operator drains workloads from a node before every policy change. The Operator performs this action to ensure that no workloads are using the virtual functions before the reconfiguration. As a result, you must configure the Operator to not drain workloads from the single node.
For installations on a single node, other nodes do not receive the workloads.
After performing the following procedure to disable draining workloads, you must remove any workload that uses an SR-IOV network interface before you change any SR-IOV network node policy.
Prerequisites
-
Install the OpenShift CLI (
oc). -
Log in as a user with
cluster-adminprivileges. - You must have installed the SR-IOV Network Operator.
Procedure
To set the
disableDrainfield totrueand theconfigDaemonNodeSelectorfield tonode-role.kubernetes.io/master: "", enter the following command:$ oc patch sriovoperatorconfig default --type=merge -n openshift-sriov-network-operator --patch '{ "spec": { "disableDrain": true, "configDaemonNodeSelector": { "node-role.kubernetes.io/master": "" } } }'TipYou can alternatively apply the following YAML to update the Operator:
apiVersion: sriovnetwork.openshift.io/v1 kind: SriovOperatorConfig metadata: name: default namespace: openshift-sriov-network-operator spec: disableDrain: true configDaemonNodeSelector: node-role.kubernetes.io/master: "" # ...
5.9.2.8.1. Deploying the SR-IOV Operator for hosted control planes
Hosted control planes on the AWS platform is a Technology Preview feature only. Technology Preview features are not supported with Red Hat production service level agreements (SLAs) and might not be functionally complete. Red Hat does not recommend using them in production. These features provide early access to upcoming product features, enabling customers to test functionality and provide feedback during the development process.
For more information about the support scope of Red Hat Technology Preview features, see Technology Preview Features Support Scope.
After you configure and deploy your hosting service cluster, you can create a subscription to the SR-IOV Operator on a hosted cluster. The SR-IOV pod runs on worker machines rather than the control plane.
Prerequisites
You must configure and deploy the hosted cluster on AWS. For more information, see Configuring the hosting cluster on AWS (Technology Preview).
Procedure
Create a namespace and an Operator group:
apiVersion: v1 kind: Namespace metadata: name: openshift-sriov-network-operator --- apiVersion: operators.coreos.com/v1 kind: OperatorGroup metadata: name: sriov-network-operators namespace: openshift-sriov-network-operator spec: targetNamespaces: - openshift-sriov-network-operatorCreate a subscription to the SR-IOV Operator:
apiVersion: operators.coreos.com/v1alpha1 kind: Subscription metadata: name: sriov-network-operator-subsription namespace: openshift-sriov-network-operator spec: channel: stable name: sriov-network-operator config: nodeSelector: node-role.kubernetes.io/worker: "" source: redhat-operators sourceNamespace: openshift-marketplace
Verification
To verify that the SR-IOV Operator is ready, run the following command and view the resulting output:
$ oc get csv -n openshift-sriov-network-operatorExample output
NAME DISPLAY VERSION REPLACES PHASE sriov-network-operator.4.16.0-202211021237 SR-IOV Network Operator 4.16.0-202211021237 sriov-network-operator.4.16.0-202210290517 SucceededTo verify that the SR-IOV pods are deployed, run the following command:
$ oc get pods -n openshift-sriov-network-operator
5.9.2.9. About the SR-IOV network metrics exporter
To monitor the networking activity of SR-IOV pods, enable the SR-IOV network metrics exporter. This tool exposes metrics for SR-IOV virtual functions (VFs) in Prometheus format, so that you can query and visualize data through the OpenShift Container Platform web console.
When you query the SR-IOV VF metrics by using the web console, the SR-IOV network metrics exporter fetches and returns the VF network statistics along with the name and namespace of the pod that the VF is attached to.
The following table describes the SR-IOV VF metrics that the metrics exporter reads and exposes in Prometheus format:
| Metric | Description | Example PromQL query to examine the VF metric |
|---|---|---|
|
| Received bytes per virtual function. |
|
|
| Transmitted bytes per virtual function. |
|
|
| Received packets per virtual function. |
|
|
| Transmitted packets per virtual function. |
|
|
| Dropped packets upon receipt per virtual function. |
|
|
| Dropped packets during transmission per virtual function. |
|
|
| Received multicast packets per virtual function. |
|
|
| Received broadcast packets per virtual function. |
|
|
| Virtual functions linked to active pods. | - |
You can also combine these queries by using the kube-state-metrics tool to get more information about the SR-IOV pods. For example, you can use the following query to get the VF network statistics along with the application name from the standard Kubernetes pod label:
(sriov_vf_tx_packets * on (pciAddr,node) group_left(pod,namespace) sriov_kubepoddevice) * on (pod,namespace) group_left (label_app_kubernetes_io_name) kube_pod_labels5.9.2.9.1. Enabling the SR-IOV network metrics exporter
To enable the SR-IOV network metrics exporter, set the spec.featureGates.metricsExporter field to true. Because the exporter is disabled by default, you must explicitly activate this feature gate to start exposing metrics for your SR-IOV devices.
When the metrics exporter is enabled, the SR-IOV Network Operator deploys the metrics exporter only on nodes with SR-IOV capabilities.
Prerequisites
-
You have installed the OpenShift CLI (
oc). -
You have logged in as a user with
cluster-adminprivileges. - You have installed the SR-IOV Network Operator.
Procedure
Enable cluster monitoring by running the following command:
$ oc label ns/openshift-sriov-network-operator openshift.io/cluster-monitoring=trueTo enable cluster monitoring, you must add the
openshift.io/cluster-monitoring=truelabel in the namespace where you have installed the SR-IOV Network Operator.Set the
spec.featureGates.metricsExporterfield totrueby running the following command:$ oc patch -n openshift-sriov-network-operator sriovoperatorconfig/default \ --type='merge' -p='{"spec": {"featureGates": {"metricsExporter": true}}}'
Verification
Check that the SR-IOV network metrics exporter is enabled by running the following command:
$ oc get pods -n openshift-sriov-network-operatorExample output
NAME READY STATUS RESTARTS AGE operator-webhook-hzfg4 1/1 Running 0 5d22h sriov-network-config-daemon-tr54m 1/1 Running 0 5d22h sriov-network-metrics-exporter-z5d7t 1/1 Running 0 10s sriov-network-operator-cc6fd88bc-9bsmt 1/1 Running 0 5d22hEnsure that
sriov-network-metrics-exporterpod is in theREADYstate.- Optional: Examine the SR-IOV virtual function (VF) metrics by using the OpenShift Container Platform web console. For more information, see "Querying metrics".
5.9.3. Uninstalling the SR-IOV Network Operator
To uninstall the SR-IOV Network Operator, you must delete any running SR-IOV workloads, uninstall the Operator, and delete the webhooks that the Operator used.
5.9.3.1. Uninstalling the SR-IOV Network Operator
You can remove the SR-IOV Network Operator from your cluster by uninstalling the Operator. This ensures that the Operator and its associated resources are deleted when you no longer need to manage SR-IOV network devices.
Prerequisites
-
You have access to an OpenShift Container Platform cluster using an account with
cluster-adminpermissions. - You have the SR-IOV Network Operator installed.
Procedure
Delete all SR-IOV custom resources (CRs):
$ oc delete sriovnetwork -n openshift-sriov-network-operator --all$ oc delete sriovnetworknodepolicy -n openshift-sriov-network-operator --all$ oc delete sriovibnetwork -n openshift-sriov-network-operator --all- Follow the instructions in the "Deleting Operators from a cluster" section to remove the SR-IOV Network Operator from your cluster.
Delete the SR-IOV custom resource definitions that remain in the cluster after the SR-IOV Network Operator is uninstalled:
$ oc delete crd sriovibnetworks.sriovnetwork.openshift.io$ oc delete crd sriovnetworknodepolicies.sriovnetwork.openshift.io$ oc delete crd sriovnetworknodestates.sriovnetwork.openshift.io$ oc delete crd sriovnetworkpoolconfigs.sriovnetwork.openshift.io$ oc delete crd sriovnetworks.sriovnetwork.openshift.io$ oc delete crd sriovoperatorconfigs.sriovnetwork.openshift.ioDelete the SR-IOV webhooks:
$ oc delete mutatingwebhookconfigurations network-resources-injector-config$ oc delete MutatingWebhookConfiguration sriov-operator-webhook-config$ oc delete ValidatingWebhookConfiguration sriov-operator-webhook-configDelete the SR-IOV Network Operator namespace:
$ oc delete namespace openshift-sriov-network-operator
Chapter 6. Network security
6.1. Understanding network policy APIs
Kubernetes offers two features that users can use to enforce network security. One feature that allows users to enforce network policy is the NetworkPolicy API that is designed mainly for application developers and namespace tenants to protect their namespaces by creating namespace-scoped policies.
The second feature is AdminNetworkPolicy which consists of two APIs: the AdminNetworkPolicy (ANP) API and the BaselineAdminNetworkPolicy (BANP) API. ANP and BANP are designed for cluster and network administrators to protect their entire cluster by creating cluster-scoped policies. Cluster administrators can use ANPs to enforce non-overridable policies that take precedence over NetworkPolicy objects. Administrators can use BANP to set up and enforce optional cluster-scoped network policy rules that are overridable by users using NetworkPolicy objects when necessary. When used together, ANP, BANP, and network policy can achieve full multi-tenant isolation that administrators can use to secure their cluster.
OVN-Kubernetes CNI in OpenShift Container Platform implements these network policies using Access Control List (ACL) Tiers to evaluate and apply them. ACLs are evaluated in descending order from Tier 1 to Tier 3.
Tier 1 evaluates AdminNetworkPolicy (ANP) objects. Tier 2 evaluates NetworkPolicy objects. Tier 3 evaluates BaselineAdminNetworkPolicy (BANP) objects.
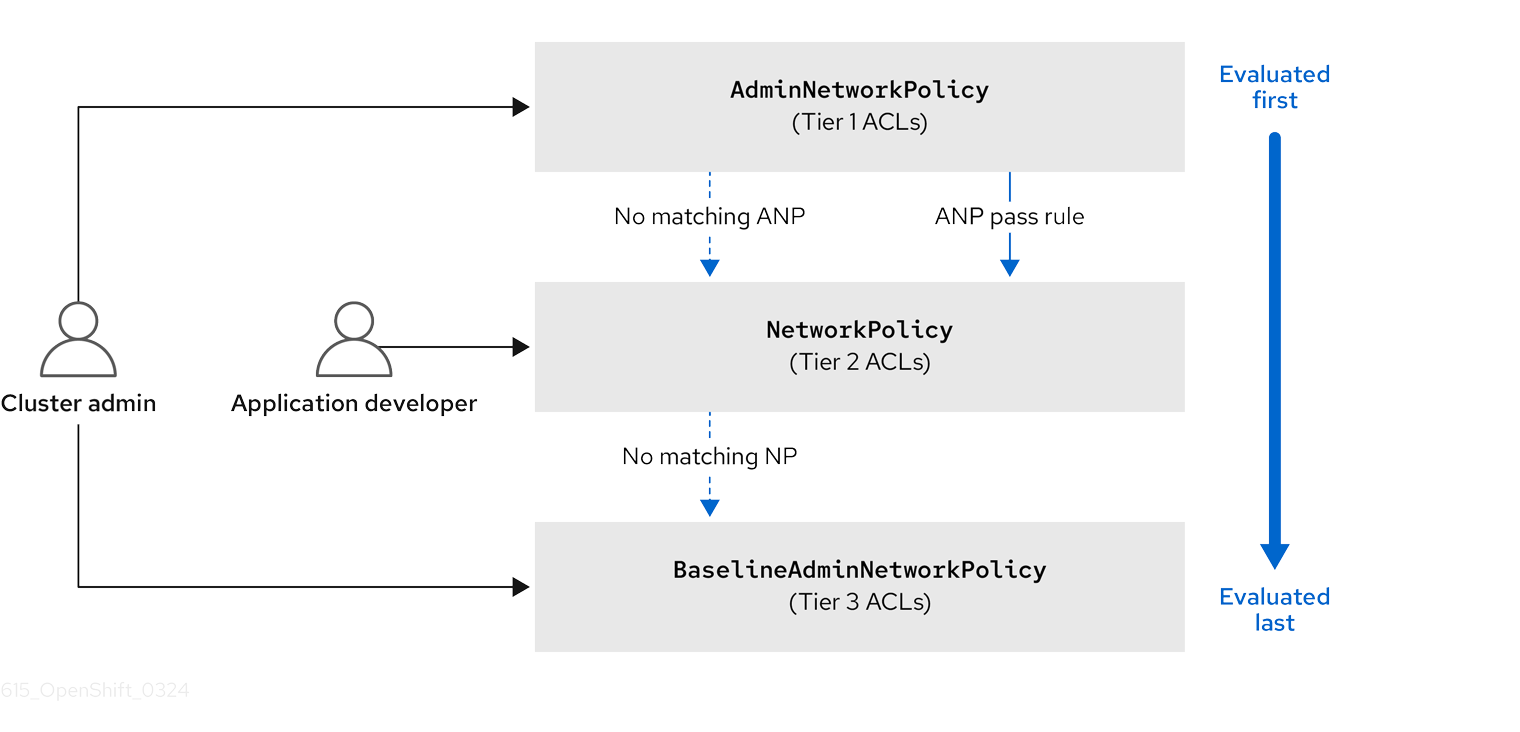
ANPs are evaluated first. When the match is an ANP allow or deny rule, any existing NetworkPolicy and BaselineAdminNetworkPolicy (BANP) objects in the cluster are skipped from evaluation. When the match is an ANP pass rule, then evaluation moves from tier 1 of the ACL to tier 2 where the NetworkPolicy policy is evaluated. If no NetworkPolicy matches the traffic then evaluation moves from tier 2 ACLs to tier 3 ACLs where BANP is evaluated.
6.1.1. Key differences between AdminNetworkPolicy and NetworkPolicy custom resources
The following table explains key differences between the cluster scoped AdminNetworkPolicy API and the namespace scoped NetworkPolicy API.
| Policy elements | AdminNetworkPolicy | NetworkPolicy |
|---|---|---|
| Applicable user | Cluster administrator or equivalent | Namespace owners |
| Scope | Cluster | Namespaced |
| Drop traffic |
Supported with an explicit |
Supported via implicit |
| Delegate traffic |
Supported with an | Not applicable |
| Allow traffic |
Supported with an explicit | The default action for all rules is to allow. |
| Rule precedence within the policy | Depends on the order in which they appear within an ANP. The higher the rule’s position the higher the precedence. | Rules are additive |
| Policy precedence |
Among ANPs the | There is no policy ordering between policies. |
| Feature precedence | Evaluated first via tier 1 ACL and BANP is evaluated last via tier 3 ACL. | Enforced after ANP and before BANP, they are evaluated in tier 2 of the ACL. |
| Matching pod selection | Can apply different rules across namespaces. | Can apply different rules across pods in single namespace. |
| Cluster egress traffic |
Supported via |
Supported through |
| Cluster ingress traffic | Not supported | Not supported |
| Fully qualified domain names (FQDN) peer support | Not supported | Not supported |
| Namespace selectors |
Supports advanced selection of Namespaces with the use of |
Supports label based namespace selection with the use of |
6.2. Admin network policy
6.2.1. OVN-Kubernetes AdminNetworkPolicy
6.2.1.1. AdminNetworkPolicy
An AdminNetworkPolicy (ANP) is a cluster-scoped custom resource definition (CRD). As a OpenShift Container Platform administrator, you can use ANP to secure your network by creating network policies before creating namespaces. Additionally, you can create network policies on a cluster-scoped level that is non-overridable by NetworkPolicy objects.
The key difference between AdminNetworkPolicy and NetworkPolicy objects are that the former is for administrators and is cluster scoped while the latter is for tenant owners and is namespace scoped.
An ANP allows administrators to specify the following:
-
A
priorityvalue that determines the order of its evaluation. The lower the value the higher the precedence. - A set of pods that consists of a set of namespaces or namespace on which the policy is applied.
-
A list of ingress rules to be applied for all ingress traffic towards the
subject. -
A list of egress rules to be applied for all egress traffic from the
subject.
6.2.1.1.1. AdminNetworkPolicy example
Example 6.1. Example YAML file for an ANP
apiVersion: policy.networking.k8s.io/v1alpha1
kind: AdminNetworkPolicy
metadata:
name: sample-anp-deny-pass-rules
spec:
priority: 50
subject:
namespaces:
matchLabels:
kubernetes.io/metadata.name: example.name
ingress:
- name: "deny-all-ingress-tenant-1"
action: "Deny"
from:
- pods:
namespaceSelector:
matchLabels:
custom-anp: tenant-1
podSelector:
matchLabels:
custom-anp: tenant-1
egress:
- name: "pass-all-egress-to-tenant-1"
action: "Pass"
to:
- pods:
namespaceSelector:
matchLabels:
custom-anp: tenant-1
podSelector:
matchLabels:
custom-anp: tenant-1- 1
- Specify a name for your ANP.
- 2
- The
spec.priorityfield supports a maximum of 100 ANPs in the range of values0-99in a cluster. The lower the value, the higher the precedence because the range is read in order from the lowest to highest value. Because there is no guarantee which policy takes precedence when ANPs are created at the same priority, set ANPs at different priorities so that precedence is deliberate. - 3
- Specify the namespace to apply the ANP resource.
- 4
- ANP have both ingress and egress rules. ANP rules for
spec.ingressfield accepts values ofPass,Deny, andAllowfor theactionfield. - 5
- Specify a name for the
ingress.name. - 6
- Specify
podSelector.matchLabelsto select pods within the namespaces selected bynamespaceSelector.matchLabelsas ingress peers. - 7
- ANPs have both ingress and egress rules. ANP rules for
spec.egressfield accepts values ofPass,Deny, andAllowfor theactionfield.
Additional resources
6.2.1.1.2. AdminNetworkPolicy actions for rules
As an administrator, you can set Allow, Deny, or Pass as the action field for your AdminNetworkPolicy rules. Because OVN-Kubernetes uses a tiered ACLs to evaluate network traffic rules, ANP allow you to set very strong policy rules that can only be changed by an administrator modifying them, deleting the rule, or overriding them by setting a higher priority rule.
6.2.1.1.2.1. AdminNetworkPolicy Allow example
The following ANP that is defined at priority 9 ensures all ingress traffic is allowed from the monitoring namespace towards any tenant (all other namespaces) in the cluster.
Example 6.2. Example YAML file for a strong Allow ANP
apiVersion: policy.networking.k8s.io/v1alpha1
kind: AdminNetworkPolicy
metadata:
name: allow-monitoring
spec:
priority: 9
subject:
namespaces: {} # Use the empty selector with caution because it also selects OpenShift namespaces as well.
ingress:
- name: "allow-ingress-from-monitoring"
action: "Allow"
from:
- namespaces:
matchLabels:
kubernetes.io/metadata.name: monitoring
# ...
This is an example of a strong Allow ANP because it is non-overridable by all the parties involved. No tenants can block themselves from being monitored using NetworkPolicy objects and the monitoring tenant also has no say in what it can or cannot monitor.
6.2.1.1.2.2. AdminNetworkPolicy Deny example
The following ANP that is defined at priority 5 ensures all ingress traffic from the monitoring namespace is blocked towards restricted tenants (namespaces that have labels security: restricted).
Example 6.3. Example YAML file for a strong Deny ANP
apiVersion: policy.networking.k8s.io/v1alpha1
kind: AdminNetworkPolicy
metadata:
name: block-monitoring
spec:
priority: 5
subject:
namespaces:
matchLabels:
security: restricted
ingress:
- name: "deny-ingress-from-monitoring"
action: "Deny"
from:
- namespaces:
matchLabels:
kubernetes.io/metadata.name: monitoring
# ...
This is a strong Deny ANP that is non-overridable by all the parties involved. The restricted tenant owners cannot authorize themselves to allow monitoring traffic, and the infrastructure’s monitoring service cannot scrape anything from these sensitive namespaces.
When combined with the strong Allow example, the block-monitoring ANP has a lower priority value giving it higher precedence, which ensures restricted tenants are never monitored.
6.2.1.1.2.3. AdminNetworkPolicy Pass example
The following ANP that is defined at priority 7 ensures all ingress traffic from the monitoring namespace towards internal infrastructure tenants (namespaces that have labels security: internal) are passed on to tier 2 of the ACLs and evaluated by the namespaces’ NetworkPolicy objects.
Example 6.4. Example YAML file for a strong Pass ANP
apiVersion: policy.networking.k8s.io/v1alpha1
kind: AdminNetworkPolicy
metadata:
name: pass-monitoring
spec:
priority: 7
subject:
namespaces:
matchLabels:
security: internal
ingress:
- name: "pass-ingress-from-monitoring"
action: "Pass"
from:
- namespaces:
matchLabels:
kubernetes.io/metadata.name: monitoring
# ...
This example is a strong Pass action ANP because it delegates the decision to NetworkPolicy objects defined by tenant owners. This pass-monitoring ANP allows all tenant owners grouped at security level internal to choose if their metrics should be scraped by the infrastructures' monitoring service using namespace scoped NetworkPolicy objects.
6.2.2. OVN-Kubernetes BaselineAdminNetworkPolicy
6.2.2.1. BaselineAdminNetworkPolicy
BaselineAdminNetworkPolicy (BANP) is a cluster-scoped custom resource definition (CRD). As a OpenShift Container Platform administrator, you can use BANP to setup and enforce optional baseline network policy rules that are overridable by users using NetworkPolicy objects if need be. Rule actions for BANP are allow or deny.
The BaselineAdminNetworkPolicy resource is a cluster singleton object that can be used as a guardrail policy incase a passed traffic policy does not match any NetworkPolicy objects in the cluster. A BANP can also be used as a default security model that provides guardrails that intra-cluster traffic is blocked by default and a user will need to use NetworkPolicy objects to allow known traffic. You must use default as the name when creating a BANP resource.
A BANP allows administrators to specify:
-
A
subjectthat consists of a set of namespaces or namespace. -
A list of ingress rules to be applied for all ingress traffic towards the
subject. -
A list of egress rules to be applied for all egress traffic from the
subject.
6.2.2.1.1. BaselineAdminNetworkPolicy example
Example 6.5. Example YAML file for BANP
apiVersion: policy.networking.k8s.io/v1alpha1
kind: BaselineAdminNetworkPolicy
metadata:
name: default
spec:
subject:
namespaces:
matchLabels:
kubernetes.io/metadata.name: example.name
ingress:
- name: "deny-all-ingress-from-tenant-1"
action: "Deny"
from:
- pods:
namespaceSelector:
matchLabels:
custom-banp: tenant-1
podSelector:
matchLabels:
custom-banp: tenant-1
egress:
- name: "allow-all-egress-to-tenant-1"
action: "Allow"
to:
- pods:
namespaceSelector:
matchLabels:
custom-banp: tenant-1
podSelector:
matchLabels:
custom-banp: tenant-1- 1
- The policy name must be
defaultbecause BANP is a singleton object. - 2
- Specify the namespace to apply the ANP to.
- 3
- BANP have both ingress and egress rules. BANP rules for
spec.ingressandspec.egressfields accepts values ofDenyandAllowfor theactionfield. - 4
- Specify a name for the
ingress.name - 5
- Specify the namespaces to select the pods from to apply the BANP resource.
- 6
- Specify
podSelector.matchLabelsname of the pods to apply the BANP resource.
6.2.2.1.2. BaselineAdminNetworkPolicy Deny example
The following BANP singleton ensures that the administrator has set up a default deny policy for all ingress monitoring traffic coming into the tenants at internal security level. When combined with the "AdminNetworkPolicy Pass example", this deny policy acts as a guardrail policy for all ingress traffic that is passed by the ANP pass-monitoring policy.
Example 6.6. Example YAML file for a guardrail Deny rule
apiVersion: policy.networking.k8s.io/v1alpha1
kind: BaselineAdminNetworkPolicy
metadata:
name: default
spec:
subject:
namespaces:
matchLabels:
security: internal
ingress:
- name: "deny-ingress-from-monitoring"
action: "Deny"
from:
- namespaces:
matchLabels:
kubernetes.io/metadata.name: monitoring
# ...
You can use an AdminNetworkPolicy resource with a Pass value for the action field in conjunction with the BaselineAdminNetworkPolicy resource to create a multi-tenant policy. This multi-tenant policy allows one tenant to collect monitoring data on their application while simultaneously not collecting data from a second tenant.
As an administrator, if you apply both the "AdminNetworkPolicy Pass action example" and the "BaselineAdminNetwork Policy Deny example", tenants are then left with the ability to choose to create a NetworkPolicy resource that will be evaluated before the BANP.
For example, Tenant 1 can set up the following NetworkPolicy resource to monitor ingress traffic:
Example 6.7. Example NetworkPolicy
apiVersion: networking.k8s.io/v1
kind: NetworkPolicy
metadata:
name: allow-monitoring
namespace: tenant 1
spec:
podSelector:
policyTypes:
- Ingress
ingress:
- from:
- namespaceSelector:
matchLabels:
kubernetes.io/metadata.name: monitoring
# ...
In this scenario, Tenant 1’s policy would be evaluated after the "AdminNetworkPolicy Pass action example" and before the "BaselineAdminNetwork Policy Deny example", which denies all ingress monitoring traffic coming into tenants with security level internal. With Tenant 1’s NetworkPolicy object in place, they will be able to collect data on their application. Tenant 2, however, who does not have any NetworkPolicy objects in place, will not be able to collect data. As an administrator, you have not by default monitored internal tenants, but instead, you created a BANP that allows tenants to use NetworkPolicy objects to override the default behavior of your BANP.
6.2.3. Monitoring ANP and BANP
AdminNetworkPolicy and BaselineAdminNetworkPolicy resources have metrics that can be used for monitoring and managing your policies. See the following table for more details on the metrics.
6.2.3.1. Metrics for AdminNetworkPolicy
| Name | Description | Explanation |
|---|---|---|
|
| Not applicable |
The total number of |
|
| Not applicable |
The total number of |
|
|
|
The total number of rules across all ANP policies in the cluster grouped by |
|
|
|
The total number of rules across all BANP policies in the cluster grouped by |
|
|
|
The total number of OVN Northbound database (nbdb) objects that are created by all the ANP in the cluster grouped by the |
|
|
|
The total number of OVN Northbound database (nbdb) objects that are created by all the BANP in the cluster grouped by the |
6.2.4. Egress nodes and networks peer for AdminNetworkPolicy
This section explains nodes and networks peers. Administrators can use the examples in this section to design AdminNetworkPolicy and BaselineAdminNetworkPolicy to control northbound traffic in their cluster.
6.2.4.1. Northbound traffic controls for AdminNetworkPolicy and BaselineAdminNetworkPolicy
In addition to supporting east-west traffic controls, ANP and BANP also allow administrators to control their northbound traffic leaving the cluster or traffic leaving the node to other nodes in the cluster. End-users can do the following:
-
Implement egress traffic control towards cluster nodes using
nodesegress peer -
Implement egress traffic control towards Kubernetes API servers using
nodesornetworksegress peers -
Implement egress traffic control towards external destinations outside the cluster using
networkspeer
For ANP and BANP, nodes and networks peers can be specified for egress rules only.
6.2.4.1.1. Using nodes peer to control egress traffic to cluster nodes
Using the nodes peer administrators can control egress traffic from pods to nodes in the cluster. A benefit of this is that you do not have to change the policy when nodes are added to or deleted from the cluster.
The following example allows egress traffic to the Kubernetes API server on port 6443 by any of the namespaces with a restricted, confidential, or internal level of security using the node selector peer. It also denies traffic to all worker nodes in your cluster from any of the namespaces with a restricted, confidential, or internal level of security.
Example 6.8. Example of ANP Allow egress using nodes peer
apiVersion: policy.networking.k8s.io/v1alpha1
kind: AdminNetworkPolicy
metadata:
name: egress-security-allow
spec:
egress:
- action: Deny
to:
- nodes:
matchExpressions:
- key: node-role.kubernetes.io/worker
operator: Exists
- action: Allow
name: allow-to-kubernetes-api-server-and-engr-dept-pods
ports:
- portNumber:
port: 6443
protocol: TCP
to:
- nodes:
matchExpressions:
- key: node-role.kubernetes.io/control-plane
operator: Exists
- pods:
namespaceSelector:
matchLabels:
dept: engr
podSelector: {}
priority: 55
subject:
namespaces:
matchExpressions:
- key: security
operator: In
values:
- restricted
- confidential
- internal- 1
- Specifies a node or set of nodes in the cluster using the
matchExpressionsfield. - 2
- Specifies all the pods labeled with
dept: engr. - 3
- Specifies the subject of the ANP which includes any namespaces that match the labels used by the network policy. The example matches any of the namespaces with
restricted,confidential, orinternallevel ofsecurity. - 4
- Specifies key/value pairs for
matchExpressionsfield.
6.2.4.1.2. Using networks peer to control egress traffic towards external destinations
Cluster administrators can use CIDR ranges in networks peer and apply a policy to control egress traffic leaving from pods and going to a destination configured at the IP address that is within the CIDR range specified with networks field.
The following example uses networks peer and combines ANP and BANP policies to restrict egress traffic.
Use the empty selector ({}) in the namespace field for ANP and BANP with caution. When using an empty selector, it also selects OpenShift namespaces.
If you use values of 0.0.0.0/0 in a ANP or BANP Deny rule, you must set a higher priority ANP Allow rule to necessary destinations before setting the Deny to 0.0.0.0/0.
Example 6.9. Example of ANP and BANP using networks peers
apiVersion: policy.networking.k8s.io/v1alpha1
kind: AdminNetworkPolicy
metadata:
name: network-as-egress-peer
spec:
priority: 70
subject:
namespaces: {} # Use the empty selector with caution because it also selects OpenShift namespaces as well.
egress:
- name: "deny-egress-to-external-dns-servers"
action: "Deny"
to:
- networks:
- 8.8.8.8/32
- 8.8.4.4/32
- 208.67.222.222/32
ports:
- portNumber:
protocol: UDP
port: 53
- name: "allow-all-egress-to-intranet"
action: "Allow"
to:
- networks:
- 89.246.180.0/22
- 60.45.72.0/22
- name: "allow-all-intra-cluster-traffic"
action: "Allow"
to:
- namespaces: {} # Use the empty selector with caution because it also selects OpenShift namespaces as well.
- name: "pass-all-egress-to-internet"
action: "Pass"
to:
- networks:
- 0.0.0.0/0
---
apiVersion: policy.networking.k8s.io/v1alpha1
kind: BaselineAdminNetworkPolicy
metadata:
name: default
spec:
subject:
namespaces: {} # Use the empty selector with caution because it also selects OpenShift namespaces as well.
egress:
- name: "deny-all-egress-to-internet"
action: "Deny"
to:
- networks:
- 0.0.0.0/0
---- 1
- Use
networksto specify a range of CIDR networks outside of the cluster. - 2
- Specifies the CIDR ranges for the intra-cluster traffic from your resources.
- 3 4
- Specifies a
Denyegress to everything by settingnetworksvalues to0.0.0.0/0. Make sure you have a higher priorityAllowrule to necessary destinations before setting aDenyto0.0.0.0/0because this will deny all traffic including to Kubernetes API and DNS servers.
Collectively the network-as-egress-peer ANP and default BANP using networks peers enforces the following egress policy:
- All pods cannot talk to external DNS servers at the listed IP addresses.
- All pods can talk to rest of the company’s intranet.
- All pods can talk to other pods, nodes, and services.
-
All pods cannot talk to the internet. Combining the last ANP
Passrule and the strong BANPDenyrule a guardrail policy is created that secures traffic in the cluster.
6.2.4.1.3. Using nodes peer and networks peer together
Cluster administrators can combine nodes and networks peer in your ANP and BANP policies.
Example 6.10. Example of nodes and networks peer
apiVersion: policy.networking.k8s.io/v1alpha1
kind: AdminNetworkPolicy
metadata:
name: egress-peer-1
spec:
egress:
- action: "Allow"
name: "allow-egress"
to:
- nodes:
matchExpressions:
- key: worker-group
operator: In
values:
- workloads # Egress traffic from nodes with label worker-group: workloads is allowed.
- networks:
- 104.154.164.170/32
- pods:
namespaceSelector:
matchLabels:
apps: external-apps
podSelector:
matchLabels:
app: web # This rule in the policy allows the traffic directed to pods labeled apps: web in projects with apps: external-apps to leave the cluster.
- action: "Deny"
name: "deny-egress"
to:
- nodes:
matchExpressions:
- key: worker-group
operator: In
values:
- infra # Egress traffic from nodes with label worker-group: infra is denied.
- networks:
- 104.154.164.160/32 # Egress traffic to this IP address from cluster is denied.
- pods:
namespaceSelector:
matchLabels:
apps: internal-apps
podSelector: {}
- action: "Pass"
name: "pass-egress"
to:
- nodes:
matchExpressions:
- key: node-role.kubernetes.io/worker
operator: Exists # All other egress traffic is passed to NetworkPolicy or BANP for evaluation.
priority: 30
subject:
namespaces:
matchLabels:
apps: all-apps- 1
- Specifies the name of the policy.
- 2
- For
nodesandnetworkspeers, you can only use northbound traffic controls in ANP asegress. - 3
- Specifies the priority of the ANP, determining the order in which they should be evaluated. Lower priority rules have higher precedence. ANP accepts values of 0-99 with 0 being the highest priority and 99 being the lowest.
- 4
- Specifies the set of pods in the cluster on which the rules of the policy are to be applied. In the example, any pods with the
apps: all-appslabel across all namespaces are thesubjectof the policy.
6.2.5. Troubleshooting AdminNetworkPolicy
6.2.5.1. Checking creation of ANP
To check that your AdminNetworkPolicy (ANP) and BaselineAdminNetworkPolicy (BANP) are created correctly, check the status outputs of the following commands: oc describe anp or oc describe banp.
A good status indicates OVN DB plumbing was successful and the SetupSucceeded.
Example 6.11. Example ANP with a good status
...
Conditions:
Last Transition Time: 2024-06-08T20:29:00Z
Message: Setting up OVN DB plumbing was successful
Reason: SetupSucceeded
Status: True
Type: Ready-In-Zone-ovn-control-plane Last Transition Time: 2024-06-08T20:29:00Z
Message: Setting up OVN DB plumbing was successful
Reason: SetupSucceeded
Status: True
Type: Ready-In-Zone-ovn-worker
Last Transition Time: 2024-06-08T20:29:00Z
Message: Setting up OVN DB plumbing was successful
Reason: SetupSucceeded
Status: True
Type: Ready-In-Zone-ovn-worker2
...If plumbing is unsuccessful, an error is reported from the respective zone controller.
Example 6.12. Example of an ANP with a bad status and error message
...
Status:
Conditions:
Last Transition Time: 2024-06-25T12:47:44Z
Message: error attempting to add ANP cluster-control with priority 600 because, OVNK only supports priority ranges 0-99
Reason: SetupFailed
Status: False
Type: Ready-In-Zone-example-worker-1.example.example-org.net
Last Transition Time: 2024-06-25T12:47:45Z
Message: error attempting to add ANP cluster-control with priority 600 because, OVNK only supports priority ranges 0-99
Reason: SetupFailed
Status: False
Type: Ready-In-Zone-example-worker-0.example.example-org.net
Last Transition Time: 2024-06-25T12:47:44Z
Message: error attempting to add ANP cluster-control with priority 600 because, OVNK only supports priority ranges 0-99
Reason: SetupFailed
Status: False
Type: Ready-In-Zone-example-ctlplane-1.example.example-org.net
Last Transition Time: 2024-06-25T12:47:44Z
Message: error attempting to add ANP cluster-control with priority 600 because, OVNK only supports priority ranges 0-99
Reason: SetupFailed
Status: False
Type: Ready-In-Zone-example-ctlplane-2.example.example-org.net
Last Transition Time: 2024-06-25T12:47:44Z
Message: error attempting to add ANP cluster-control with priority 600 because, OVNK only supports priority ranges 0-99
Reason: SetupFailed
Status: False
Type: Ready-In-Zone-example-ctlplane-0.example.example-org.net
```
See the following section for nbctl commands to help troubleshoot unsuccessful policies.
6.2.5.1.1. Using nbctl commands for ANP and BANP
To troubleshoot an unsuccessful setup, start by looking at OVN Northbound database (nbdb) objects including ACL, AdressSet, and Port_Group. To view the nbdb, you need to be inside the pod on that node to view the objects in that node’s database.
Prerequisites
-
Access to the cluster as a user with the
cluster-adminrole. -
The OpenShift CLI (
oc) installed.
To run ovn nbctl commands in a cluster, you must open a remote shell into the `nbdb`on the relevant node.
The following policy was used to generate outputs.
Example 6.13. AdminNetworkPolicy used to generate outputs
apiVersion: policy.networking.k8s.io/v1alpha1
kind: AdminNetworkPolicy
metadata:
name: cluster-control
spec:
priority: 34
subject:
namespaces:
matchLabels:
anp: cluster-control-anp # Only namespaces with this label have this ANP
ingress:
- name: "allow-from-ingress-router" # rule0
action: "Allow"
from:
- namespaces:
matchLabels:
policy-group.network.openshift.io/ingress: ""
- name: "allow-from-monitoring" # rule1
action: "Allow"
from:
- namespaces:
matchLabels:
kubernetes.io/metadata.name: openshift-monitoring
ports:
- portNumber:
protocol: TCP
port: 7564
- namedPort: "scrape"
- name: "allow-from-open-tenants" # rule2
action: "Allow"
from:
- namespaces: # open tenants
matchLabels:
tenant: open
- name: "pass-from-restricted-tenants" # rule3
action: "Pass"
from:
- namespaces: # restricted tenants
matchLabels:
tenant: restricted
- name: "default-deny" # rule4
action: "Deny"
from:
- namespaces: {} # Use the empty selector with caution because it also selects OpenShift namespaces as well.
egress:
- name: "allow-to-dns" # rule0
action: "Allow"
to:
- pods:
namespaceSelector:
matchlabels:
kubernetes.io/metadata.name: openshift-dns
podSelector:
matchlabels:
app: dns
ports:
- portNumber:
protocol: UDP
port: 5353
- name: "allow-to-kapi-server" # rule1
action: "Allow"
to:
- nodes:
matchExpressions:
- key: node-role.kubernetes.io/control-plane
operator: Exists
ports:
- portNumber:
protocol: TCP
port: 6443
- name: "allow-to-splunk" # rule2
action: "Allow"
to:
- namespaces:
matchlabels:
tenant: splunk
ports:
- portNumber:
protocol: TCP
port: 8991
- portNumber:
protocol: TCP
port: 8992
- name: "allow-to-open-tenants-and-intranet-and-worker-nodes" # rule3
action: "Allow"
to:
- nodes: # worker-nodes
matchExpressions:
- key: node-role.kubernetes.io/worker
operator: Exists
- networks: # intranet
- 172.29.0.0/30
- 10.0.54.0/19
- 10.0.56.38/32
- 10.0.69.0/24
- namespaces: # open tenants
matchLabels:
tenant: open
- name: "pass-to-restricted-tenants" # rule4
action: "Pass"
to:
- namespaces: # restricted tenants
matchLabels:
tenant: restricted
- name: "default-deny"
action: "Deny"
to:
- networks:
- 0.0.0.0/0Procedure
List pods with node information by running the following command:
$ oc get pods -n openshift-ovn-kubernetes -owideExample output
NAME READY STATUS RESTARTS AGE IP NODE NOMINATED NODE READINESS GATES ovnkube-control-plane-5c95487779-8k9fd 2/2 Running 0 34m 10.0.0.5 ci-ln-0tv5gg2-72292-6sjw5-master-0 <none> <none> ovnkube-control-plane-5c95487779-v2xn8 2/2 Running 0 34m 10.0.0.3 ci-ln-0tv5gg2-72292-6sjw5-master-1 <none> <none> ovnkube-node-524dt 8/8 Running 0 33m 10.0.0.4 ci-ln-0tv5gg2-72292-6sjw5-master-2 <none> <none> ovnkube-node-gbwr9 8/8 Running 0 24m 10.0.128.4 ci-ln-0tv5gg2-72292-6sjw5-worker-c-s9gqt <none> <none> ovnkube-node-h4fpx 8/8 Running 0 33m 10.0.0.5 ci-ln-0tv5gg2-72292-6sjw5-master-0 <none> <none> ovnkube-node-j4hzw 8/8 Running 0 24m 10.0.128.2 ci-ln-0tv5gg2-72292-6sjw5-worker-a-hzbh5 <none> <none> ovnkube-node-wdhgv 8/8 Running 0 33m 10.0.0.3 ci-ln-0tv5gg2-72292-6sjw5-master-1 <none> <none> ovnkube-node-wfncn 8/8 Running 0 24m 10.0.128.3 ci-ln-0tv5gg2-72292-6sjw5-worker-b-5bb7f <none> <none>Navigate into a pod to look at the northbound database by running the following command:
$ oc rsh -c nbdb -n openshift-ovn-kubernetes ovnkube-node-524dtRun the following command to look at the ACLs nbdb:
$ ovn-nbctl find ACL 'external_ids{>=}{"k8s.ovn.org/owner-type"=AdminNetworkPolicy,"k8s.ovn.org/name"=cluster-control}'- Where, cluster-control
-
Specifies the name of the
AdminNetworkPolicyyou are troubleshooting. - AdminNetworkPolicy
-
Specifies the type:
AdminNetworkPolicyorBaselineAdminNetworkPolicy.
Example 6.14. Example output for ACLs
_uuid : 0d5e4722-b608-4bb1-b625-23c323cc9926 action : allow-related direction : to-lport external_ids : {direction=Ingress, gress-index="2", "k8s.ovn.org/id"="default-network-controller:AdminNetworkPolicy:cluster-control:Ingress:2:None", "k8s.ovn.org/name"=cluster-control, "k8s.ovn.org/owner-controller"=default-network-controller, "k8s.ovn.org/owner-type"=AdminNetworkPolicy, port-policy-protocol=None} label : 0 log : false match : "outport == @a14645450421485494999 && ((ip4.src == $a13730899355151937870))" meter : acl-logging name : "ANP:cluster-control:Ingress:2" options : {} priority : 26598 severity : [] tier : 1 _uuid : b7be6472-df67-439c-8c9c-f55929f0a6e0 action : drop direction : from-lport external_ids : {direction=Egress, gress-index="5", "k8s.ovn.org/id"="default-network-controller:AdminNetworkPolicy:cluster-control:Egress:5:None", "k8s.ovn.org/name"=cluster-control, "k8s.ovn.org/owner-controller"=default-network-controller, "k8s.ovn.org/owner-type"=AdminNetworkPolicy, port-policy-protocol=None} label : 0 log : false match : "inport == @a14645450421485494999 && ((ip4.dst == $a11452480169090787059))" meter : acl-logging name : "ANP:cluster-control:Egress:5" options : {apply-after-lb="true"} priority : 26595 severity : [] tier : 1 _uuid : 5a6e5bb4-36eb-4209-b8bc-c611983d4624 action : pass direction : to-lport external_ids : {direction=Ingress, gress-index="3", "k8s.ovn.org/id"="default-network-controller:AdminNetworkPolicy:cluster-control:Ingress:3:None", "k8s.ovn.org/name"=cluster-control, "k8s.ovn.org/owner-controller"=default-network-controller, "k8s.ovn.org/owner-type"=AdminNetworkPolicy, port-policy-protocol=None} label : 0 log : false match : "outport == @a14645450421485494999 && ((ip4.src == $a764182844364804195))" meter : acl-logging name : "ANP:cluster-control:Ingress:3" options : {} priority : 26597 severity : [] tier : 1 _uuid : 04f20275-c410-405c-a923-0e677f767889 action : pass direction : from-lport external_ids : {direction=Egress, gress-index="4", "k8s.ovn.org/id"="default-network-controller:AdminNetworkPolicy:cluster-control:Egress:4:None", "k8s.ovn.org/name"=cluster-control, "k8s.ovn.org/owner-controller"=default-network-controller, "k8s.ovn.org/owner-type"=AdminNetworkPolicy, port-policy-protocol=None} label : 0 log : false match : "inport == @a14645450421485494999 && ((ip4.dst == $a5972452606168369118))" meter : acl-logging name : "ANP:cluster-control:Egress:4" options : {apply-after-lb="true"} priority : 26596 severity : [] tier : 1 _uuid : 4b5d836a-e0a3-4088-825e-f9f0ca58e538 action : drop direction : to-lport external_ids : {direction=Ingress, gress-index="4", "k8s.ovn.org/id"="default-network-controller:AdminNetworkPolicy:cluster-control:Ingress:4:None", "k8s.ovn.org/name"=cluster-control, "k8s.ovn.org/owner-controller"=default-network-controller, "k8s.ovn.org/owner-type"=AdminNetworkPolicy, port-policy-protocol=None} label : 0 log : false match : "outport == @a14645450421485494999 && ((ip4.src == $a13814616246365836720))" meter : acl-logging name : "ANP:cluster-control:Ingress:4" options : {} priority : 26596 severity : [] tier : 1 _uuid : 5d09957d-d2cc-4f5a-9ddd-b97d9d772023 action : allow-related direction : from-lport external_ids : {direction=Egress, gress-index="2", "k8s.ovn.org/id"="default-network-controller:AdminNetworkPolicy:cluster-control:Egress:2:tcp", "k8s.ovn.org/name"=cluster-control, "k8s.ovn.org/owner-controller"=default-network-controller, "k8s.ovn.org/owner-type"=AdminNetworkPolicy, port-policy-protocol=tcp} label : 0 log : false match : "inport == @a14645450421485494999 && ((ip4.dst == $a18396736153283155648)) && tcp && tcp.dst=={8991,8992}" meter : acl-logging name : "ANP:cluster-control:Egress:2" options : {apply-after-lb="true"} priority : 26598 severity : [] tier : 1 _uuid : 1a68a5ed-e7f9-47d0-b55c-89184d97e81a action : allow-related direction : from-lport external_ids : {direction=Egress, gress-index="1", "k8s.ovn.org/id"="default-network-controller:AdminNetworkPolicy:cluster-control:Egress:1:tcp", "k8s.ovn.org/name"=cluster-control, "k8s.ovn.org/owner-controller"=default-network-controller, "k8s.ovn.org/owner-type"=AdminNetworkPolicy, port-policy-protocol=tcp} label : 0 log : false match : "inport == @a14645450421485494999 && ((ip4.dst == $a10706246167277696183)) && tcp && tcp.dst==6443" meter : acl-logging name : "ANP:cluster-control:Egress:1" options : {apply-after-lb="true"} priority : 26599 severity : [] tier : 1 _uuid : aa1a224d-7960-4952-bdfb-35246bafbac8 action : allow-related direction : to-lport external_ids : {direction=Ingress, gress-index="1", "k8s.ovn.org/id"="default-network-controller:AdminNetworkPolicy:cluster-control:Ingress:1:tcp", "k8s.ovn.org/name"=cluster-control, "k8s.ovn.org/owner-controller"=default-network-controller, "k8s.ovn.org/owner-type"=AdminNetworkPolicy, port-policy-protocol=tcp} label : 0 log : false match : "outport == @a14645450421485494999 && ((ip4.src == $a6786643370959569281)) && tcp && tcp.dst==7564" meter : acl-logging name : "ANP:cluster-control:Ingress:1" options : {} priority : 26599 severity : [] tier : 1 _uuid : 1a27d30e-3f96-4915-8ddd-ade7f22c117b action : allow-related direction : from-lport external_ids : {direction=Egress, gress-index="3", "k8s.ovn.org/id"="default-network-controller:AdminNetworkPolicy:cluster-control:Egress:3:None", "k8s.ovn.org/name"=cluster-control, "k8s.ovn.org/owner-controller"=default-network-controller, "k8s.ovn.org/owner-type"=AdminNetworkPolicy, port-policy-protocol=None} label : 0 log : false match : "inport == @a14645450421485494999 && ((ip4.dst == $a10622494091691694581))" meter : acl-logging name : "ANP:cluster-control:Egress:3" options : {apply-after-lb="true"} priority : 26597 severity : [] tier : 1 _uuid : b23a087f-08f8-4225-8c27-4a9a9ee0c407 action : allow-related direction : from-lport external_ids : {direction=Egress, gress-index="0", "k8s.ovn.org/id"="default-network-controller:AdminNetworkPolicy:cluster-control:Egress:0:udp", "k8s.ovn.org/name"=cluster-control, "k8s.ovn.org/owner-controller"=default-network-controller, "k8s.ovn.org/owner-type"=AdminNetworkPolicy, port-policy-protocol=udp} label : 0 log : false match : "inport == @a14645450421485494999 && ((ip4.dst == $a13517855690389298082)) && udp && udp.dst==5353" meter : acl-logging name : "ANP:cluster-control:Egress:0" options : {apply-after-lb="true"} priority : 26600 severity : [] tier : 1 _uuid : d14ed5cf-2e06-496e-8cae-6b76d5dd5ccd action : allow-related direction : to-lport external_ids : {direction=Ingress, gress-index="0", "k8s.ovn.org/id"="default-network-controller:AdminNetworkPolicy:cluster-control:Ingress:0:None", "k8s.ovn.org/name"=cluster-control, "k8s.ovn.org/owner-controller"=default-network-controller, "k8s.ovn.org/owner-type"=AdminNetworkPolicy, port-policy-protocol=None} label : 0 log : false match : "outport == @a14645450421485494999 && ((ip4.src == $a14545668191619617708))" meter : acl-logging name : "ANP:cluster-control:Ingress:0" options : {} priority : 26600 severity : [] tier : 1NoteThe outputs for ingress and egress show you the logic of the policy in the ACL. For example, every time a packet matches the provided
matchtheactionis taken.Examine the specific ACL for the rule by running the following command:
$ ovn-nbctl find ACL 'external_ids{>=}{"k8s.ovn.org/owner-type"=AdminNetworkPolicy,direction=Ingress,"k8s.ovn.org/name"=cluster-control,gress-index="1"}'- Where,
cluster-control -
Specifies the
nameof your ANP. Ingress-
Specifies the
directionof traffic either of typeIngressorEgress. 1- Specifies the rule you want to look at.
For the example ANP named
cluster-controlatpriority34, the following is an example output forIngressrule1:Example 6.15. Example output
_uuid : aa1a224d-7960-4952-bdfb-35246bafbac8 action : allow-related direction : to-lport external_ids : {direction=Ingress, gress-index="1", "k8s.ovn.org/id"="default-network-controller:AdminNetworkPolicy:cluster-control:Ingress:1:tcp", "k8s.ovn.org/name"=cluster-control, "k8s.ovn.org/owner-controller"=default-network-controller, "k8s.ovn.org/owner-type"=AdminNetworkPolicy, port-policy-protocol=tcp} label : 0 log : false match : "outport == @a14645450421485494999 && ((ip4.src == $a6786643370959569281)) && tcp && tcp.dst==7564" meter : acl-logging name : "ANP:cluster-control:Ingress:1" options : {} priority : 26599 severity : [] tier : 1- Where,
Run the following command to look at address sets in the nbdb:
$ ovn-nbctl find Address_Set 'external_ids{>=}{"k8s.ovn.org/owner-type"=AdminNetworkPolicy,"k8s.ovn.org/name"=cluster-control}'Example 6.16. Example outputs for
Address_Set_uuid : 56e89601-5552-4238-9fc3-8833f5494869 addresses : ["192.168.194.135", "192.168.194.152", "192.168.194.193", "192.168.194.254"] external_ids : {direction=Egress, gress-index="1", ip-family=v4, "k8s.ovn.org/id"="default-network-controller:AdminNetworkPolicy:cluster-control:Egress:1:v4", "k8s.ovn.org/name"=cluster-control, "k8s.ovn.org/owner-controller"=default-network-controller, "k8s.ovn.org/owner-type"=AdminNetworkPolicy} name : a10706246167277696183 _uuid : 7df9330d-380b-4bdb-8acd-4eddeda2419c addresses : ["10.132.0.10", "10.132.0.11", "10.132.0.12", "10.132.0.13", "10.132.0.14", "10.132.0.15", "10.132.0.16", "10.132.0.17", "10.132.0.5", "10.132.0.7", "10.132.0.71", "10.132.0.75", "10.132.0.8", "10.132.0.81", "10.132.0.9", "10.132.2.10", "10.132.2.11", "10.132.2.12", "10.132.2.14", "10.132.2.15", "10.132.2.3", "10.132.2.4", "10.132.2.5", "10.132.2.6", "10.132.2.7", "10.132.2.8", "10.132.2.9", "10.132.3.64", "10.132.3.65", "10.132.3.72", "10.132.3.73", "10.132.3.76", "10.133.0.10", "10.133.0.11", "10.133.0.12", "10.133.0.13", "10.133.0.14", "10.133.0.15", "10.133.0.16", "10.133.0.17", "10.133.0.18", "10.133.0.19", "10.133.0.20", "10.133.0.21", "10.133.0.22", "10.133.0.23", "10.133.0.24", "10.133.0.25", "10.133.0.26", "10.133.0.27", "10.133.0.28", "10.133.0.29", "10.133.0.30", "10.133.0.31", "10.133.0.32", "10.133.0.33", "10.133.0.34", "10.133.0.35", "10.133.0.36", "10.133.0.37", "10.133.0.38", "10.133.0.39", "10.133.0.40", "10.133.0.41", "10.133.0.42", "10.133.0.44", "10.133.0.45", "10.133.0.46", "10.133.0.47", "10.133.0.48", "10.133.0.5", "10.133.0.6", "10.133.0.7", "10.133.0.8", "10.133.0.9", "10.134.0.10", "10.134.0.11", "10.134.0.12", "10.134.0.13", "10.134.0.14", "10.134.0.15", "10.134.0.16", "10.134.0.17", "10.134.0.18", "10.134.0.19", "10.134.0.20", "10.134.0.21", "10.134.0.22", "10.134.0.23", "10.134.0.24", "10.134.0.25", "10.134.0.26", "10.134.0.27", "10.134.0.28", "10.134.0.30", "10.134.0.31", "10.134.0.32", "10.134.0.33", "10.134.0.34", "10.134.0.35", "10.134.0.36", "10.134.0.37", "10.134.0.38", "10.134.0.4", "10.134.0.42", "10.134.0.9", "10.135.0.10", "10.135.0.11", "10.135.0.12", "10.135.0.13", "10.135.0.14", "10.135.0.15", "10.135.0.16", "10.135.0.17", "10.135.0.18", "10.135.0.19", "10.135.0.23", "10.135.0.24", "10.135.0.26", "10.135.0.27", "10.135.0.29", "10.135.0.3", "10.135.0.4", "10.135.0.40", "10.135.0.41", "10.135.0.42", "10.135.0.43", "10.135.0.44", "10.135.0.5", "10.135.0.6", "10.135.0.7", "10.135.0.8", "10.135.0.9"] external_ids : {direction=Ingress, gress-index="4", ip-family=v4, "k8s.ovn.org/id"="default-network-controller:AdminNetworkPolicy:cluster-control:Ingress:4:v4", "k8s.ovn.org/name"=cluster-control, "k8s.ovn.org/owner-controller"=default-network-controller, "k8s.ovn.org/owner-type"=AdminNetworkPolicy} name : a13814616246365836720 _uuid : 84d76f13-ad95-4c00-8329-a0b1d023c289 addresses : ["10.132.3.76", "10.135.0.44"] external_ids : {direction=Egress, gress-index="4", ip-family=v4, "k8s.ovn.org/id"="default-network-controller:AdminNetworkPolicy:cluster-control:Egress:4:v4", "k8s.ovn.org/name"=cluster-control, "k8s.ovn.org/owner-controller"=default-network-controller, "k8s.ovn.org/owner-type"=AdminNetworkPolicy} name : a5972452606168369118 _uuid : 0c53e917-f7ee-4256-8f3a-9522c0481e52 addresses : ["10.132.0.10", "10.132.0.11", "10.132.0.12", "10.132.0.13", "10.132.0.14", "10.132.0.15", "10.132.0.16", "10.132.0.17", "10.132.0.5", "10.132.0.7", "10.132.0.71", "10.132.0.75", "10.132.0.8", "10.132.0.81", "10.132.0.9", "10.132.2.10", "10.132.2.11", "10.132.2.12", "10.132.2.14", "10.132.2.15", "10.132.2.3", "10.132.2.4", "10.132.2.5", "10.132.2.6", "10.132.2.7", "10.132.2.8", "10.132.2.9", "10.132.3.64", "10.132.3.65", "10.132.3.72", "10.132.3.73", "10.132.3.76", "10.133.0.10", "10.133.0.11", "10.133.0.12", "10.133.0.13", "10.133.0.14", "10.133.0.15", "10.133.0.16", "10.133.0.17", "10.133.0.18", "10.133.0.19", "10.133.0.20", "10.133.0.21", "10.133.0.22", "10.133.0.23", "10.133.0.24", "10.133.0.25", "10.133.0.26", "10.133.0.27", "10.133.0.28", "10.133.0.29", "10.133.0.30", "10.133.0.31", "10.133.0.32", "10.133.0.33", "10.133.0.34", "10.133.0.35", "10.133.0.36", "10.133.0.37", "10.133.0.38", "10.133.0.39", "10.133.0.40", "10.133.0.41", "10.133.0.42", "10.133.0.44", "10.133.0.45", "10.133.0.46", "10.133.0.47", "10.133.0.48", "10.133.0.5", "10.133.0.6", "10.133.0.7", "10.133.0.8", "10.133.0.9", "10.134.0.10", "10.134.0.11", "10.134.0.12", "10.134.0.13", "10.134.0.14", "10.134.0.15", "10.134.0.16", "10.134.0.17", "10.134.0.18", "10.134.0.19", "10.134.0.20", "10.134.0.21", "10.134.0.22", "10.134.0.23", "10.134.0.24", "10.134.0.25", "10.134.0.26", "10.134.0.27", "10.134.0.28", "10.134.0.30", "10.134.0.31", "10.134.0.32", "10.134.0.33", "10.134.0.34", "10.134.0.35", "10.134.0.36", "10.134.0.37", "10.134.0.38", "10.134.0.4", "10.134.0.42", "10.134.0.9", "10.135.0.10", "10.135.0.11", "10.135.0.12", "10.135.0.13", "10.135.0.14", "10.135.0.15", "10.135.0.16", "10.135.0.17", "10.135.0.18", "10.135.0.19", "10.135.0.23", "10.135.0.24", "10.135.0.26", "10.135.0.27", "10.135.0.29", "10.135.0.3", "10.135.0.4", "10.135.0.40", "10.135.0.41", "10.135.0.42", "10.135.0.43", "10.135.0.44", "10.135.0.5", "10.135.0.6", "10.135.0.7", "10.135.0.8", "10.135.0.9"] external_ids : {direction=Egress, gress-index="2", ip-family=v4, "k8s.ovn.org/id"="default-network-controller:AdminNetworkPolicy:cluster-control:Egress:2:v4", "k8s.ovn.org/name"=cluster-control, "k8s.ovn.org/owner-controller"=default-network-controller, "k8s.ovn.org/owner-type"=AdminNetworkPolicy} name : a18396736153283155648 _uuid : 5228bf1b-dfd8-40ec-bfa8-95c5bf9aded9 addresses : [] external_ids : {direction=Ingress, gress-index="0", ip-family=v4, "k8s.ovn.org/id"="default-network-controller:AdminNetworkPolicy:cluster-control:Ingress:0:v4", "k8s.ovn.org/name"=cluster-control, "k8s.ovn.org/owner-controller"=default-network-controller, "k8s.ovn.org/owner-type"=AdminNetworkPolicy} name : a14545668191619617708 _uuid : 46530d69-70da-4558-8c63-884ec9dc4f25 addresses : ["10.132.2.10", "10.132.2.5", "10.132.2.6", "10.132.2.7", "10.132.2.8", "10.132.2.9", "10.133.0.47", "10.134.0.33", "10.135.0.10", "10.135.0.11", "10.135.0.12", "10.135.0.19", "10.135.0.24", "10.135.0.7", "10.135.0.8", "10.135.0.9"] external_ids : {direction=Ingress, gress-index="1", ip-family=v4, "k8s.ovn.org/id"="default-network-controller:AdminNetworkPolicy:cluster-control:Ingress:1:v4", "k8s.ovn.org/name"=cluster-control, "k8s.ovn.org/owner-controller"=default-network-controller, "k8s.ovn.org/owner-type"=AdminNetworkPolicy} name : a6786643370959569281 _uuid : 65fdcdea-0b9f-4318-9884-1b51d231ad1d addresses : ["10.132.3.72", "10.135.0.42"] external_ids : {direction=Ingress, gress-index="2", ip-family=v4, "k8s.ovn.org/id"="default-network-controller:AdminNetworkPolicy:cluster-control:Ingress:2:v4", "k8s.ovn.org/name"=cluster-control, "k8s.ovn.org/owner-controller"=default-network-controller, "k8s.ovn.org/owner-type"=AdminNetworkPolicy} name : a13730899355151937870 _uuid : 73eabdb0-36bf-4ca3-b66d-156ac710df4c addresses : ["10.0.32.0/19", "10.0.56.38/32", "10.0.69.0/24", "10.132.3.72", "10.135.0.42", "172.29.0.0/30", "192.168.194.103", "192.168.194.2"] external_ids : {direction=Egress, gress-index="3", ip-family=v4, "k8s.ovn.org/id"="default-network-controller:AdminNetworkPolicy:cluster-control:Egress:3:v4", "k8s.ovn.org/name"=cluster-control, "k8s.ovn.org/owner-controller"=default-network-controller, "k8s.ovn.org/owner-type"=AdminNetworkPolicy} name : a10622494091691694581 _uuid : 50cdbef2-71b5-474b-914c-6fcd1d7712d3 addresses : ["10.132.0.10", "10.132.0.11", "10.132.0.12", "10.132.0.13", "10.132.0.14", "10.132.0.15", "10.132.0.16", "10.132.0.17", "10.132.0.5", "10.132.0.7", "10.132.0.71", "10.132.0.75", "10.132.0.8", "10.132.0.81", "10.132.0.9", "10.132.2.10", "10.132.2.11", "10.132.2.12", "10.132.2.14", "10.132.2.15", "10.132.2.3", "10.132.2.4", "10.132.2.5", "10.132.2.6", "10.132.2.7", "10.132.2.8", "10.132.2.9", "10.132.3.64", "10.132.3.65", "10.132.3.72", "10.132.3.73", "10.132.3.76", "10.133.0.10", "10.133.0.11", "10.133.0.12", "10.133.0.13", "10.133.0.14", "10.133.0.15", "10.133.0.16", "10.133.0.17", "10.133.0.18", "10.133.0.19", "10.133.0.20", "10.133.0.21", "10.133.0.22", "10.133.0.23", "10.133.0.24", "10.133.0.25", "10.133.0.26", "10.133.0.27", "10.133.0.28", "10.133.0.29", "10.133.0.30", "10.133.0.31", "10.133.0.32", "10.133.0.33", "10.133.0.34", "10.133.0.35", "10.133.0.36", "10.133.0.37", "10.133.0.38", "10.133.0.39", "10.133.0.40", "10.133.0.41", "10.133.0.42", "10.133.0.44", "10.133.0.45", "10.133.0.46", "10.133.0.47", "10.133.0.48", "10.133.0.5", "10.133.0.6", "10.133.0.7", "10.133.0.8", "10.133.0.9", "10.134.0.10", "10.134.0.11", "10.134.0.12", "10.134.0.13", "10.134.0.14", "10.134.0.15", "10.134.0.16", "10.134.0.17", "10.134.0.18", "10.134.0.19", "10.134.0.20", "10.134.0.21", "10.134.0.22", "10.134.0.23", "10.134.0.24", "10.134.0.25", "10.134.0.26", "10.134.0.27", "10.134.0.28", "10.134.0.30", "10.134.0.31", "10.134.0.32", "10.134.0.33", "10.134.0.34", "10.134.0.35", "10.134.0.36", "10.134.0.37", "10.134.0.38", "10.134.0.4", "10.134.0.42", "10.134.0.9", "10.135.0.10", "10.135.0.11", "10.135.0.12", "10.135.0.13", "10.135.0.14", "10.135.0.15", "10.135.0.16", "10.135.0.17", "10.135.0.18", "10.135.0.19", "10.135.0.23", "10.135.0.24", "10.135.0.26", "10.135.0.27", "10.135.0.29", "10.135.0.3", "10.135.0.4", "10.135.0.40", "10.135.0.41", "10.135.0.42", "10.135.0.43", "10.135.0.44", "10.135.0.5", "10.135.0.6", "10.135.0.7", "10.135.0.8", "10.135.0.9"] external_ids : {direction=Egress, gress-index="0", ip-family=v4, "k8s.ovn.org/id"="default-network-controller:AdminNetworkPolicy:cluster-control:Egress:0:v4", "k8s.ovn.org/name"=cluster-control, "k8s.ovn.org/owner-controller"=default-network-controller, "k8s.ovn.org/owner-type"=AdminNetworkPolicy} name : a13517855690389298082 _uuid : 32a42f32-2d11-43dd-979d-a56d7ee6aa57 addresses : ["10.132.3.76", "10.135.0.44"] external_ids : {direction=Ingress, gress-index="3", ip-family=v4, "k8s.ovn.org/id"="default-network-controller:AdminNetworkPolicy:cluster-control:Ingress:3:v4", "k8s.ovn.org/name"=cluster-control, "k8s.ovn.org/owner-controller"=default-network-controller, "k8s.ovn.org/owner-type"=AdminNetworkPolicy} name : a764182844364804195 _uuid : 8fd3b977-6e1c-47aa-82b7-e3e3136c4a72 addresses : ["0.0.0.0/0"] external_ids : {direction=Egress, gress-index="5", ip-family=v4, "k8s.ovn.org/id"="default-network-controller:AdminNetworkPolicy:cluster-control:Egress:5:v4", "k8s.ovn.org/name"=cluster-control, "k8s.ovn.org/owner-controller"=default-network-controller, "k8s.ovn.org/owner-type"=AdminNetworkPolicy} name : a11452480169090787059Examine the specific address set of the rule by running the following command:
$ ovn-nbctl find Address_Set 'external_ids{>=}{"k8s.ovn.org/owner-type"=AdminNetworkPolicy,direction=Egress,"k8s.ovn.org/name"=cluster-control,gress-index="5"}'Example 6.17. Example outputs for
Address_Set_uuid : 8fd3b977-6e1c-47aa-82b7-e3e3136c4a72 addresses : ["0.0.0.0/0"] external_ids : {direction=Egress, gress-index="5", ip-family=v4, "k8s.ovn.org/id"="default-network-controller:AdminNetworkPolicy:cluster-control:Egress:5:v4", "k8s.ovn.org/name"=cluster-control, "k8s.ovn.org/owner-controller"=default-network-controller, "k8s.ovn.org/owner-type"=AdminNetworkPolicy} name : a11452480169090787059
Run the following command to look at the port groups in the nbdb:
$ ovn-nbctl find Port_Group 'external_ids{>=}{"k8s.ovn.org/owner-type"=AdminNetworkPolicy,"k8s.ovn.org/name"=cluster-control}'Example 6.18. Example outputs for
Port_Group_uuid : f50acf71-7488-4b9a-b7b8-c8a024e99d21 acls : [04f20275-c410-405c-a923-0e677f767889, 0d5e4722-b608-4bb1-b625-23c323cc9926, 1a27d30e-3f96-4915-8ddd-ade7f22c117b, 1a68a5ed-e7f9-47d0-b55c-89184d97e81a, 4b5d836a-e0a3-4088-825e-f9f0ca58e538, 5a6e5bb4-36eb-4209-b8bc-c611983d4624, 5d09957d-d2cc-4f5a-9ddd-b97d9d772023, aa1a224d-7960-4952-bdfb-35246bafbac8, b23a087f-08f8-4225-8c27-4a9a9ee0c407, b7be6472-df67-439c-8c9c-f55929f0a6e0, d14ed5cf-2e06-496e-8cae-6b76d5dd5ccd] external_ids : {"k8s.ovn.org/id"="default-network-controller:AdminNetworkPolicy:cluster-control", "k8s.ovn.org/name"=cluster-control, "k8s.ovn.org/owner-controller"=default-network-controller, "k8s.ovn.org/owner-type"=AdminNetworkPolicy} name : a14645450421485494999 ports : [5e75f289-8273-4f8a-8798-8c10f7318833, de7e1b71-6184-445d-93e7-b20acadf41ea]
6.2.6. Best practices for AdminNetworkPolicy
This section provides best practices for the AdminNetworkPolicy and BaselineAdminNetworkPolicy resources.
6.2.6.1. Designing AdminNetworkPolicy
When building AdminNetworkPolicy (ANP) resources, you might consider the following when creating your policies:
- You can create ANPs that have the same priority. If you do create two ANPs at the same priority, ensure that they do not apply overlapping rules to the same traffic. Only one rule per value is applied and there is no guarantee which rule is applied when there is more than one at the same priority value. Because there is no guarantee which policy takes precedence when overlapping ANPs are created, set ANPs at different priorities so that precedence is well defined.
- Administrators must create ANP that apply to user namespaces not system namespaces.
Applying ANP and BaselineAdminNetworkPolicy (BANP) to system namespaces (default, kube-system, any namespace whose name starts with openshift-, etc) is not supported, and this can leave your cluster unresponsive and in a non-functional state.
-
Because
0-100is the supported priority range, you might design your ANP to use a middle range like30-70. This leaves some placeholder for priorities before and after. Even in the middle range, you might want to leave gaps so that as your infrastructure requirements evolve over time, you are able to insert new ANPs when needed at the right priority level. If you pack your ANPs, then you might need to recreate all of them to accommodate any changes in the future. -
When using
0.0.0.0/0or::/0to create a strongDenypolicy, ensure that you have higher priorityAlloworPassrules for essential traffic. -
Use
Allowas youractionfield when you want to ensure that a connection is allowed no matter what. AnAllowrule in an ANP means that the connection will always be allowed, andNetworkPolicywill be ignored. -
Use
Passas youractionfield to delegate the policy decision of allowing or denying the connection to theNetworkPolicylayer. - Ensure that the selectors across multiple rules do not overlap so that the same IPs do not appear in multiple policies, which can cause performance and scale limitations.
-
Avoid using
namedPortsin conjunction withPortNumberandPortRangebecause this creates 6 ACLs and cause inefficiencies in your cluster.
6.2.6.1.1. Considerations for using BaselineAdminNetworkPolicy
You can define only a single
BaselineAdminNetworkPolicy(BANP) resource within a cluster. The following are supported uses for BANP that administrators might consider in designing their BANP:-
You can set a default deny policy for cluster-local ingress in user namespaces. This BANP will force developers to have to add
NetworkPolicyobjects to allow the ingress traffic that they want to allow, and if they do not add network policies for ingress it will be denied. -
You can set a default deny policy for cluster-local egress in user namespaces. This BANP will force developers to have to add
NetworkPolicyobjects to allow the egress traffic that they want to allow, and if they do not add network policies it will be denied. -
You can set a default allow policy for egress to the in-cluster DNS service. Such a BANP ensures that the namespaced users do not have to set an allow egress
NetworkPolicyto the in-cluster DNS service. -
You can set an egress policy that allows internal egress traffic to all pods but denies access to all external endpoints (i.e
0.0.0.0/0and::/0). This BANP allows user workloads to send traffic to other in-cluster endpoints, but not to external endpoints by default.NetworkPolicycan then be used by developers in order to allow their applications to send traffic to an explicit set of external services.
-
You can set a default deny policy for cluster-local ingress in user namespaces. This BANP will force developers to have to add
-
Ensure you scope your BANP so that it only denies traffic to user namespaces and not to system namespaces. This is because the system namespaces do not have
NetworkPolicyobjects to override your BANP.
6.2.6.1.2. Differences to consider between AdminNetworkPolicy and NetworkPolicy
-
Unlike
NetworkPolicyobjects, you must use explicit labels to reference your workloads within ANP and BANP rather than using the empty ({}) catch all selector to avoid accidental traffic selection.
An empty namespace selector applied to a infrastructure namespace can make your cluster unresponsive and in a non-functional state.
-
In API semantics for ANP, you have to explicitly define allow or deny rules when you create the policy, unlike
NetworkPolicyobjects which have an implicit deny. -
Unlike
NetworkPolicyobjects,AdminNetworkPolicyobjects ingress rules are limited to in-cluster pods and namespaces so you cannot, and do not need to, set rules for ingress from the host network.
6.3. Network policy
6.3.1. About network policy
As a developer, you can define network policies that restrict traffic to pods in your cluster.
6.3.1.1. About network policy
In a cluster that uses a network plugin that supports a Kubernetes network policy, a NetworkPolicy object controls network isolation. In OpenShift Container Platform 4.16, OpenShift SDN supports using network policy in its default network isolation mode.
- On OpenShift SDN: A network policy does not apply to the host network namespace. Network policy rules do not impact pods configured with host networking enabled. Network policy rules might impact pods connected to host-networked pods.
-
On Openshift-OVN-Kubernetes: Network policies do impact pods that have host networking enabled, so you must explicitly allow a connection to these pods in your network policy rules. If a namespace has any network policy applied, traffic originating from system components, such as
openshift-ingressoropenshift-kube-apiserver, get dropped by default; You must explicitly enable this traffic to allow it through. -
Using the
namespaceSelectorfield without thepodSelectorfield set to{}will not includehostNetworkpods. You must use thepodSelectorset to{}with thenamespaceSelectorfield in order to targethostNetworkpods when creating network policies. - Network policies cannot block traffic from localhost or from their resident nodes.
By default, all pods in a project are accessible from other pods and network endpoints. To isolate one or more pods in a project, you can create NetworkPolicy objects in that project to indicate the allowed incoming connections. Project administrators can create and delete NetworkPolicy objects within their own project.
If a pod is matched by selectors in one or more NetworkPolicy objects, then the pod will accept only connections that are allowed by at least one of those NetworkPolicy objects. A pod that is not selected by any NetworkPolicy objects is fully accessible.
A network policy applies to only the Transmission Control Protocol (TCP), User Datagram Protocol (UDP), Internet Control Message Protocol (ICMP), and Stream Control Transmission Protocol (SCTP) protocols. Other protocols are not affected.
The following example NetworkPolicy objects demonstrate supporting different scenarios:
Deny all traffic:
To make a project deny by default, add a
NetworkPolicyobject that matches all pods but accepts no traffic:kind: NetworkPolicy apiVersion: networking.k8s.io/v1 metadata: name: deny-by-default spec: podSelector: {} ingress: []Only allow connections from the OpenShift Container Platform Ingress Controller:
To make a project allow only connections from the OpenShift Container Platform Ingress Controller, add the following
NetworkPolicyobject.apiVersion: networking.k8s.io/v1 kind: NetworkPolicy metadata: name: allow-from-openshift-ingress spec: ingress: - from: - namespaceSelector: matchLabels: policy-group.network.openshift.io/ingress: "" podSelector: {} policyTypes: - IngressOnly accept connections from pods within a project:
ImportantTo allow ingress connections from
hostNetworkpods in the same namespace, you need to apply theallow-from-hostnetworkpolicy together with theallow-same-namespacepolicy.To make pods accept connections from other pods in the same project, but reject all other connections from pods in other projects, add the following
NetworkPolicyobject:kind: NetworkPolicy apiVersion: networking.k8s.io/v1 metadata: name: allow-same-namespace spec: podSelector: {} ingress: - from: - podSelector: {}Only allow HTTP and HTTPS traffic based on pod labels:
To enable only HTTP and HTTPS access to the pods with a specific label (
role=frontendin following example), add aNetworkPolicyobject similar to the following:kind: NetworkPolicy apiVersion: networking.k8s.io/v1 metadata: name: allow-http-and-https spec: podSelector: matchLabels: role: frontend ingress: - ports: - protocol: TCP port: 80 - protocol: TCP port: 443Accept connections by using both namespace and pod selectors:
To match network traffic by combining namespace and pod selectors, you can use a
NetworkPolicyobject similar to the following:kind: NetworkPolicy apiVersion: networking.k8s.io/v1 metadata: name: allow-pod-and-namespace-both spec: podSelector: matchLabels: name: test-pods ingress: - from: - namespaceSelector: matchLabels: project: project_name podSelector: matchLabels: name: test-pods
NetworkPolicy objects are additive, which means you can combine multiple NetworkPolicy objects together to satisfy complex network requirements.
For example, for the NetworkPolicy objects defined in previous samples, you can define both allow-same-namespace and allow-http-and-https policies within the same project. Thus allowing the pods with the label role=frontend, to accept any connection allowed by each policy. That is, connections on any port from pods in the same namespace, and connections on ports 80 and 443 from pods in any namespace.
6.3.1.1.1. Using the allow-from-router network policy
Use the following NetworkPolicy to allow external traffic regardless of the router configuration:
apiVersion: networking.k8s.io/v1
kind: NetworkPolicy
metadata:
name: allow-from-router
spec:
ingress:
- from:
- namespaceSelector:
matchLabels:
policy-group.network.openshift.io/ingress: ""
podSelector: {}
policyTypes:
- Ingress- 1
policy-group.network.openshift.io/ingress:""label supports both OpenShift-SDN and OVN-Kubernetes.
6.3.1.1.2. Using the allow-from-hostnetwork network policy
Add the following allow-from-hostnetwork NetworkPolicy object to direct traffic from the host network pods.
apiVersion: networking.k8s.io/v1
kind: NetworkPolicy
metadata:
name: allow-from-hostnetwork
spec:
ingress:
- from:
- namespaceSelector:
matchLabels:
policy-group.network.openshift.io/host-network: ""
podSelector: {}
policyTypes:
- Ingress6.3.1.2. Optimizations for network policy with OpenShift SDN
Use a network policy to isolate pods that are differentiated from one another by labels within a namespace.
It is inefficient to apply NetworkPolicy objects to large numbers of individual pods in a single namespace. Pod labels do not exist at the IP address level, so a network policy generates a separate Open vSwitch (OVS) flow rule for every possible link between every pod selected with a podSelector.
For example, if the spec podSelector and the ingress podSelector within a NetworkPolicy object each match 200 pods, then 40,000 (200*200) OVS flow rules are generated. This might slow down a node.
When designing your network policy, refer to the following guidelines:
Reduce the number of OVS flow rules by using namespaces to contain groups of pods that need to be isolated.
NetworkPolicyobjects that select a whole namespace, by using thenamespaceSelectoror an emptypodSelector, generate only a single OVS flow rule that matches the VXLAN virtual network ID (VNID) of the namespace.- Keep the pods that do not need to be isolated in their original namespace, and move the pods that require isolation into one or more different namespaces.
- Create additional targeted cross-namespace network policies to allow the specific traffic that you do want to allow from the isolated pods.
6.3.1.3. Optimizations for network policy with OVN-Kubernetes network plugin
Learn how to optimize OVN-Kubernetes network policies to reduce flow count and ensure external IP traffic is allowed when needed.
When designing your network policy, refer to the following guidelines:
-
For network policies with the same
spec.podSelectorspec, it is more efficient to use one network policy with multipleingressoregressrules, than multiple network policies with subsets ofingressoregressrules. Every
ingressoregressrule based on thepodSelectorornamespaceSelectorspec generates the number of OVS flows proportional tonumber of pods selected by network policy + number of pods selected by ingress or egress rule. Therefore, it is preferable to use thepodSelectorornamespaceSelectorspec that can select as many pods as you need in one rule, instead of creating individual rules for every pod.For example, the following policy contains two rules:
apiVersion: networking.k8s.io/v1 kind: NetworkPolicy metadata: name: test-network-policy spec: podSelector: {} ingress: - from: - podSelector: matchLabels: role: frontend - from: - podSelector: matchLabels: role: backendThe following policy expresses those same two rules as one:
apiVersion: networking.k8s.io/v1 kind: NetworkPolicy metadata: name: test-network-policy spec: podSelector: {} ingress: - from: - podSelector: matchExpressions: - {key: role, operator: In, values: [frontend, backend]}The same guideline applies to the
spec.podSelectorspec. If you have the sameingressoregressrules for different network policies, it might be more efficient to create one network policy with a commonspec.podSelectorspec. For example, the following two policies have different rules:apiVersion: networking.k8s.io/v1 kind: NetworkPolicy metadata: name: policy1 spec: podSelector: matchLabels: role: db ingress: - from: - podSelector: matchLabels: role: frontend --- apiVersion: networking.k8s.io/v1 kind: NetworkPolicy metadata: name: policy2 spec: podSelector: matchLabels: role: client ingress: - from: - podSelector: matchLabels: role: frontendThe following network policy expresses those same two rules as one:
apiVersion: networking.k8s.io/v1 kind: NetworkPolicy metadata: name: policy3 spec: podSelector: matchExpressions: - {key: role, operator: In, values: [db, client]} ingress: - from: - podSelector: matchLabels: role: frontendYou can apply this optimization when only multiple selectors are expressed as one. In cases where selectors are based on different labels, it may not be possible to apply this optimization. In those cases, consider applying some new labels for network policy optimization specifically.
6.3.1.3.1. NetworkPolicy CR and external IPs in OVN-Kubernetes
In OVN-Kubernetes, the NetworkPolicy custom resource (CR) enforces strict isolation rules. If a service is exposed using an external IP, a network policy can block access from other namespaces unless explicitly configured to allow traffic.
To allow access to external IPs across namespaces, create a NetworkPolicy CR that explicitly permits ingress from the required namespaces and ensures traffic is allowed to the designated service ports. Without allowing traffic to the required ports, access might still be restricted.
Example output
apiVersion: networking.k8s.io/v1
kind: NetworkPolicy
metadata:
annotations:
name: <policy_name>
namespace: openshift-ingress
spec:
ingress:
- ports:
- port: 80
protocol: TCP
- ports:
- port: 443
protocol: TCP
- from:
- namespaceSelector:
matchLabels:
kubernetes.io/metadata.name: <my_namespace>
podSelector: {}
policyTypes:
- Ingresswhere:
<policy_name>- Specifies your name for the policy.
<my_namespace>- Specifies the name of the namespace where the policy is deployed.
For more details, see "About network policy".
6.3.1.4. Next steps
6.3.2. Creating a network policy
As a cluster administrator, you can create a network policy for a namespace.
6.3.2.1. Example NetworkPolicy object
The following configuration annotates an example NetworkPolicy object:
kind: NetworkPolicy
apiVersion: networking.k8s.io/v1
metadata:
name: allow-27107
spec:
podSelector:
matchLabels:
app: mongodb
ingress:
- from:
- podSelector:
matchLabels:
app: app
ports:
- protocol: TCP
port: 27017where:
name- The name of the NetworkPolicy object.
spec.podSelector- A selector that describes the pods to which the policy applies. The policy object can only select pods in the project that defines the NetworkPolicy object.
ingress.from.podSelector- A selector that matches the pods from which the policy object allows ingress traffic. The selector matches pods in the same namespace as the NetworkPolicy.
ingress.ports- A list of one or more destination ports on which to accept traffic.
6.3.2.2. Creating a network policy using the CLI
To define granular rules describing ingress or egress network traffic allowed for namespaces in your cluster, you can create a network policy.
If you log in with a user with the cluster-admin role, then you can create a network policy in any namespace in the cluster.
Prerequisites
-
Your cluster uses a network plugin that supports
NetworkPolicyobjects, such as the OVN-Kubernetes network plugin or the OpenShift SDN network plugin withmode: NetworkPolicyset. This mode is the default for OpenShift SDN. -
You installed the OpenShift CLI (
oc). -
You logged in to the cluster with a user with
adminprivileges. - You are working in the namespace that the network policy applies to.
Procedure
Create a policy rule.
Create a
<policy_name>.yamlfile:$ touch <policy_name>.yamlwhere:
<policy_name>- Specifies the network policy file name.
Define a network policy in the created file. The following example denies ingress traffic from all pods in all namespaces. This is a fundamental policy, blocking all cross-pod networking other than cross-pod traffic allowed by the configuration of other Network Policies.
kind: NetworkPolicy apiVersion: networking.k8s.io/v1 spec: podSelector: {} policyTypes: - Ingress ingress: []The following example configuration allows ingress traffic from all pods in the same namespace:
kind: NetworkPolicy apiVersion: networking.k8s.io/v1 metadata: name: allow-same-namespace spec: podSelector: ingress: - from: - podSelector: {} # ...The following example allows ingress traffic to one pod from a particular namespace. This policy allows traffic to pods that have the
pod-alabel from pods running innamespace-y.kind: NetworkPolicy apiVersion: networking.k8s.io/v1 metadata: name: allow-traffic-pod spec: podSelector: matchLabels: pod: pod-a policyTypes: - Ingress ingress: - from: - namespaceSelector: matchLabels: kubernetes.io/metadata.name: namespace-y # ...The following example configuration restricts traffic to a service. This policy when applied ensures every pod with both labels
app=bookstoreandrole=apican only be accessed by pods with labelapp=bookstore. In this example the application could be a REST API server, marked with labelsapp=bookstoreandrole=api.This example configuration addresses the following use cases:
- Restricting the traffic to a service to only the other microservices that need to use it.
Restricting the connections to a database to only permit the application using it.
kind: NetworkPolicy apiVersion: networking.k8s.io/v1 metadata: name: api-allow spec: podSelector: matchLabels: app: bookstore role: api ingress: - from: - podSelector: matchLabels: app: bookstore # ...
To create the network policy object, enter the following command. Successful output lists the name of the policy object and the
createdstatus.$ oc apply -f <policy_name>.yaml -n <namespace>where:
<policy_name>- Specifies the network policy file name.
<namespace>- Optional parameter. If you defined the object in a different namespace than the current namespace, the parameter specifices the namespace.
Successful output lists the name of the policy object and the
createdstatus.NoteIf you log in to the web console with
cluster-adminprivileges, you have a choice of creating a network policy in any namespace in the cluster directly in YAML or from a form in the web console.
6.3.2.3. Creating a default deny all network policy
The default deny all network policy blocks all cross-pod networking other than network traffic allowed by the configuration of other deployed network policies and traffic between host-networked pods. This procedure enforces a strong deny policy by applying a deny-by-default policy in the my-project namespace.
Without configuring a NetworkPolicy custom resource (CR) that allows traffic communication, the following policy might cause communication problems across your cluster.
Prerequisites
-
Your cluster uses a network plugin that supports
NetworkPolicyobjects, such as the OVN-Kubernetes network plugin or the OpenShift SDN network plugin withmode: NetworkPolicyset. This mode is the default for OpenShift SDN. -
You installed the OpenShift CLI (
oc). -
You logged in to the cluster with a user with
adminprivileges. - You are working in the namespace that the network policy applies to.
Procedure
Create the following YAML that defines a
deny-by-defaultpolicy to deny ingress from all pods in all namespaces. Save the YAML in thedeny-by-default.yamlfile:kind: NetworkPolicy apiVersion: networking.k8s.io/v1 metadata: name: deny-by-default namespace: my-project spec: podSelector: {} ingress: []where:
namespace-
Specifies the namespace in which to deploy the policy. For example, the
my-projectnamespace. podSelector-
If this field is empty, the configuration matches all the pods. Therefore, the policy applies to all pods in the
my-projectnamespace. ingress-
Where
[]indicates that noingressrules are specified. This causes incoming traffic to be dropped to all pods.
Apply the policy by entering the following command. Successful output lists the name of the policy object and the
createdstatus.$ oc apply -f deny-by-default.yaml
6.3.2.4. Creating a network policy to allow traffic from external clients
With the deny-by-default policy in place you can proceed to configure a policy that allows traffic from external clients to a pod with the label app=web.
If you log in with a user with the cluster-admin role, then you can create a network policy in any namespace in the cluster.
Follow this procedure to configure a policy that allows external service from the public Internet directly or by using a Load Balancer to access the pod. Traffic is only allowed to a pod with the label app=web.
Prerequisites
-
Your cluster uses a network plugin that supports
NetworkPolicyobjects, such as the OVN-Kubernetes network plugin or the OpenShift SDN network plugin withmode: NetworkPolicyset. This mode is the default for OpenShift SDN. -
You installed the OpenShift CLI (
oc). -
You logged in to the cluster with a user with
adminprivileges. - You are working in the namespace that the network policy applies to.
Procedure
Create a policy that allows traffic from the public Internet directly or by using a load balancer to access the pod. Save the YAML in the
web-allow-external.yamlfile:kind: NetworkPolicy apiVersion: networking.k8s.io/v1 spec: policyTypes: - Ingress podSelector: matchLabels: app: web ingress: - {}Apply the policy by entering the following command. Successful output lists the name of the policy object and the
createdstatus.$ oc apply -f web-allow-external.yamlThis policy allows traffic from all resources, including external traffic as illustrated in the following diagram:
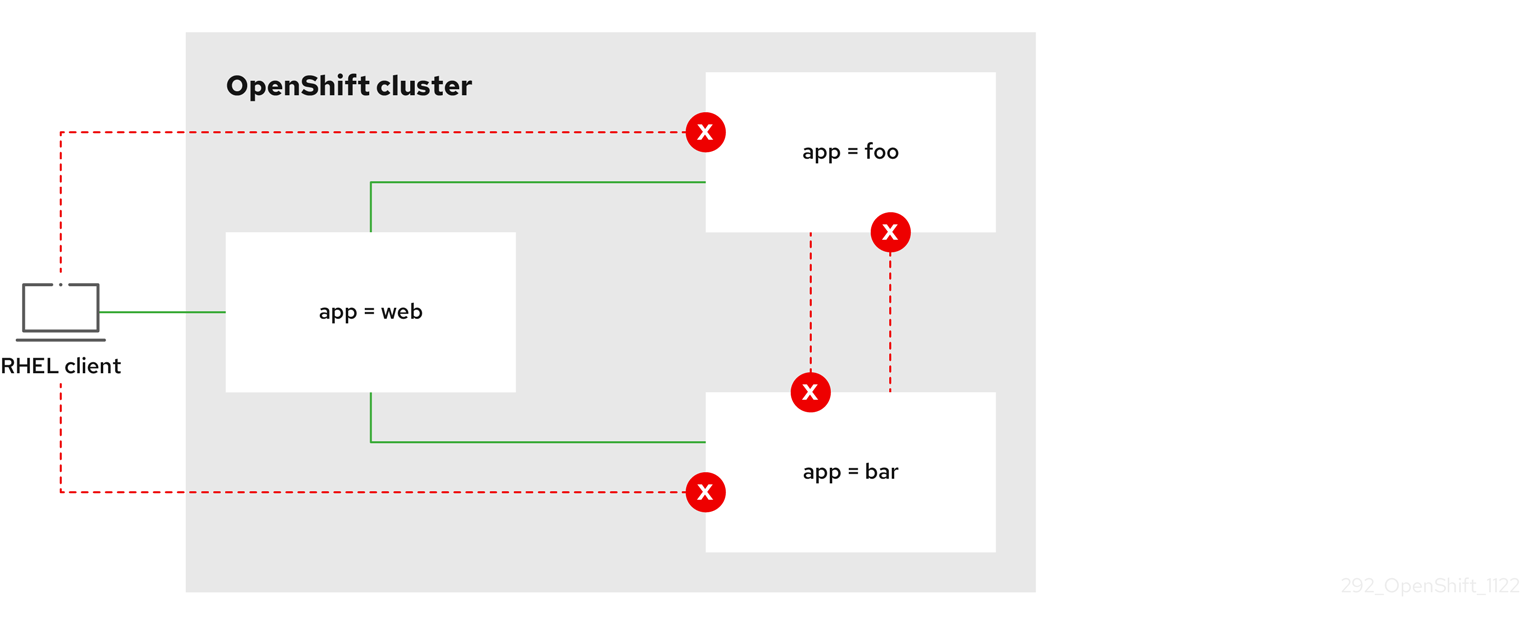
6.3.2.5. Creating a network policy allowing traffic to an application from all namespaces
You can configure a policy that allows traffic from all pods in all namespaces to a particular application.
If you log in with a user with the cluster-admin role, then you can create a network policy in any namespace in the cluster.
Prerequisites
-
Your cluster uses a network plugin that supports
NetworkPolicyobjects, such as the OVN-Kubernetes network plugin or the OpenShift SDN network plugin withmode: NetworkPolicyset. This mode is the default for OpenShift SDN. -
You installed the OpenShift CLI (
oc). -
You logged in to the cluster with a user with
adminprivileges. - You are working in the namespace that the network policy applies to.
Procedure
Create a policy that allows traffic from all pods in all namespaces to a particular application. Save the YAML in the
web-allow-all-namespaces.yamlfile:apiVersion: networking.k8s.io/v1 kind: NetworkPolicy metadata: name: web-allow-all-namespaces namespace: default spec: podSelector: matchLabels: app: web policyTypes: - Ingress ingress: - from: - namespaceSelector: {}where:
app-
Applies the policy only to
app:webpods in default namespace. namespaceSelectorSelects all pods in all namespaces.
NoteBy default, if you do not specify a
namespaceSelectorparameter in the policy object, no namespaces get selected. This means the policy allows traffic only from the namespace where the network policy deployes.
Apply the policy by entering the following command. Successful output lists the name of the policy object and the
createdstatus.$ oc apply -f web-allow-all-namespaces.yaml
Verification
Start a web service in the
defaultnamespace by entering the following command:$ oc run web --namespace=default --image=nginx --labels="app=web" --expose --port=80Run the following command to deploy an
alpineimage in thesecondarynamespace and to start a shell:$ oc run test-$RANDOM --namespace=secondary --rm -i -t --image=alpine -- shRun the following command in the shell and observe that the service allows the request:
# wget -qO- --timeout=2 http://web.default<!DOCTYPE html> <html> <head> <title>Welcome to nginx!</title> <style> html { color-scheme: light dark; } body { width: 35em; margin: 0 auto; font-family: Tahoma, Verdana, Arial, sans-serif; } </style> </head> <body> <h1>Welcome to nginx!</h1> <p>If you see this page, the nginx web server is successfully installed and working. Further configuration is required.</p> <p>For online documentation and support please refer to <a href="http://nginx.org/">nginx.org</a>.<br/> Commercial support is available at <a href="http://nginx.com/">nginx.com</a>.</p> <p><em>Thank you for using nginx.</em></p> </body> </html>
6.3.2.6. Creating a network policy allowing traffic to an application from a namespace
You can configure a policy that allows traffic to a pod with the label app=web from a particular namespace. This configuration is useful in the following use cases:
- Restrict traffic to a production database only to namespaces that have production workloads deployed.
- Enable monitoring tools deployed to a particular namespace to scrape metrics from the current namespace.
If you log in with a user with the cluster-admin role, then you can create a network policy in any namespace in the cluster.
Prerequisites
-
Your cluster uses a network plugin that supports
NetworkPolicyobjects, such as the OVN-Kubernetes network plugin or the OpenShift SDN network plugin withmode: NetworkPolicyset. This mode is the default for OpenShift SDN. -
You installed the OpenShift CLI (
oc). -
You logged in to the cluster with a user with
adminprivileges. - You are working in the namespace that the network policy applies to.
Procedure
Create a policy that allows traffic from all pods in a particular namespaces with a label
purpose=production. Save the YAML in theweb-allow-prod.yamlfile:kind: NetworkPolicy apiVersion: networking.k8s.io/v1 metadata: name: web-allow-prod namespace: default spec: podSelector: matchLabels: app: web policyTypes: - Ingress ingress: - from: - namespaceSelector: matchLabels: purpose: productionwhere:
app-
Applies the policy only to
app:webpods in the default namespace. purpose-
Restricts traffic to only pods in namespaces that have the label
purpose=production.
Apply the policy by entering the following command. Successful output lists the name of the policy object and the
createdstatus.$ oc apply -f web-allow-prod.yaml
Verification
Start a web service in the
defaultnamespace by entering the following command:$ oc run web --namespace=default --image=nginx --labels="app=web" --expose --port=80Run the following command to create the
prodnamespace:$ oc create namespace prodRun the following command to label the
prodnamespace:$ oc label namespace/prod purpose=productionRun the following command to create the
devnamespace:$ oc create namespace devRun the following command to label the
devnamespace:$ oc label namespace/dev purpose=testingRun the following command to deploy an
alpineimage in thedevnamespace and to start a shell:$ oc run test-$RANDOM --namespace=dev --rm -i -t --image=alpine -- shRun the following command in the shell and observe the reason for the blocked request. For example, expected output states
wget: download timed out.# wget -qO- --timeout=2 http://web.defaultRun the following command to deploy an
alpineimage in theprodnamespace and start a shell:$ oc run test-$RANDOM --namespace=prod --rm -i -t --image=alpine -- shRun the following command in the shell and observe that the request is allowed:
# wget -qO- --timeout=2 http://web.default<!DOCTYPE html> <html> <head> <title>Welcome to nginx!</title> <style> html { color-scheme: light dark; } body { width: 35em; margin: 0 auto; font-family: Tahoma, Verdana, Arial, sans-serif; } </style> </head> <body> <h1>Welcome to nginx!</h1> <p>If you see this page, the nginx web server is successfully installed and working. Further configuration is required.</p> <p>For online documentation and support please refer to <a href="http://nginx.org/">nginx.org</a>.<br/> Commercial support is available at <a href="http://nginx.com/">nginx.com</a>.</p> <p><em>Thank you for using nginx.</em></p> </body> </html>
6.3.3. Viewing a network policy
As a cluster administrator, you can view a network policy for a namespace.
6.3.3.1. Example NetworkPolicy object
The following configuration annotates an example NetworkPolicy object:
kind: NetworkPolicy
apiVersion: networking.k8s.io/v1
metadata:
name: allow-27107
spec:
podSelector:
matchLabels:
app: mongodb
ingress:
- from:
- podSelector:
matchLabels:
app: app
ports:
- protocol: TCP
port: 27017where:
name- The name of the NetworkPolicy object.
spec.podSelector- A selector that describes the pods to which the policy applies. The policy object can only select pods in the project that defines the NetworkPolicy object.
ingress.from.podSelector- A selector that matches the pods from which the policy object allows ingress traffic. The selector matches pods in the same namespace as the NetworkPolicy.
ingress.ports- A list of one or more destination ports on which to accept traffic.
6.3.3.2. Viewing network policies using the CLI
You can examine the network policies in a namespace.
If you log in with cluster-admin privileges, you can edit network policies in any namespace in the cluster.
If you log in with cluster-admin privileges, you can edit network policies in any namespace in the cluster. In the web console, you can edit policies directly in YAML or by using the Actions menu.
Prerequisites
-
You installed the OpenShift CLI (
oc). -
You are logged in to the cluster with a user with
adminprivileges. - You are working in the namespace where the network policy exists.
Procedure
List network policies in a namespace.
To view network policy objects defined in a namespace enter the following command:
$ oc get networkpolicyOptional: To examine a specific network policy enter the following command:
$ oc describe networkpolicy <policy_name> -n <namespace>where:
<policy_name>- Specifies the name of the network policy to inspect.
<namespace>Optional: Specifies the namespace if the object is defined in a different namespace than the current namespace.
$ oc describe networkpolicy allow-same-namespaceName: allow-same-namespace Namespace: ns1 Created on: 2021-05-24 22:28:56 -0400 EDT Labels: <none> Annotations: <none> Spec: PodSelector: <none> (Allowing the specific traffic to all pods in this namespace) Allowing ingress traffic: To Port: <any> (traffic allowed to all ports) From: PodSelector: <none> Not affecting egress traffic Policy Types: Ingress
6.3.4. Editing a network policy
As a cluster administrator, you can edit an existing network policy for a namespace.
6.3.4.1. Editing a network policy
To modify existing policy configurations, you can edit a network policy in a namespace. Edit policies by modifying the policy file and applying it with oc apply, or by using the oc edit command directly.
If you log in with cluster-admin privileges, you can edit network policies in any namespace in the cluster.
If you log in with cluster-admin privileges, you can edit network policies in any namespace in the cluster. In the web console, you can edit policies directly in YAML or by using the Actions menu.
Prerequisites
-
Your cluster uses a network plugin that supports
NetworkPolicyobjects, such as the OVN-Kubernetes network plugin or the OpenShift SDN network plugin withmode: NetworkPolicyset. This mode is the default for OpenShift SDN. -
You installed the OpenShift CLI (
oc). -
You are logged in to the cluster with a user with
adminprivileges. - You are working in the namespace where the network policy exists.
Procedure
Optional: To list the network policy objects in a namespace, enter the following command:
$ oc get network policy -n <namespace>where:
<namespace>- Optional: Specifies the namespace if the object is defined in a different namespace than the current namespace.
Edit the network policy object.
If you saved the network policy definition in a file, edit the file and make any necessary changes, and then enter the following command.
$ oc apply -n <namespace> -f <policy_file>.yamlwhere:
<namespace>- Optional: Specifies the namespace if the object is defined in a different namespace than the current namespace.
<policy_file>- Specifies the name of the file containing the network policy.
If you need to update the network policy object directly, enter the following command:
$ oc edit network policy <policy_name> -n <namespace>where:
<policy_name>- Specifies the name of the network policy.
<namespace>- Optional: Specifies the namespace if the object is defined in a different namespace than the current namespace.
Confirm that the network policy object is updated.
$ oc describe networkpolicy <policy_name> -n <namespace>where:
<policy_name>- Specifies the name of the network policy.
<namespace>- Optional: Specifies the namespace if the object is defined in a different namespace than the current namespace.
6.3.4.2. Example NetworkPolicy object
The following configuration annotates an example NetworkPolicy object:
kind: NetworkPolicy
apiVersion: networking.k8s.io/v1
metadata:
name: allow-27107
spec:
podSelector:
matchLabels:
app: mongodb
ingress:
- from:
- podSelector:
matchLabels:
app: app
ports:
- protocol: TCP
port: 27017where:
name- The name of the NetworkPolicy object.
spec.podSelector- A selector that describes the pods to which the policy applies. The policy object can only select pods in the project that defines the NetworkPolicy object.
ingress.from.podSelector- A selector that matches the pods from which the policy object allows ingress traffic. The selector matches pods in the same namespace as the NetworkPolicy.
ingress.ports- A list of one or more destination ports on which to accept traffic.
6.3.5. Deleting a network policy
As a cluster administrator, you can delete a network policy from a namespace.
6.3.5.1. Deleting a network policy using the CLI
You can delete a network policy in a namespace.
If you log in with cluster-admin privileges, you can delete network policies in any namespace in the cluster.
If you log in with cluster-admin privileges, you can delete network policies in any namespace in the cluster. In the web console, you can delete policies directly in YAML or by using the Actions menu.
Prerequisites
-
Your cluster uses a network plugin that supports
NetworkPolicyobjects, such as the OVN-Kubernetes network plugin or the OpenShift SDN network plugin withmode: NetworkPolicyset. This mode is the default for OpenShift SDN. -
You installed the OpenShift CLI (
oc). -
You logged in to the cluster with a user with
adminprivileges. - You are working in the namespace where the network policy exists.
Procedure
To delete a network policy object, enter the following command. Successful output lists the name of the policy object and the
deletedstatus.$ oc delete networkpolicy <policy_name> -n <namespace>where:
<policy_name>- Specifies the name of the network policy.
<namespace>- Optional parameter. If you defined the object in a different namespace than the current namespace, the parameter specifices the namespace.
6.3.6. Defining a default network policy for projects
As a cluster administrator, you can modify the new project template to automatically include network policies when you create a new project. If you do not yet have a customized template for new projects, you must first create one.
6.3.6.1. Modifying the template for new projects
As a cluster administrator, you can modify the default project template so that new projects are created using your custom requirements.
To create your own custom project template:
Prerequisites
-
You have access to an OpenShift Container Platform cluster using an account with
cluster-adminpermissions.
Procedure
-
Log in as a user with
cluster-adminprivileges. Generate the default project template:
$ oc adm create-bootstrap-project-template -o yaml > template.yaml-
Use a text editor to modify the generated
template.yamlfile by adding objects or modifying existing objects. The project template must be created in the
openshift-confignamespace. Load your modified template:$ oc create -f template.yaml -n openshift-configEdit the project configuration resource using the web console or CLI.
Using the web console:
- Navigate to the Administration → Cluster Settings page.
- Click Configuration to view all configuration resources.
- Find the entry for Project and click Edit YAML.
Using the CLI:
Edit the
project.config.openshift.io/clusterresource:$ oc edit project.config.openshift.io/cluster
Update the
specsection to include theprojectRequestTemplateandnameparameters, and set the name of your uploaded project template. The default name isproject-request.Project configuration resource with custom project template
apiVersion: config.openshift.io/v1 kind: Project metadata: # ... spec: projectRequestTemplate: name: <template_name> # ...- After you save your changes, create a new project to verify that your changes were successfully applied.
6.3.6.2. Adding network policies to the new project template
As a cluster administrator, you can add network policies to the default template for new projects. OpenShift Container Platform will automatically create all the NetworkPolicy objects specified in the template in the project.
Prerequisites
-
Your cluster uses a default CNI network plugin that supports
NetworkPolicyobjects, such as the OpenShift SDN network plugin withmode: NetworkPolicyset. This mode is the default for OpenShift SDN. -
You installed the OpenShift CLI (
oc). -
You must log in to the cluster with a user with
cluster-adminprivileges. - You must have created a custom default project template for new projects.
Procedure
Edit the default template for a new project by running the following command:
$ oc edit template <project_template> -n openshift-configReplace
<project_template>with the name of the default template that you configured for your cluster. The default template name isproject-request.In the template, add each
NetworkPolicyobject as an element to theobjectsparameter. Theobjectsparameter accepts a collection of one or more objects.In the following example, the
objectsparameter collection includes severalNetworkPolicyobjects.objects: - apiVersion: networking.k8s.io/v1 kind: NetworkPolicy metadata: name: allow-from-same-namespace spec: podSelector: {} ingress: - from: - podSelector: {} - apiVersion: networking.k8s.io/v1 kind: NetworkPolicy metadata: name: allow-from-openshift-ingress spec: ingress: - from: - namespaceSelector: matchLabels: policy-group.network.openshift.io/ingress: podSelector: {} policyTypes: - Ingress - apiVersion: networking.k8s.io/v1 kind: NetworkPolicy metadata: name: allow-from-kube-apiserver-operator spec: ingress: - from: - namespaceSelector: matchLabels: kubernetes.io/metadata.name: openshift-kube-apiserver-operator podSelector: matchLabels: app: kube-apiserver-operator policyTypes: - Ingress ...Optional: Create a new project and confirm the successful creation of your network policy objects.
Create a new project:
$ oc new-project <project>1 - 1
- Replace
<project>with the name for the project you are creating.
Confirm that the network policy objects in the new project template exist in the new project:
$ oc get networkpolicyExpected output:
NAME POD-SELECTOR AGE allow-from-openshift-ingress <none> 7s allow-from-same-namespace <none> 7s
6.3.7. Configuring multitenant isolation with network policy
As a cluster administrator, you can configure your network policies to provide multitenant network isolation.
If you are using the OpenShift SDN network plugin, configuring network policies as described in this section provides network isolation similar to multitenant mode but with network policy mode set.
6.3.7.1. Configuring multitenant isolation by using network policy
You can configure your project to isolate it from pods and services in other project namespaces.
Prerequisites
-
Your cluster uses a network plugin that supports
NetworkPolicyobjects, such as the OVN-Kubernetes network plugin or the OpenShift SDN network plugin withmode: NetworkPolicyset. This mode is the default for OpenShift SDN. -
You installed the OpenShift CLI (
oc). -
You are logged in to the cluster with a user with
adminprivileges.
Procedure
Create the following
NetworkPolicyobjects:A policy named
allow-from-openshift-ingress.$ cat << EOF| oc create -f - apiVersion: networking.k8s.io/v1 kind: NetworkPolicy metadata: name: allow-from-openshift-ingress spec: ingress: - from: - namespaceSelector: matchLabels: policy-group.network.openshift.io/ingress: "" podSelector: {} policyTypes: - Ingress EOFNotepolicy-group.network.openshift.io/ingress: ""is the preferred namespace selector label for OpenShift SDN. You can use thenetwork.openshift.io/policy-group: ingressnamespace selector label, but this is a legacy label.A policy named
allow-from-openshift-monitoring:$ cat << EOF| oc create -f - apiVersion: networking.k8s.io/v1 kind: NetworkPolicy metadata: name: allow-from-openshift-monitoring spec: ingress: - from: - namespaceSelector: matchLabels: network.openshift.io/policy-group: monitoring podSelector: {} policyTypes: - Ingress EOFA policy named
allow-same-namespace:$ cat << EOF| oc create -f - kind: NetworkPolicy apiVersion: networking.k8s.io/v1 metadata: name: allow-same-namespace spec: podSelector: ingress: - from: - podSelector: {} EOFA policy named
allow-from-kube-apiserver-operator:$ cat << EOF| oc create -f - apiVersion: networking.k8s.io/v1 kind: NetworkPolicy metadata: name: allow-from-kube-apiserver-operator spec: ingress: - from: - namespaceSelector: matchLabels: kubernetes.io/metadata.name: openshift-kube-apiserver-operator podSelector: matchLabels: app: kube-apiserver-operator policyTypes: - Ingress EOFFor more details, see New
kube-apiserver-operatorwebhook controller validating health of webhook.
Optional: To confirm that the network policies exist in your current project, enter the following command:
$ oc describe networkpolicyExample output
Name: allow-from-openshift-ingress Namespace: example1 Created on: 2020-06-09 00:28:17 -0400 EDT Labels: <none> Annotations: <none> Spec: PodSelector: <none> (Allowing the specific traffic to all pods in this namespace) Allowing ingress traffic: To Port: <any> (traffic allowed to all ports) From: NamespaceSelector: policy-group.network.openshift.io/ingress: Not affecting egress traffic Policy Types: Ingress Name: allow-from-openshift-monitoring Namespace: example1 Created on: 2020-06-09 00:29:57 -0400 EDT Labels: <none> Annotations: <none> Spec: PodSelector: <none> (Allowing the specific traffic to all pods in this namespace) Allowing ingress traffic: To Port: <any> (traffic allowed to all ports) From: NamespaceSelector: network.openshift.io/policy-group: monitoring Not affecting egress traffic Policy Types: Ingress
6.3.7.2. Next steps
6.4. Audit logging for network security
The OVN-Kubernetes network plugin uses Open Virtual Network (OVN) access control lists (ACLs) to manage AdminNetworkPolicy, BaselineAdminNetworkPolicy, NetworkPolicy, and EgressFirewall objects. Audit logging exposes allow and deny ACL events for NetworkPolicy, EgressFirewall and BaselineAdminNetworkPolicy custom resources (CR). Logging also exposes allow, deny, and pass ACL events for AdminNetworkPolicy (ANP) CR.
Audit logging is available for only the OVN-Kubernetes network plugin.
6.4.1. Audit configuration
The configuration for audit logging is specified as part of the OVN-Kubernetes cluster network provider configuration. The following YAML illustrates the default values for the audit logging:
Audit logging configuration
apiVersion: operator.openshift.io/v1
kind: Network
metadata:
name: cluster
spec:
defaultNetwork:
ovnKubernetesConfig:
policyAuditConfig:
destination: "null"
maxFileSize: 50
rateLimit: 20
syslogFacility: local0The following table describes the configuration fields for audit logging.
| Field | Type | Description |
|---|---|---|
|
| integer |
The maximum number of messages to generate every second per node. The default value is |
|
| integer |
The maximum size for the audit log in bytes. The default value is |
|
| integer | The maximum number of log files that are retained. |
|
| string | One of the following additional audit log targets:
|
|
| string |
The syslog facility, such as |
6.4.2. Audit logging
You can configure the destination for audit logs, such as a syslog server or a UNIX domain socket. Regardless of any additional configuration, an audit log is always saved to /var/log/ovn/acl-audit-log.log on each OVN-Kubernetes pod in the cluster.
You can enable audit logging for each namespace by annotating each namespace configuration with a k8s.ovn.org/acl-logging section. In the k8s.ovn.org/acl-logging section, you must specify allow, deny, or both values to enable audit logging for a namespace.
A network policy does not support setting the Pass action set as a rule.
The ACL-logging implementation logs access control list (ACL) events for a network. You can view these logs to analyze any potential security issues.
Example namespace annotation
kind: Namespace
apiVersion: v1
metadata:
name: example1
annotations:
k8s.ovn.org/acl-logging: |-
{
"deny": "info",
"allow": "info"
}
To view the default ACL logging configuration values, see the policyAuditConfig object in the cluster-network-03-config.yml file. If required, you can change the ACL logging configuration values for log file parameters in this file.
The logging message format is compatible with syslog as defined by RFC5424. The syslog facility is configurable and defaults to local0. The following example shows key parameters and their values outputted in a log message:
Example logging message that outputs parameters and their values
<timestamp>|<message_serial>|acl_log(ovn_pinctrl0)|<severity>|name="<acl_name>", verdict="<verdict>", severity="<severity>", direction="<direction>": <flow>Where:
-
<timestamp>states the time and date for the creation of a log message. -
<message_serial>lists the serial number for a log message. -
acl_log(ovn_pinctrl0)is a literal string that prints the location of the log message in the OVN-Kubernetes plugin. -
<severity>sets the severity level for a log message. If you enable audit logging that supportsallowanddenytasks then two severity levels show in the log message output. -
<name>states the name of the ACL-logging implementation in the OVN Network Bridging Database (nbdb) that was created by the network policy. -
<verdict>can be eitherallowordrop. -
<direction>can be eitherto-lportorfrom-lportto indicate that the policy was applied to traffic going to or away from a pod. -
<flow>shows packet information in a format equivalent to theOpenFlowprotocol. This parameter comprises Open vSwitch (OVS) fields.
The following example shows OVS fields that the flow parameter uses to extract packet information from system memory:
Example of OVS fields used by the flow parameter to extract packet information
<proto>,vlan_tci=0x0000,dl_src=<src_mac>,dl_dst=<source_mac>,nw_src=<source_ip>,nw_dst=<target_ip>,nw_tos=<tos_dscp>,nw_ecn=<tos_ecn>,nw_ttl=<ip_ttl>,nw_frag=<fragment>,tp_src=<tcp_src_port>,tp_dst=<tcp_dst_port>,tcp_flags=<tcp_flags>Where:
-
<proto>states the protocol. Valid values aretcpandudp. -
vlan_tci=0x0000states the VLAN header as0because a VLAN ID is not set for internal pod network traffic. -
<src_mac>specifies the source for the Media Access Control (MAC) address. -
<source_mac>specifies the destination for the MAC address. -
<source_ip>lists the source IP address -
<target_ip>lists the target IP address. -
<tos_dscp>states Differentiated Services Code Point (DSCP) values to classify and prioritize certain network traffic over other traffic. -
<tos_ecn>states Explicit Congestion Notification (ECN) values that indicate any congested traffic in your network. -
<ip_ttl>states the Time To Live (TTP) information for an packet. -
<fragment>specifies what type of IP fragments or IP non-fragments to match. -
<tcp_src_port>shows the source for the port for TCP and UDP protocols. -
<tcp_dst_port>lists the destination port for TCP and UDP protocols. -
<tcp_flags>supports numerous flags such asSYN,ACK,PSHand so on. If you need to set multiple values then each value is separated by a vertical bar (|). The UDP protocol does not support this parameter.
For more information about the previous field descriptions, go to the OVS manual page for ovs-fields.
Example ACL deny log entry for a network policy
2023-11-02T16:28:54.139Z|00004|acl_log(ovn_pinctrl0)|INFO|name="NP:verify-audit-logging:Ingress", verdict=drop, severity=alert, direction=to-lport: tcp,vlan_tci=0x0000,dl_src=0a:58:0a:81:02:01,dl_dst=0a:58:0a:81:02:23,nw_src=10.131.0.39,nw_dst=10.129.2.35,nw_tos=0,nw_ecn=0,nw_ttl=62,nw_frag=no,tp_src=58496,tp_dst=8080,tcp_flags=syn
2023-11-02T16:28:55.187Z|00005|acl_log(ovn_pinctrl0)|INFO|name="NP:verify-audit-logging:Ingress", verdict=drop, severity=alert, direction=to-lport: tcp,vlan_tci=0x0000,dl_src=0a:58:0a:81:02:01,dl_dst=0a:58:0a:81:02:23,nw_src=10.131.0.39,nw_dst=10.129.2.35,nw_tos=0,nw_ecn=0,nw_ttl=62,nw_frag=no,tp_src=58496,tp_dst=8080,tcp_flags=syn
2023-11-02T16:28:57.235Z|00006|acl_log(ovn_pinctrl0)|INFO|name="NP:verify-audit-logging:Ingress", verdict=drop, severity=alert, direction=to-lport: tcp,vlan_tci=0x0000,dl_src=0a:58:0a:81:02:01,dl_dst=0a:58:0a:81:02:23,nw_src=10.131.0.39,nw_dst=10.129.2.35,nw_tos=0,nw_ecn=0,nw_ttl=62,nw_frag=no,tp_src=58496,tp_dst=8080,tcp_flags=synThe following table describes namespace annotation values:
| Field | Description |
|---|---|
|
|
Blocks namespace access to any traffic that matches an ACL rule with the |
|
|
Permits namespace access to any traffic that matches an ACL rule with the |
|
|
A |
6.4.3. AdminNetworkPolicy audit logging
Audit logging is enabled per AdminNetworkPolicy CR by annotating an ANP policy with the k8s.ovn.org/acl-logging key such as in the following example:
Example 6.19. Example of annotation for AdminNetworkPolicy CR
apiVersion: policy.networking.k8s.io/v1alpha1
kind: AdminNetworkPolicy
metadata:
annotations:
k8s.ovn.org/acl-logging: '{ "deny": "alert", "allow": "alert", "pass" : "warning" }'
name: anp-tenant-log
spec:
priority: 5
subject:
namespaces:
matchLabels:
tenant: backend-storage # Selects all pods owned by storage tenant.
ingress:
- name: "allow-all-ingress-product-development-and-customer" # Product development and customer tenant ingress to backend storage.
action: "Allow"
from:
- pods:
namespaceSelector:
matchExpressions:
- key: tenant
operator: In
values:
- product-development
- customer
podSelector: {}
- name: "pass-all-ingress-product-security"
action: "Pass"
from:
- namespaces:
matchLabels:
tenant: product-security
- name: "deny-all-ingress" # Ingress to backend from all other pods in the cluster.
action: "Deny"
from:
- namespaces: {}
egress:
- name: "allow-all-egress-product-development"
action: "Allow"
to:
- pods:
namespaceSelector:
matchLabels:
tenant: product-development
podSelector: {}
- name: "pass-egress-product-security"
action: "Pass"
to:
- namespaces:
matchLabels:
tenant: product-security
- name: "deny-all-egress" # Egress from backend denied to all other pods.
action: "Deny"
to:
- namespaces: {}
Logs are generated whenever a specific OVN ACL is hit and meets the action criteria set in your logging annotation. For example, an event in which any of the namespaces with the label tenant: product-development accesses the namespaces with the label tenant: backend-storage, a log is generated.
ACL logging is limited to 60 characters. If your ANP name field is long, the rest of the log will be truncated.
The following is a direction index for the examples log entries that follow:
| Direction | Rule |
|---|---|
| Ingress |
|
| Egress |
|
Example 6.20. Example ACL log entry for Allow action of the AdminNetworkPolicy named anp-tenant-log with Ingress:0 and Egress:0
2024-06-10T16:27:45.194Z|00052|acl_log(ovn_pinctrl0)|INFO|name="ANP:anp-tenant-log:Ingress:0", verdict=allow, severity=alert, direction=to-lport: tcp,vlan_tci=0x0000,dl_src=0a:58:0a:80:02:1a,dl_dst=0a:58:0a:80:02:19,nw_src=10.128.2.26,nw_dst=10.128.2.25,nw_tos=0,nw_ecn=0,nw_ttl=64,nw_frag=no,tp_src=57814,tp_dst=8080,tcp_flags=syn
2024-06-10T16:28:23.130Z|00059|acl_log(ovn_pinctrl0)|INFO|name="ANP:anp-tenant-log:Ingress:0", verdict=allow, severity=alert, direction=to-lport: tcp,vlan_tci=0x0000,dl_src=0a:58:0a:80:02:18,dl_dst=0a:58:0a:80:02:19,nw_src=10.128.2.24,nw_dst=10.128.2.25,nw_tos=0,nw_ecn=0,nw_ttl=64,nw_frag=no,tp_src=38620,tp_dst=8080,tcp_flags=ack
2024-06-10T16:28:38.293Z|00069|acl_log(ovn_pinctrl0)|INFO|name="ANP:anp-tenant-log:Egress:0", verdict=allow, severity=alert, direction=from-lport: tcp,vlan_tci=0x0000,dl_src=0a:58:0a:80:02:19,dl_dst=0a:58:0a:80:02:1a,nw_src=10.128.2.25,nw_dst=10.128.2.26,nw_tos=0,nw_ecn=0,nw_ttl=64,nw_frag=no,tp_src=47566,tp_dst=8080,tcp_flags=fin|ack=0,nw_ecn=0,nw_ttl=64,nw_frag=no,tp_src=55704,tp_dst=8080,tcp_flags=ackExample 6.21. Example ACL log entry for Pass action of the AdminNetworkPolicy named anp-tenant-log with Ingress:1 and Egress:1
2024-06-10T16:33:12.019Z|00075|acl_log(ovn_pinctrl0)|INFO|name="ANP:anp-tenant-log:Ingress:1", verdict=pass, severity=warning, direction=to-lport: tcp,vlan_tci=0x0000,dl_src=0a:58:0a:80:02:1b,dl_dst=0a:58:0a:80:02:19,nw_src=10.128.2.27,nw_dst=10.128.2.25,nw_tos=0,nw_ecn=0,nw_ttl=64,nw_frag=no,tp_src=37394,tp_dst=8080,tcp_flags=ack
2024-06-10T16:35:04.209Z|00081|acl_log(ovn_pinctrl0)|INFO|name="ANP:anp-tenant-log:Egress:1", verdict=pass, severity=warning, direction=from-lport: tcp,vlan_tci=0x0000,dl_src=0a:58:0a:80:02:19,dl_dst=0a:58:0a:80:02:1b,nw_src=10.128.2.25,nw_dst=10.128.2.27,nw_tos=0,nw_ecn=0,nw_ttl=64,nw_frag=no,tp_src=34018,tp_dst=8080,tcp_flags=ackExample 6.22. Example ACL log entry for Deny action of the AdminNetworkPolicy named anp-tenant-log with Egress:2 and Ingress2
2024-06-10T16:43:05.287Z|00087|acl_log(ovn_pinctrl0)|INFO|name="ANP:anp-tenant-log:Egress:2", verdict=drop, severity=alert, direction=from-lport: tcp,vlan_tci=0x0000,dl_src=0a:58:0a:80:02:19,dl_dst=0a:58:0a:80:02:18,nw_src=10.128.2.25,nw_dst=10.128.2.24,nw_tos=0,nw_ecn=0,nw_ttl=64,nw_frag=no,tp_src=51598,tp_dst=8080,tcp_flags=syn
2024-06-10T16:44:43.591Z|00090|acl_log(ovn_pinctrl0)|INFO|name="ANP:anp-tenant-log:Ingress:2", verdict=drop, severity=alert, direction=to-lport: tcp,vlan_tci=0x0000,dl_src=0a:58:0a:80:02:1c,dl_dst=0a:58:0a:80:02:19,nw_src=10.128.2.28,nw_dst=10.128.2.25,nw_tos=0,nw_ecn=0,nw_ttl=64,nw_frag=no,tp_src=33774,tp_dst=8080,tcp_flags=synThe following table describes ANP annotation:
| Annotation | Value |
|---|---|
|
|
You must specify at least one of
|
6.4.4. BaselineAdminNetworkPolicy audit logging
Audit logging is enabled in the BaselineAdminNetworkPolicy CR by annotating an BANP policy with the k8s.ovn.org/acl-logging key such as in the following example:
Example 6.23. Example of annotation for BaselineAdminNetworkPolicy CR
apiVersion: policy.networking.k8s.io/v1alpha1
kind: BaselineAdminNetworkPolicy
metadata:
annotations:
k8s.ovn.org/acl-logging: '{ "deny": "alert", "allow": "alert"}'
name: default
spec:
subject:
namespaces:
matchLabels:
tenant: workloads # Selects all workload pods in the cluster.
ingress:
- name: "default-allow-dns" # This rule allows ingress from dns tenant to all workloads.
action: "Allow"
from:
- namespaces:
matchLabels:
tenant: dns
- name: "default-deny-dns" # This rule denies all ingress from all pods to workloads.
action: "Deny"
from:
- namespaces: {} # Use the empty selector with caution because it also selects OpenShift namespaces as well.
egress:
- name: "default-deny-dns" # This rule denies all egress from workloads. It will be applied when no ANP or network policy matches.
action: "Deny"
to:
- namespaces: {} # Use the empty selector with caution because it also selects OpenShift namespaces as well.
In the example, an event in which any of the namespaces with the label tenant: dns accesses the namespaces with the label tenant: workloads, a log is generated.
The following is a direction index for the examples log entries that follow:
| Direction | Rule |
|---|---|
| Ingress |
|
| Egress |
|
Example 6.24. Example ACL allow log entry for Allow action of default BANP with Ingress:0
2024-06-10T18:11:58.263Z|00022|acl_log(ovn_pinctrl0)|INFO|name="BANP:default:Ingress:0", verdict=allow, severity=alert, direction=to-lport: tcp,vlan_tci=0x0000,dl_src=0a:58:0a:82:02:57,dl_dst=0a:58:0a:82:02:56,nw_src=10.130.2.87,nw_dst=10.130.2.86,nw_tos=0,nw_ecn=0,nw_ttl=64,nw_frag=no,tp_src=60510,tp_dst=8080,tcp_flags=syn
2024-06-10T18:11:58.264Z|00023|acl_log(ovn_pinctrl0)|INFO|name="BANP:default:Ingress:0", verdict=allow, severity=alert, direction=to-lport: tcp,vlan_tci=0x0000,dl_src=0a:58:0a:82:02:57,dl_dst=0a:58:0a:82:02:56,nw_src=10.130.2.87,nw_dst=10.130.2.86,nw_tos=0,nw_ecn=0,nw_ttl=64,nw_frag=no,tp_src=60510,tp_dst=8080,tcp_flags=psh|ack
2024-06-10T18:11:58.264Z|00024|acl_log(ovn_pinctrl0)|INFO|name="BANP:default:Ingress:0", verdict=allow, severity=alert, direction=to-lport: tcp,vlan_tci=0x0000,dl_src=0a:58:0a:82:02:57,dl_dst=0a:58:0a:82:02:56,nw_src=10.130.2.87,nw_dst=10.130.2.86,nw_tos=0,nw_ecn=0,nw_ttl=64,nw_frag=no,tp_src=60510,tp_dst=8080,tcp_flags=ack
2024-06-10T18:11:58.264Z|00025|acl_log(ovn_pinctrl0)|INFO|name="BANP:default:Ingress:0", verdict=allow, severity=alert, direction=to-lport: tcp,vlan_tci=0x0000,dl_src=0a:58:0a:82:02:57,dl_dst=0a:58:0a:82:02:56,nw_src=10.130.2.87,nw_dst=10.130.2.86,nw_tos=0,nw_ecn=0,nw_ttl=64,nw_frag=no,tp_src=60510,tp_dst=8080,tcp_flags=ack
2024-06-10T18:11:58.264Z|00026|acl_log(ovn_pinctrl0)|INFO|name="BANP:default:Ingress:0", verdict=allow, severity=alert, direction=to-lport: tcp,vlan_tci=0x0000,dl_src=0a:58:0a:82:02:57,dl_dst=0a:58:0a:82:02:56,nw_src=10.130.2.87,nw_dst=10.130.2.86,nw_tos=0,nw_ecn=0,nw_ttl=64,nw_frag=no,tp_src=60510,tp_dst=8080,tcp_flags=fin|ack
2024-06-10T18:11:58.264Z|00027|acl_log(ovn_pinctrl0)|INFO|name="BANP:default:Ingress:0", verdict=allow, severity=alert, direction=to-lport: tcp,vlan_tci=0x0000,dl_src=0a:58:0a:82:02:57,dl_dst=0a:58:0a:82:02:56,nw_src=10.130.2.87,nw_dst=10.130.2.86,nw_tos=0,nw_ecn=0,nw_ttl=64,nw_frag=no,tp_src=60510,tp_dst=8080,tcp_flags=ackExample 6.25. Example ACL allow log entry for Allow action of default BANP with Egress:0 and Ingress:1
2024-06-10T18:09:57.774Z|00016|acl_log(ovn_pinctrl0)|INFO|name="BANP:default:Egress:0", verdict=drop, severity=alert, direction=from-lport: tcp,vlan_tci=0x0000,dl_src=0a:58:0a:82:02:56,dl_dst=0a:58:0a:82:02:57,nw_src=10.130.2.86,nw_dst=10.130.2.87,nw_tos=0,nw_ecn=0,nw_ttl=64,nw_frag=no,tp_src=45614,tp_dst=8080,tcp_flags=syn
2024-06-10T18:09:58.809Z|00017|acl_log(ovn_pinctrl0)|INFO|name="BANP:default:Egress:0", verdict=drop, severity=alert, direction=from-lport: tcp,vlan_tci=0x0000,dl_src=0a:58:0a:82:02:56,dl_dst=0a:58:0a:82:02:57,nw_src=10.130.2.86,nw_dst=10.130.2.87,nw_tos=0,nw_ecn=0,nw_ttl=64,nw_frag=no,tp_src=45614,tp_dst=8080,tcp_flags=syn
2024-06-10T18:10:00.857Z|00018|acl_log(ovn_pinctrl0)|INFO|name="BANP:default:Egress:0", verdict=drop, severity=alert, direction=from-lport: tcp,vlan_tci=0x0000,dl_src=0a:58:0a:82:02:56,dl_dst=0a:58:0a:82:02:57,nw_src=10.130.2.86,nw_dst=10.130.2.87,nw_tos=0,nw_ecn=0,nw_ttl=64,nw_frag=no,tp_src=45614,tp_dst=8080,tcp_flags=syn
2024-06-10T18:10:25.414Z|00019|acl_log(ovn_pinctrl0)|INFO|name="BANP:default:Ingress:1", verdict=drop, severity=alert, direction=to-lport: tcp,vlan_tci=0x0000,dl_src=0a:58:0a:82:02:58,dl_dst=0a:58:0a:82:02:56,nw_src=10.130.2.88,nw_dst=10.130.2.86,nw_tos=0,nw_ecn=0,nw_ttl=64,nw_frag=no,tp_src=40630,tp_dst=8080,tcp_flags=syn
2024-06-10T18:10:26.457Z|00020|acl_log(ovn_pinctrl0)|INFO|name="BANP:default:Ingress:1", verdict=drop, severity=alert, direction=to-lport: tcp,vlan_tci=0x0000,dl_src=0a:58:0a:82:02:58,dl_dst=0a:58:0a:82:02:56,nw_src=10.130.2.88,nw_dst=10.130.2.86,nw_tos=0,nw_ecn=0,nw_ttl=64,nw_frag=no,tp_src=40630,tp_dst=8080,tcp_flags=syn
2024-06-10T18:10:28.505Z|00021|acl_log(ovn_pinctrl0)|INFO|name="BANP:default:Ingress:1", verdict=drop, severity=alert, direction=to-lport: tcp,vlan_tci=0x0000,dl_src=0a:58:0a:82:02:58,dl_dst=0a:58:0a:82:02:56,nw_src=10.130.2.88,nw_dst=10.130.2.86,nw_tos=0,nw_ecn=0,nw_ttl=64,nw_frag=no,tp_src=40630,tp_dst=8080,tcp_flags=synThe following table describes BANP annotation:
| Annotation | Value |
|---|---|
|
|
You must specify at least one of
|
6.4.5. Configuring egress firewall and network policy auditing for a cluster
As a cluster administrator, you can customize audit logging for your cluster.
Prerequisites
-
Install the OpenShift CLI (
oc). -
Log in to the cluster with a user with
cluster-adminprivileges.
Procedure
To customize the audit logging configuration, enter the following command:
$ oc edit network.operator.openshift.io/clusterTipYou can also customize and apply the following YAML to configure audit logging:
apiVersion: operator.openshift.io/v1 kind: Network metadata: name: cluster spec: defaultNetwork: ovnKubernetesConfig: policyAuditConfig: destination: "null" maxFileSize: 50 rateLimit: 20 syslogFacility: local0
Verification
To create a namespace with network policies complete the following steps:
Create a namespace for verification:
$ cat <<EOF| oc create -f - kind: Namespace apiVersion: v1 metadata: name: verify-audit-logging annotations: k8s.ovn.org/acl-logging: '{ "deny": "alert", "allow": "alert" }' EOFSuccessful output lists the namespace with the network policy and the
createdstatus.Create network policies for the namespace:
$ cat <<EOF| oc create -n verify-audit-logging -f - apiVersion: networking.k8s.io/v1 kind: NetworkPolicy metadata: name: deny-all spec: podSelector: matchLabels: policyTypes: - Ingress - Egress --- apiVersion: networking.k8s.io/v1 kind: NetworkPolicy metadata: name: allow-from-same-namespace namespace: verify-audit-logging spec: podSelector: {} policyTypes: - Ingress - Egress ingress: - from: - podSelector: {} egress: - to: - namespaceSelector: matchLabels: kubernetes.io/metadata.name: verify-audit-logging EOFExample output
networkpolicy.networking.k8s.io/deny-all created networkpolicy.networking.k8s.io/allow-from-same-namespace created
Create a pod for source traffic in the
defaultnamespace:$ cat <<EOF| oc create -n default -f - apiVersion: v1 kind: Pod metadata: name: client spec: containers: - name: client image: registry.access.redhat.com/rhel7/rhel-tools command: ["/bin/sh", "-c"] args: ["sleep inf"] EOFCreate two pods in the
verify-audit-loggingnamespace:$ for name in client server; do cat <<EOF| oc create -n verify-audit-logging -f - apiVersion: v1 kind: Pod metadata: name: ${name} spec: containers: - name: ${name} image: registry.access.redhat.com/rhel7/rhel-tools command: ["/bin/sh", "-c"] args: ["sleep inf"] EOF doneSuccessful output lists the two pods, such as
pod/clientandpod/server, and thecreatedstatus.To generate traffic and produce network policy audit log entries, complete the following steps:
Obtain the IP address for pod named
serverin theverify-audit-loggingnamespace:$ POD_IP=$(oc get pods server -n verify-audit-logging -o jsonpath='{.status.podIP}')Ping the IP address from an earlier command from the pod named
clientin thedefaultnamespace and confirm the all packets are dropped:$ oc exec -it client -n default -- /bin/ping -c 2 $POD_IPExample output
PING 10.128.2.55 (10.128.2.55) 56(84) bytes of data. --- 10.128.2.55 ping statistics --- 2 packets transmitted, 0 received, 100% packet loss, time 2041msFrom the client pod in the
verify-audit-loggingnamespace, ping the IP address stored in thePOD_IP shellenvironment variable and confirm the system allows all packets.$ oc exec -it client -n verify-audit-logging -- /bin/ping -c 2 $POD_IPExample output
PING 10.128.0.86 (10.128.0.86) 56(84) bytes of data. 64 bytes from 10.128.0.86: icmp_seq=1 ttl=64 time=2.21 ms 64 bytes from 10.128.0.86: icmp_seq=2 ttl=64 time=0.440 ms --- 10.128.0.86 ping statistics --- 2 packets transmitted, 2 received, 0% packet loss, time 1001ms rtt min/avg/max/mdev = 0.440/1.329/2.219/0.890 ms
Display the latest entries in the network policy audit log:
$ for pod in $(oc get pods -n openshift-ovn-kubernetes -l app=ovnkube-node --no-headers=true | awk '{ print $1 }') ; do oc exec -it $pod -n openshift-ovn-kubernetes -- tail -4 /var/log/ovn/acl-audit-log.log doneExample output
2023-11-02T16:28:54.139Z|00004|acl_log(ovn_pinctrl0)|INFO|name="NP:verify-audit-logging:Ingress", verdict=drop, severity=alert, direction=to-lport: tcp,vlan_tci=0x0000,dl_src=0a:58:0a:81:02:01,dl_dst=0a:58:0a:81:02:23,nw_src=10.131.0.39,nw_dst=10.129.2.35,nw_tos=0,nw_ecn=0,nw_ttl=62,nw_frag=no,tp_src=58496,tp_dst=8080,tcp_flags=syn 2023-11-02T16:28:55.187Z|00005|acl_log(ovn_pinctrl0)|INFO|name="NP:verify-audit-logging:Ingress", verdict=drop, severity=alert, direction=to-lport: tcp,vlan_tci=0x0000,dl_src=0a:58:0a:81:02:01,dl_dst=0a:58:0a:81:02:23,nw_src=10.131.0.39,nw_dst=10.129.2.35,nw_tos=0,nw_ecn=0,nw_ttl=62,nw_frag=no,tp_src=58496,tp_dst=8080,tcp_flags=syn 2023-11-02T16:28:57.235Z|00006|acl_log(ovn_pinctrl0)|INFO|name="NP:verify-audit-logging:Ingress", verdict=drop, severity=alert, direction=to-lport: tcp,vlan_tci=0x0000,dl_src=0a:58:0a:81:02:01,dl_dst=0a:58:0a:81:02:23,nw_src=10.131.0.39,nw_dst=10.129.2.35,nw_tos=0,nw_ecn=0,nw_ttl=62,nw_frag=no,tp_src=58496,tp_dst=8080,tcp_flags=syn 2023-11-02T16:49:57.909Z|00028|acl_log(ovn_pinctrl0)|INFO|name="NP:verify-audit-logging:allow-from-same-namespace:Egress:0", verdict=allow, severity=alert, direction=from-lport: icmp,vlan_tci=0x0000,dl_src=0a:58:0a:81:02:22,dl_dst=0a:58:0a:81:02:23,nw_src=10.129.2.34,nw_dst=10.129.2.35,nw_tos=0,nw_ecn=0,nw_ttl=64,nw_frag=no,icmp_type=8,icmp_code=0 2023-11-02T16:49:57.909Z|00029|acl_log(ovn_pinctrl0)|INFO|name="NP:verify-audit-logging:allow-from-same-namespace:Ingress:0", verdict=allow, severity=alert, direction=to-lport: icmp,vlan_tci=0x0000,dl_src=0a:58:0a:81:02:22,dl_dst=0a:58:0a:81:02:23,nw_src=10.129.2.34,nw_dst=10.129.2.35,nw_tos=0,nw_ecn=0,nw_ttl=64,nw_frag=no,icmp_type=8,icmp_code=0 2023-11-02T16:49:58.932Z|00030|acl_log(ovn_pinctrl0)|INFO|name="NP:verify-audit-logging:allow-from-same-namespace:Egress:0", verdict=allow, severity=alert, direction=from-lport: icmp,vlan_tci=0x0000,dl_src=0a:58:0a:81:02:22,dl_dst=0a:58:0a:81:02:23,nw_src=10.129.2.34,nw_dst=10.129.2.35,nw_tos=0,nw_ecn=0,nw_ttl=64,nw_frag=no,icmp_type=8,icmp_code=0 2023-11-02T16:49:58.932Z|00031|acl_log(ovn_pinctrl0)|INFO|name="NP:verify-audit-logging:allow-from-same-namespace:Ingress:0", verdict=allow, severity=alert, direction=to-lport: icmp,vlan_tci=0x0000,dl_src=0a:58:0a:81:02:22,dl_dst=0a:58:0a:81:02:23,nw_src=10.129.2.34,nw_dst=10.129.2.35,nw_tos=0,nw_ecn=0,nw_ttl=64,nw_frag=no,icmp_type=8,icmp_code=0
6.4.6. Enabling egress firewall and network policy audit logging for a namespace
As a cluster administrator, you can enable audit logging for a namespace.
Prerequisites
-
Install the OpenShift CLI (
oc). -
Log in to the cluster with a user with
cluster-adminprivileges.
Procedure
To enable audit logging for a namespace, enter the following command:
$ oc annotate namespace <namespace> \ k8s.ovn.org/acl-logging='{ "deny": "alert", "allow": "notice" }'where:
<namespace>- Specifies the name of the namespace.
TipYou can also apply the following YAML to enable audit logging:
kind: Namespace apiVersion: v1 metadata: name: <namespace> annotations: k8s.ovn.org/acl-logging: |- { "deny": "alert", "allow": "notice" }Successful output lists the audit logging name and the
annotatedstatus.
Verification
Display the latest entries in the audit log:
$ for pod in $(oc get pods -n openshift-ovn-kubernetes -l app=ovnkube-node --no-headers=true | awk '{ print $1 }') ; do oc exec -it $pod -n openshift-ovn-kubernetes -- tail -4 /var/log/ovn/acl-audit-log.log doneExample output
2023-11-02T16:49:57.909Z|00028|acl_log(ovn_pinctrl0)|INFO|name="NP:verify-audit-logging:allow-from-same-namespace:Egress:0", verdict=allow, severity=alert, direction=from-lport: icmp,vlan_tci=0x0000,dl_src=0a:58:0a:81:02:22,dl_dst=0a:58:0a:81:02:23,nw_src=10.129.2.34,nw_dst=10.129.2.35,nw_tos=0,nw_ecn=0,nw_ttl=64,nw_frag=no,icmp_type=8,icmp_code=0 2023-11-02T16:49:57.909Z|00029|acl_log(ovn_pinctrl0)|INFO|name="NP:verify-audit-logging:allow-from-same-namespace:Ingress:0", verdict=allow, severity=alert, direction=to-lport: icmp,vlan_tci=0x0000,dl_src=0a:58:0a:81:02:22,dl_dst=0a:58:0a:81:02:23,nw_src=10.129.2.34,nw_dst=10.129.2.35,nw_tos=0,nw_ecn=0,nw_ttl=64,nw_frag=no,icmp_type=8,icmp_code=0 2023-11-02T16:49:58.932Z|00030|acl_log(ovn_pinctrl0)|INFO|name="NP:verify-audit-logging:allow-from-same-namespace:Egress:0", verdict=allow, severity=alert, direction=from-lport: icmp,vlan_tci=0x0000,dl_src=0a:58:0a:81:02:22,dl_dst=0a:58:0a:81:02:23,nw_src=10.129.2.34,nw_dst=10.129.2.35,nw_tos=0,nw_ecn=0,nw_ttl=64,nw_frag=no,icmp_type=8,icmp_code=0 2023-11-02T16:49:58.932Z|00031|acl_log(ovn_pinctrl0)|INFO|name="NP:verify-audit-logging:allow-from-same-namespace:Ingress:0", verdict=allow, severity=alert, direction=to-lport: icmp,vlan_tci=0x0000,dl_src=0a:58:0a:81:02:22,dl_dst=0a:58:0a:81:02:23,nw_src=10.129.2.34,nw_dst=10.129.2.35,nw_tos=0,nw_ecn=0,nw_ttl=64,nw_frag=no,icmp_type=8,icmp_code=0
6.4.7. Disabling egress firewall and network policy audit logging for a namespace
As a cluster administrator, you can disable audit logging for a namespace.
Prerequisites
-
Install the OpenShift CLI (
oc). -
Log in to the cluster with a user with
cluster-adminprivileges.
Procedure
To disable audit logging for a namespace, enter the following command:
$ oc annotate --overwrite namespace <namespace> k8s.ovn.org/acl-logging-where:
<namespace>- Specifies the name of the namespace.
TipYou can also apply the following YAML to disable audit logging:
kind: Namespace apiVersion: v1 metadata: name: <namespace> annotations: k8s.ovn.org/acl-logging: nullSuccessful output lists the audit logging name and the
annotatedstatus.
6.5. Egress Firewall
6.5.1. Viewing an egress firewall for a project
As a cluster administrator, you can list the names of any existing egress firewalls and view the traffic rules for a specific egress firewall.
OpenShift SDN CNI is deprecated as of OpenShift Container Platform 4.14. As of OpenShift Container Platform 4.15, the network plugin is not an option for new installations. In a subsequent future release, the OpenShift SDN network plugin is planned to be removed and no longer supported. Red Hat will provide bug fixes and support for this feature until it is removed, but this feature will no longer receive enhancements. As an alternative to OpenShift SDN CNI, you can use OVN Kubernetes CNI instead. For more information, see OpenShift SDN CNI removal.
6.5.1.1. Viewing an EgressNetworkPolicy custom resource (CR)
You can view an EgressNetworkPolicy CR in your cluster.
Prerequisites
- A cluster using the OpenShift SDN network plugin.
-
Install the OpenShift Command-line Interface (CLI), commonly known as
oc. - You must log in to the cluster.
Procedure
Optional: To view the names of the
EgressNetworkPolicyCRs defined in your cluster, enter the following command:$ oc get egressnetworkpolicy --all-namespacesTo inspect a policy, enter the following command. Replace
<policy_name>with the name of the policy to inspect.$ oc describe egressnetworkpolicy <policy_name>Example output
Name: default Namespace: project1 Created: 20 minutes ago Labels: <none> Annotations: <none> Rule: Allow to 1.2.3.0/24 Rule: Allow to www.example.com Rule: Deny to 0.0.0.0/0
6.5.1.2. Viewing an EgressFirewall custom resource (CR)
You can view an EgressFirewall CR in your cluster.
Prerequisites
- A cluster using the OVN-Kubernetes network plugin.
-
Install the OpenShift Command-line Interface (CLI), commonly known as
oc. - You must log in to the cluster.
Procedure
Optional: To view the names of the
EgressFirewallCR defined in your cluster, enter the following command:$ oc get egressfirewall --all-namespacesTo inspect a policy, enter the following command. Replace
<policy_name>with the name of the policy to inspect.$ oc describe egressfirewall <policy_name>Example output
Name: default Namespace: project1 Created: 20 minutes ago Labels: <none> Annotations: <none> Rule: Allow to 1.2.3.0/24 Rule: Allow to www.example.com Rule: Deny to 0.0.0.0/0
6.5.2. Editing an egress firewall for a project
As a cluster administrator, you can modify network traffic rules for an existing egress firewall.
6.5.2.1. Editing an EgressFirewall custom resource (CR)
As a cluster administrator, you can update the egress firewall for a project.
Prerequisites
- A cluster using the OVN-Kubernetes network plugin.
-
Install the OpenShift CLI (
oc). - You must log in to the cluster as a cluster administrator.
Procedure
Find the name of the
EgressFirewallCR for the project. Replace<project>with the name of the project.$ oc get -n <project> egressfirewallOptional: If you did not save a copy of the
EgressFirewallobject when you created the egress network firewall, enter the following command to create a copy.$ oc get -n <project> egressfirewall <name> -o yaml > <filename>.yamlReplace
<project>with the name of the project. Replace<name>with the name of the object. Replace<filename>with the name of the file to save the YAML to.After making changes to the policy rules, enter the following command to replace the
EgressFirewallCR. Replace<filename>with the name of the file containing the updatedEgressFirewallCR.$ oc replace -f <filename>.yaml
6.5.3. Removing an egress firewall from a project
As a cluster administrator, you can remove an egress firewall from a project to remove all restrictions on network traffic from the project that leaves the OpenShift Container Platform cluster.
6.5.3.1. Removing an EgressFirewall CR
As a cluster administrator, you can remove an egress firewall from a project.
Prerequisites
- A cluster using the OVN-Kubernetes network plugin.
-
Install the OpenShift CLI (
oc). - You must log in to the cluster as a cluster administrator.
Procedure
Find the name of the
EgressFirewallCR for the project. Replace<project>with the name of the project.$ oc get egressfirewall -n <project>Delete the
EgressFirewallCR by entering the following command. Replace<project>with the name of the project and<name>with the name of the object.$ oc delete -n <project> egressfirewall <name>
6.5.4. Configuring an egress firewall for a project
As a cluster administrator, you can create an egress firewall for a project that restricts egress traffic leaving your OpenShift Container Platform cluster.
6.5.4.1. How an egress firewall works in a project
As a cluster administrator, you can use an egress firewall to limit the external hosts that some or all pods can access from within the cluster. An egress firewall supports the following scenarios:
- A pod can only connect to internal hosts and cannot initiate connections to the public internet.
- A pod can only connect to the public internet and cannot initiate connections to internal hosts that are outside the OpenShift Container Platform cluster.
- A pod cannot reach specified internal subnets or hosts outside the OpenShift Container Platform cluster.
- A pod can only connect to specific external hosts.
For example, you can allow one project access to a specified IP range but deny the same access to a different project. Or, you can restrict application developers from updating from Python pip mirrors, and force updates to come only from approved sources.
You configure an egress firewall policy by creating an EgressFirewall custom resource (CR). The egress firewall matches network traffic that meets any of the following criteria:
- An IP address range in CIDR format
- A DNS name that resolves to an IP address
- A port number
- A protocol that is one of the following protocols: TCP, UDP, and SCTP
6.5.4.1.1. Limitations of an egress firewall
An egress firewall has the following limitations:
-
No project can have more than one
EgressFirewallCR. -
Egress firewall rules do not apply to traffic that goes through routers. Any user with permission to create a
RouteCR object can bypass egress firewall policy rules by creating a route that points to a forbidden destination. - Egress firewall does not apply to the host network namespace. Pods with host networking enabled are unaffected by egress firewall rules.
If your egress firewall includes a deny rule for
0.0.0.0/0, access to your OpenShift Container Platform API servers is blocked. You must either add allow rules for each IP address or use thenodeSelectortype allow rule in your egress policy rules to connect to API servers.The following example illustrates the order of the egress firewall rules necessary to ensure API server access:
EgressFirewallAPI server access exampleapiVersion: k8s.ovn.org/v1 kind: EgressFirewall metadata: name: default namespace: <namespace>1 spec: egress: - to: cidrSelector: <api_server_address_range>2 type: Allow # ... - to: cidrSelector: 0.0.0.0/03 type: Denywhere:
- <namespace>
- Specifies the namespace for the egress firewall.
- <api_server_address_range>
- Specifies the IP address range that includes your OpenShift Container Platform API servers.
- <cidrSelector>
Specifies a value of
0.0.0.0/0to set a global deny rule that prevents access to the OpenShift Container Platform API servers.To find the IP address for your API servers, run
oc get ep kubernetes -n default.For more information, see BZ#1988324.
-
A maximum of one
EgressFirewallobject with a maximum of 8,000 rules can be defined per project. - If you are using the OVN-Kubernetes network plugin with shared gateway mode in Red Hat OpenShift Networking, return ingress replies are affected by egress firewall rules. If the egress firewall rules drop the ingress reply destination IP, the traffic is dropped.
- In general, using Domain Name Server (DNS) names in your egress firewall policy does not affect local DNS resolution through CoreDNS. However, if your egress firewall policy uses domain names and an external DNS server handles DNS resolution for an affected pod, you must include egress firewall rules that permit access to the IP addresses of your DNS server.
Violating any of these restrictions results in a broken egress firewall for the project. Consequently, all external network traffic is dropped, which can cause security risks for your organization.
An EgressFirewall resource is created in the kube-node-lease, kube-public, kube-system, openshift and openshift- projects.
6.5.4.1.2. Matching order for egress firewall policy rules
OVN-Kubernetes evaluates egress firewall policy rules in the order they are defined in, from first to last. The first rule that matches an egress connection from a pod applies. Any subsequent rules are ignored for that connection.
6.5.4.1.3. How Domain Name Server (DNS) resolution works
If you use DNS names in any of your egress firewall policy rules, proper resolution of the domain names is subject to the following restrictions:
- Domain name updates are polled based on a time-to-live (TTL) duration. By default, the duration is 30 minutes. When the egress firewall controller queries the local name servers for a domain name, if the response includes a TTL and the TTL is less than 30 minutes, the controller sets the duration for that DNS name to the returned value. Each DNS name is queried after the TTL for the DNS record expires.
- The pod must resolve the domain from the same local name servers when necessary. Otherwise the IP addresses for the domain known by the egress firewall controller and the pod can be different. If the IP addresses for a hostname differ, the egress firewall might not be enforced consistently.
-
Because the egress firewall controller and pods asynchronously poll the same local name server, the pod might obtain the updated IP address before the egress controller does, which causes a race condition. Due to this current limitation, domain name usage in
EgressFirewallobjects is only recommended for domains with infrequent IP address changes.
6.5.4.1.3.1. Improved DNS resolution and resolving wildcard domain names
There might be situations where the IP addresses associated with a DNS record change frequently, or you might want to specify wildcard domain names in your egress firewall policy rules.
In this situation, the OVN-Kubernetes cluster manager creates a DNSNameResolver custom resource object for each unique DNS name used in your egress firewall policy rules. This custom resource stores the following information:
Improved DNS resolution for egress firewall rules is a Technology Preview feature only. Technology Preview features are not supported with Red Hat production service level agreements (SLAs) and might not be functionally complete. Red Hat does not recommend using them in production. These features provide early access to upcoming product features, enabling customers to test functionality and provide feedback during the development process.
For more information about the support scope of Red Hat Technology Preview features, see Technology Preview Features Support Scope.
Example DNSNameResolver CR definition
apiVersion: networking.openshift.io/v1alpha1
kind: DNSNameResolver
spec:
name: www.example.com.
status:
resolvedNames:
- dnsName: www.example.com.
resolvedAddress:
- ip: "1.2.3.4"
ttlSeconds: 60
lastLookupTime: "2023-08-08T15:07:04Z"where:
- <name>
- Specifies the DNS name. This can be either a standard DNS name or a wildcard DNS name. For a wildcard DNS name, the DNS name resolution information contains all of the DNS names that match the wildcard DNS name.
- <dnsName>
-
Specifies the resolved DNS name matching the
spec.namefield. If thespec.namefield contains a wildcard DNS name, then multiplednsNameentries are created that contain the standard DNS names that match the wildcard DNS name when resolved. If the wildcard DNS name can also be successfully resolved, then this field also stores the wildcard DNS name. <ip> Specifies the current IP addresses associated with the DNS name. - <ttlSeconds>
- Specifies the last time-to-live (TTL) duration.
- <lastLookupTime>
- Specifies the last lookup time.
If during DNS resolution the DNS name in the query matches any name defined in a DNSNameResolver CR, then the previous information is updated accordingly in the CR status field. For unsuccessful DNS wildcard name lookups, the request is retried after a default TTL of 30 minutes.
The OVN-Kubernetes cluster manager watches for updates to an EgressFirewall custom resource object, and creates, modifies, or deletes DNSNameResolver CRs associated with those egress firewall policies when that update occurs.
Do not modify DNSNameResolver custom resources directly. This can lead to unwanted behavior of your egress firewall.
6.5.4.2. EgressFirewall custom resource (CR)
You can define one or more rules for an egress firewall. A rule is either an Allow rule or a Deny rule, with a specification for the traffic that the rule applies to.
The following YAML describes an EgressFirewall CR:
EgressFirewall object
apiVersion: k8s.ovn.org/v1
kind: EgressFirewall
metadata:
name: <ovn>
spec:
egress: <egress_rules>
...where:
- <ovn>
-
The name for the object must be
default. - <egress_rules>
- Specifies a collection of one or more egress network policy rules as described in the following section.
6.5.4.2.1. EgressFirewall rules
The following YAML describes the rules for an EgressFirewall resource. The user can select either an IP address range in CIDR format, a domain name, or use the nodeSelector field to allow or deny egress traffic. The egress stanza expects an array of one or more objects.
Egress policy rule stanza
egress:
- type: <type>
to:
cidrSelector: <cidr_range>
dnsName: <dns_name>
nodeSelector: <label_name>: <label_value>
ports: <optional_port>
...where:
- <type>
-
Specifies the type of rule. The value must be either
AlloworDeny. - <to>
-
Specifies a stanza describing an egress traffic match rule that specifies the
cidrSelectorfield or thednsNamefield. You cannot use both fields in the same rule. - <cidr_range>
- Specifies an IP address range in CIDR format.
- <dns_name>
- Specifies a DNS domain name.
- <nodeSelector>
-
Specifies labels which are key and value pairs that the user defines. Labels are attached to objects, such as pods. The
nodeSelectorallows for one or more node labels to be selected and attached to pods. - <ports>
- Specifies an optional field that describes a collection of network ports and protocols for the rule.
Ports stanza
ports:
- port:
protocol:where:
- <port>
-
Specifies a network port, such as
80or443. If you specify a value for this field, you must also specify a value for theprotocolfield. - <protocol>
-
Specifies a network protocol. The value must be either
TCP,UDP, orSCTP.
6.5.4.2.2. Example EgressFirewall CR
The following example defines several egress firewall policy rules:
apiVersion: k8s.ovn.org/v1
kind: EgressFirewall
metadata:
name: default
spec:
egress:
- type: Allow
to:
cidrSelector: 1.2.3.0/24
- type: Deny
to:
cidrSelector: 0.0.0.0/0where:
- <egress>
- Specifies a collection of egress firewall policy rule objects.
The following example defines a policy rule that denies traffic to the host at the 172.16.1.1/32 IP address, if the traffic is using either the TCP protocol and destination port 80 or any protocol and destination port 443.
apiVersion: k8s.ovn.org/v1
kind: EgressFirewall
metadata:
name: default
spec:
egress:
- type: Deny
to:
cidrSelector: 172.16.1.1/32
ports:
- port: 80
protocol: TCP
- port: 4436.5.4.2.3. Example EgressFirewall CR using nodeSelector
As a cluster administrator, you can allow or deny egress traffic to nodes in your cluster by specifying a label using nodeSelector field. Labels can be applied to one or more nodes. Labels can be helpful because instead of adding manual rules per node IP address, you can use node selectors to create a label that allows pods behind an egress firewall to access host network pods. The following is an example with the region=east label:
apiVersion: k8s.ovn.org/v1
kind: EgressFirewall
metadata:
name: default
spec:
egress:
- to:
nodeSelector:
matchLabels:
region: east
type: Allow6.5.4.3. Creating an EgressFirewall custom resource (CR)
As a cluster administrator, you can create an egress firewall policy object for a project.
If the project already has an EgressFirewall resource, you must edit the existing policy to make changes to egress firewall rules.
Prerequisites
- A cluster that uses the OVN-Kubernetes network plugin.
-
Install the OpenShift CLI (
oc). - You must log in to the cluster as a cluster administrator.
Procedure
Create a policy rule:
-
Create a
<policy_name>.yamlfile where<policy_name>describes the egress policy rules. -
Define the
EgressFirewallobject in the file.
-
Create a
Create the policy object by entering the following command. Replace
<policy_name>with the name of the policy and<project>with the project that the rule applies to.$ oc create -f <policy_name>.yaml -n <project>Successful output lists the
egressfirewall.k8s.ovn.org/v1name and thecreatedstatus.-
Optional: Save the
<policy_name>.yamlfile so that you can make changes later.
6.6. Configuring IPsec encryption
By enabling IPsec, you can encrypt both internal pod-to-pod cluster traffic between nodes and external traffic between pods and IPsec endpoints external to your cluster. All pod-to-pod network traffic between nodes on the OVN-Kubernetes cluster network is encrypted with IPsec in Transport mode.
IPsec is disabled by default. You can enable IPsec either during or after installing the cluster. For information about cluster installation, see OpenShift Container Platform installation overview.
Upgrading your cluster to OpenShift Container Platform 4.16 when the libreswan and NetworkManager-libreswan packages have different OpenShift Container Platform versions causes two consecutive compute node reboot operations. For the first reboot, the Cluster Network Operator (CNO) applies the IPsec configuration to compute nodes. For the second reboot, the Machine Config Operator (MCO) applies the latest machine configs to the cluster.
To combine the CNO and MCO updates into a single node reboot, complete the following tasks:
-
Before upgrading your cluster, set the
pausedparameter totruein theMachineConfigPoolscustom resource (CR) that groups compute nodes. -
After you upgrade your cluster, set the parameter to
false.
For more information, see Performing a Control Plane Only update.
The following support limitations exist for IPsec on a OpenShift Container Platform cluster:
- On IBM Cloud®, IPsec supports only NAT-T. Encapsulating Security Payload (ESP) is not supported on this platform.
- If your cluster uses hosted control planes for Red Hat OpenShift Container Platform, IPsec is not supported for IPsec encryption of either pod-to-pod or traffic to external hosts.
- Using ESP hardware offloading on any network interface is not supported if one or more of those interfaces is attached to Open vSwitch (OVS). Enabling IPsec for your cluster triggers the use of IPsec with interfaces attached to OVS. By default, OpenShift Container Platform disables ESP hardware offloading on any interfaces attached to OVS.
- If you enabled IPsec for network interfaces that are not attached to OVS, a cluster administrator must manually disable ESP hardware offloading on each interface that is not attached to OVS.
-
IPsec is not supported on Red Hat Enterprise Linux (RHEL) compute nodes because of a
libreswanincompatiblility issue between a host and anovn-ipseccontainer that exist in each compute node. See (OCPBUGS-53316).
The following list outlines key tasks in the IPsec documentation:
- Enable and disable IPsec after cluster installation.
- Configure IPsec encryption for traffic between the cluster and external hosts.
- Verify that IPsec encrypts traffic between pods on different nodes.
6.6.1. Modes of operation
When using IPsec on your OpenShift Container Platform cluster, you can choose from the following operating modes:
| Mode | Description | Default |
|---|---|---|
|
| No traffic is encrypted. This is the cluster default. | Yes |
|
| Pod-to-pod traffic is encrypted as described in "Types of network traffic flows encrypted by pod-to-pod IPsec". Traffic to external nodes may be encrypted after you complete the required configuration steps for IPsec. | No |
|
| Traffic to external nodes may be encrypted after you complete the required configuration steps for IPsec. | No |
6.6.2. Prerequisites
For IPsec support for encrypting traffic to external hosts, ensure that you meet the following prerequisites:
-
Set
routingViaHost=truein theovnKubernetesConfig.gatewayConfigspecification of the OVN-Kubernetes network plugin. Install the NMState Operator. This Operator is required for specifying the IPsec configuration. For more information, see Kubernetes NMState Operator.
NoteThe NMState Operator is supported on Google Cloud only for configuring IPsec.
-
The Butane tool (
butane) is installed. To install Butane, see Installing Butane.
These prerequisites are required to add certificates into the host NSS database and to configure IPsec to communicate with external hosts.
6.6.3. Network connectivity requirements when IPsec is enabled
You must configure the network connectivity between machines to allow OpenShift Container Platform cluster components to communicate. Each machine must be able to resolve the hostnames of all other machines in the cluster.
| Protocol | Port | Description |
|---|---|---|
| UDP |
| IPsec IKE packets |
|
| IPsec NAT-T packets | |
| ESP | N/A | IPsec Encapsulating Security Payload (ESP) |
6.6.4. IPsec encryption for pod-to-pod traffic
For IPsec encryption of pod-to-pod traffic, the following sections describe which specific pod-to-pod traffic is encrypted, what kind of encryption protocol is used, and how X.509 certificates are handled. These sections do not apply to IPsec encryption between the cluster and external hosts, which you must configure manually for your specific external network infrastructure.
6.6.4.1. Types of network traffic flows encrypted by pod-to-pod IPsec
With IPsec enabled, only the following network traffic flows between pods are encrypted:
- Traffic between pods on different nodes on the cluster network
- Traffic from a pod on the host network to a pod on the cluster network
The following traffic flows are not encrypted:
- Traffic between pods on the same node on the cluster network
- Traffic between pods on the host network
- Traffic from a pod on the cluster network to a pod on the host network
The encrypted and unencrypted flows are illustrated in the following diagram:
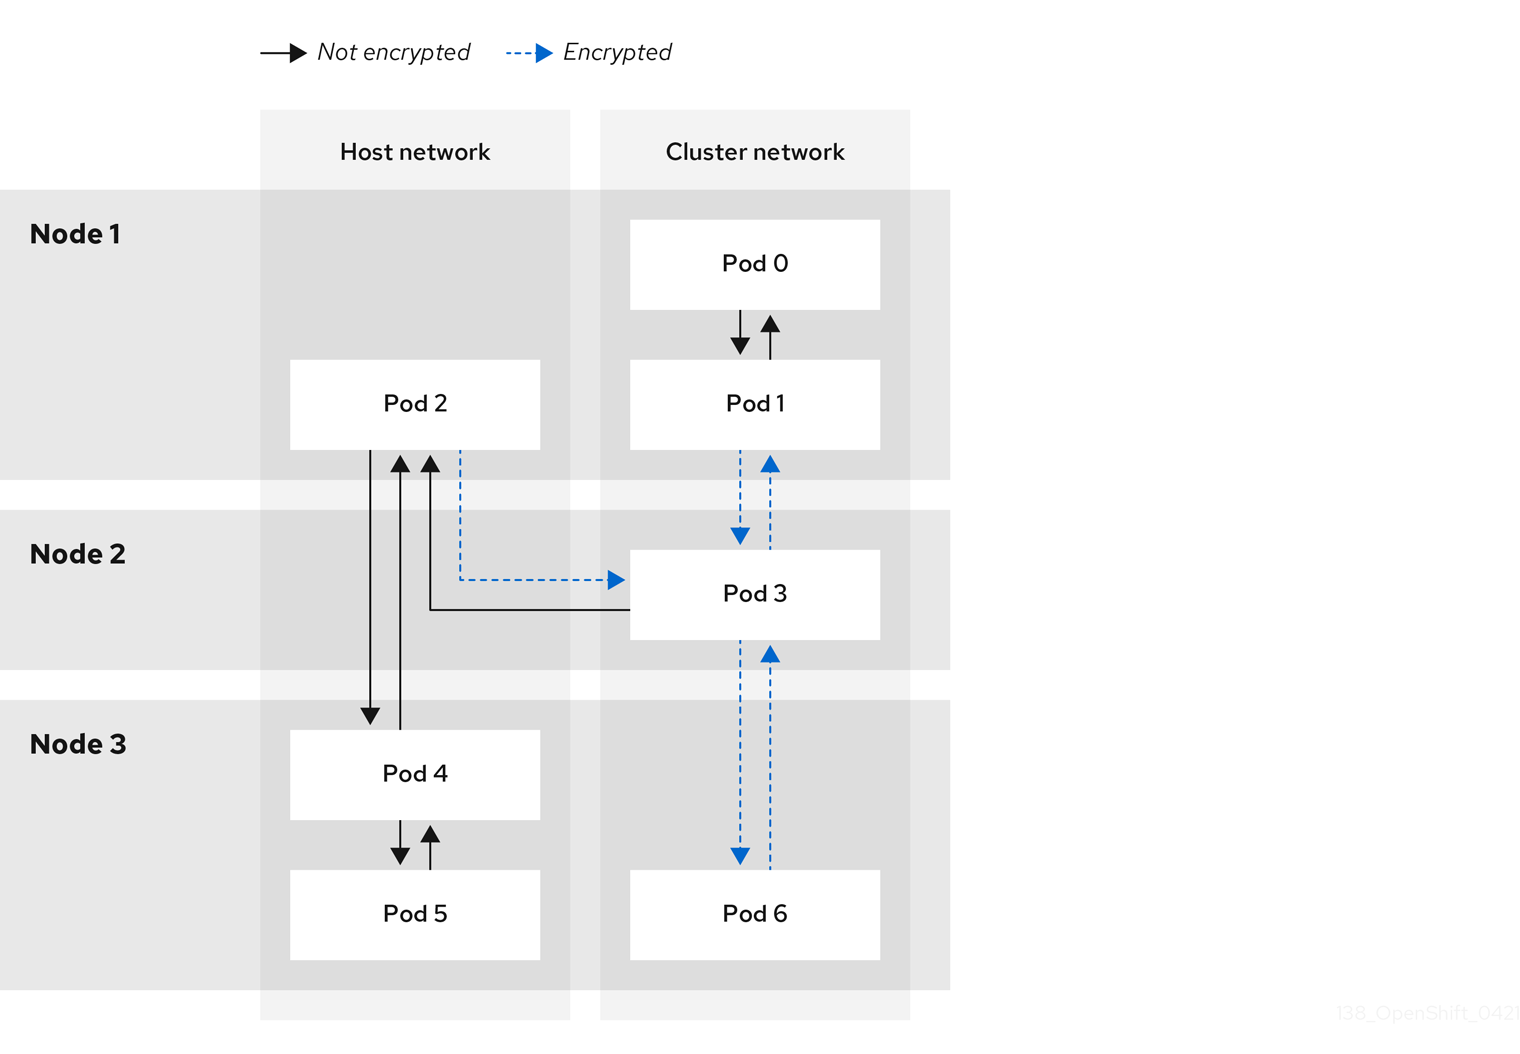
6.6.4.2. Encryption protocol and IPsec mode
The encrypt cipher used is AES-GCM-16-256. The integrity check value (ICV) is 16 bytes. The key length is 256 bits.
The IPsec mode used is Transport mode, a mode that encrypts end-to-end communication by adding an Encapsulated Security Payload (ESP) header to the IP header of the original packet and encrypts the packet data. OpenShift Container Platform does not currently use or support IPsec Tunnel mode for pod-to-pod communication.
6.6.4.3. Security certificate generation and rotation
The Cluster Network Operator (CNO) generates a self-signed X.509 certificate authority (CA) that is used by IPsec for encryption. Certificate signing requests (CSRs) from each node are automatically fulfilled by the CNO.
The CA is valid for 10 years. The individual node certificates are valid for 5 years and are automatically rotated after 4 1/2 years elapse.
6.6.5. IPsec encryption for external traffic
OpenShift Container Platform supports the use of IPsec to encrypt traffic destined for external hosts, ensuring confidentiality and integrity of data in transit. This feature relies on X.509 certificates that you must supply.
6.6.5.1. Supported platforms
This feature is supported on the following platforms:
- Bare metal
- Google Cloud
- Red Hat OpenStack Platform (RHOSP)
- VMware vSphere
If you have Red Hat Enterprise Linux (RHEL) compute nodes, these do not support IPsec encryption for external traffic.
If your cluster uses hosted control planes for Red Hat OpenShift Container Platform, configuring IPsec for encrypting traffic to external hosts is not supported.
6.6.5.2. Limitations
Ensure that the following prohibitions are observed:
- IPv6 configuration is not currently supported by the NMState Operator when configuring IPsec for external traffic.
-
Certificate common names (CN) in the provided certificate bundle must not begin with the
ovs_prefix, because this naming can conflict with pod-to-pod IPsec CN names in the Network Security Services (NSS) database of each node.
6.6.6. Enabling IPsec encryption
As a cluster administrator, you can enable pod-to-pod IPsec encryption, IPsec encryption between the cluster, and external IPsec endpoints.
You can configure IPsec in either of the following modes:
-
Full: Encryption for pod-to-pod and external traffic -
External: Encryption for external traffic
If you configure IPsec in Full mode, you must also complete the "Configuring IPsec encryption for external traffic" procedure.
Prerequisites
-
Install the OpenShift CLI (
oc). -
You are logged in to the cluster as a user with
cluster-adminprivileges. -
You have reduced the size of your cluster MTU by
46bytes to allow for the overhead of the IPsec ESP header.
Procedure
To enable IPsec encryption, enter the following command:
$ oc patch networks.operator.openshift.io cluster --type=merge -p \ '{ "spec":{ "defaultNetwork":{ "ovnKubernetesConfig":{ "ipsecConfig":{ "mode":"<mode">1 }}}}}'- Encrypt external traffic with IPsec by completing the "Configuring IPsec encryption for external traffic" procedure.
Verification
To find the names of the OVN-Kubernetes data plane pods, enter the following command:
$ oc get pods -n openshift-ovn-kubernetes -l=app=ovnkube-nodeExample output
ovnkube-node-5xqbf 8/8 Running 0 28m ovnkube-node-6mwcx 8/8 Running 0 29m ovnkube-node-ck5fr 8/8 Running 0 31m ovnkube-node-fr4ld 8/8 Running 0 26m ovnkube-node-wgs4l 8/8 Running 0 33m ovnkube-node-zfvcl 8/8 Running 0 34m ...Verify that you enabled IPsec on your cluster by running the following command:
NoteAs a cluster administrator, you can verify that you enabled IPsec between pods on your cluster when you configured IPsec in
Fullmode. This step does not verify whether IPsec is working between your cluster and external hosts.$ oc -n openshift-ovn-kubernetes rsh ovnkube-node-<XXXXX> ovn-nbctl --no-leader-only get nb_global . ipsec1 where:
<XXXXX>specifies the random sequence of letters for a pod from an earlier step.Successful output from the command shows the status as
true.
6.6.7. Configuring IPsec encryption for external traffic
As a cluster administrator, to encrypt external traffic with IPsec you must configure IPsec for your network infrastructure, including providing PKCS#12 certificates. Because this procedure uses Butane to create machine configs, you must have the butane tool installed.
After you apply the machine config, the Machine Config Operator (MCO) reboots affected nodes in your cluster to rollout the new machine config.
Prerequisites
-
Install the OpenShift CLI (
oc). -
You have installed the
butanetool on your local computer. - You have installed the NMState Operator on the cluster.
-
You logged in to the cluster as a user with
cluster-adminprivileges. - You have an existing PKCS#12 certificate for the IPsec endpoint and a CA cert in Privacy Enhanced Mail (PEM) format.
-
You enabled IPsec in either
FullorExternalmode on your cluster. -
You must set the
routingViaHostparameter totruein theovnKubernetesConfig.gatewayConfigspecification of the OVN-Kubernetes network plugin.
Procedure
Create an IPsec configuration with an NMState Operator node network configuration policy. For more information, see Configuring an IPsec based VPN connection by using nmstatectl.
To identify the IP address of the cluster node that is the IPsec endpoint, enter the following command:
$ oc get nodesCreate a file named
ipsec-config.yamlthat has a node network configuration policy for the NMState Operator, such as in the following examples. For an overview aboutNodeNetworkConfigurationPolicyobjects, see The Kubernetes NMState project.Example NMState IPsec transport configuration
apiVersion: nmstate.io/v1 kind: NodeNetworkConfigurationPolicy metadata: name: ipsec-config spec: nodeSelector: kubernetes.io/hostname: "<hostname>" desiredState: interfaces: - name: <interface_name> type: ipsec libreswan: left: <cluster_node> leftid: '%fromcert' leftrsasigkey: '%cert' leftcert: left_server leftmodecfgclient: false right: <external_host> rightid: '%fromcert' rightrsasigkey: '%cert' rightsubnet: <external_address>/32 ikev2: insist type: transportwhere:
kubernetes.io/hostname- Specifies the hostname to apply the policy to. This host serves as the left side host in the IPsec configuration.
name- Specifies the name of the interface to create on the host.
left-
Specifies the hostname of the cluster node that terminates the IPsec tunnel on the cluster side. The name must match the SAN
[Subject Alternate Name]from your supplied PKCS#12 certificates. right-
Specifies the external hostname, such as
host.example.com. The name should match the SAN[Subject Alternate Name]from your supplied PKCS#12 certificates. rightsubnetSpecifies the IP address of the external host, such as
10.1.2.3/32.Example NMState IPsec tunnel configuration
apiVersion: nmstate.io/v1 kind: NodeNetworkConfigurationPolicy metadata: name: ipsec-config spec: nodeSelector: kubernetes.io/hostname: "<hostname>" desiredState: interfaces: - name: <interface_name> type: ipsec libreswan: left: <cluster_node> leftid: '%fromcert' leftmodecfgclient: false leftrsasigkey: '%cert' leftcert: left_server right: <external_host> rightid: '%fromcert' rightrsasigkey: '%cert' rightsubnet: <external_address>/32 ikev2: insist type: tunnel
To configure the IPsec interface, enter the following command:
$ oc create -f ipsec-config.yaml
Give the following certificate files to add to the Network Security Services (NSS) database on each host. These files are imported as part of the Butane configuration in the next steps.
-
left_server.p12: The certificate bundle for the IPsec endpoints -
ca.pem: The certificate authority that you signed your certificates with
-
- Create a machine config to add your certificates to the cluster.
Read the password from a mounted secret file:
$ password=$(cat run/secrets/<left_server_password>)-
left_server_password:: The name of the file that contains the password. This file exists in the mounted secret.
-
Use the
pk12utiltool, which comes prepackaged with Red Hat Enterprise Linux (RHEL), to specify a password that protectsPKCS#12files by entering the following command. Ensure that you replace the<password>value with your password.$ pk12util -W "<password>" -i /etc/pki/certs/left_server.p12 -d /var/lib/ipsec/nss/To create Butane config files for the control plane and compute nodes, enter the following command:
NoteThe Butane version you specify in the config file should match the OpenShift Container Platform version and always ends in
0. For example,4.16.0. See "Creating machine configs with Butane" for information about Butane.$ for role in master worker; do cat >> "99-ipsec-${role}-endpoint-config.bu" <<-EOF variant: openshift version: 4.16.0 metadata: name: 99-${role}-import-certs labels: machineconfiguration.openshift.io/role: $role systemd: units: - name: ipsec-import.service enabled: true contents: | [Unit] Description=Import external certs into ipsec NSS Before=ipsec.service [Service] Type=oneshot ExecStart=/usr/local/bin/ipsec-addcert.sh RemainAfterExit=false StandardOutput=journal [Install] WantedBy=multi-user.target storage: files: - path: /etc/pki/certs/ca.pem mode: 0400 overwrite: true contents: local: ca.pem - path: /etc/pki/certs/left_server.p12 mode: 0400 overwrite: true contents: local: left_server.p12 - path: /usr/local/bin/ipsec-addcert.sh mode: 0740 overwrite: true contents: inline: | #!/bin/bash -e echo "importing cert to NSS" certutil -A -n "CA" -t "CT,C,C" -d /var/lib/ipsec/nss/ -i /etc/pki/certs/ca.pem pk12util -W "" -i /etc/pki/certs/left_server.p12 -d /var/lib/ipsec/nss/ certutil -M -n "left_server" -t "u,u,u" -d /var/lib/ipsec/nss/ EOF doneTo transform the Butane files that you created in the earlier step into machine configs, enter the following command:
$ for role in master worker; do butane -d . 99-ipsec-${role}-endpoint-config.bu -o ./99-ipsec-$role-endpoint-config.yaml doneTo apply the machine configs to your cluster, enter the following command:
$ for role in master worker; do oc apply -f 99-ipsec-${role}-endpoint-config.yaml doneImportantAs the Machine Config Operator (MCO) updates machines in each machine config pool, it reboots each node one by one. You must wait for all the nodes to update before external IPsec connectivity is available.
Verification
Check the machine config pool status by entering the following command:
$ oc get mcpA successfully updated node has the following status:
UPDATED=true,UPDATING=false,DEGRADED=false.NoteBy default, the MCO updates one machine per pool at a time, causing the total time the migration takes to increase with the size of the cluster.
To confirm that IPsec machine configs rolled out successfully, enter the following commands:
Confirm the creation of the IPsec machine configs:
$ oc get mc | grep ipsecExample output
80-ipsec-master-extensions 3.2.0 6d15h 80-ipsec-worker-extensions 3.2.0 6d15hConfirm you have applied the IPsec extension to control plane nodes:
$ oc get mcp master -o yaml | grep 80-ipsec-master-extensions -cConfirm the application of the IPsec extension to compute nodes. Example output would show
2.$ oc get mcp worker -o yaml | grep 80-ipsec-worker-extensions -c
6.6.9. Disabling IPsec encryption for an external IPsec endpoint
As a cluster administrator, you can remove an existing IPsec tunnel to an external host.
Prerequisites
-
Install the OpenShift CLI (
oc). -
You are logged in to the cluster as a user with
cluster-adminprivileges. -
You enabled IPsec in either
FullorExternalmode on your cluster.
Procedure
Create a file named
remove-ipsec-tunnel.yamlwith the following YAML:kind: NodeNetworkConfigurationPolicy apiVersion: nmstate.io/v1 metadata: name: <name> spec: nodeSelector: kubernetes.io/hostname: <node_name> desiredState: interfaces: - name: <tunnel_name> type: ipsec state: absentwhere:
name- Specifies a name for the node network configuration policy.
node_name- Specifies the name of the node where the IPsec tunnel that you want to remove exists.
tunnel_name- Specifies the interface name for the existing IPsec tunnel.
To remove the IPsec tunnel, enter the following command:
$ oc apply -f remove-ipsec-tunnel.yaml
6.6.10. Disabling IPsec encryption
As a cluster administrator, you can disable IPsec encryption.
Prerequisites
-
Install the OpenShift CLI (
oc). -
Log in to the cluster with a user with
cluster-adminprivileges.
Procedure
To disable IPsec encryption, enter the following command:
$ oc patch networks.operator.openshift.io cluster --type=merge \ -p '{ "spec":{ "defaultNetwork":{ "ovnKubernetesConfig":{ "ipsecConfig":{ "mode":"Disabled" }}}}}'-
Optional: You can increase the size of your cluster MTU by
46bytes because there is no longer any overhead from the IPsec ESP header in IP packets.
6.7. Zero trust networking
Zero trust is an approach to designing security architectures based on the premise that every interaction begins in an untrusted state. This contrasts with traditional architectures, which might determine trustworthiness based on whether communication starts inside a firewall. More specifically, zero trust attempts to close gaps in security architectures that rely on implicit trust models and one-time authentication.
OpenShift Container Platform can add some zero trust networking capabilities to containers running on the platform without requiring changes to the containers or the software running in them. There are also several products that Red Hat offers that can further augment the zero trust networking capabilities of containers. If you have the ability to change the software running in the containers, then there are other projects that Red Hat supports that can add further capabilities.
Explore the following targeted capabilities of zero trust networking.
6.7.1. Root of trust
Public certificates and private keys are critical to zero trust networking. These are used to identify components to one another, authenticate, and to secure traffic. The certificates are signed by other certificates, and there is a chain of trust to a root certificate authority (CA). Everything participating in the network needs to ultimately have the public key for a root CA so that it can validate the chain of trust. For public-facing things, these are usually the set of root CAs that are globally known, and whose keys are distributed with operating systems, web browsers, and so on. However, it is possible to run a private CA for a cluster or a corporation if the certificate of the private CA is distributed to all parties.
Leverage:
- OpenShift Container Platform: OpenShift creates a cluster CA at installation that is used to secure the cluster resources. However, OpenShift Container Platform can also create and sign certificates for services in the cluster, and can inject the cluster CA bundle into a pod if requested. Service certificates created and signed by OpenShift Container Platform have a 26-month time to live (TTL) and are rotated automatically at 13 months. They can also be rotated manually if necessary.
- OpenShift cert-manager Operator: cert-manager allows you to request keys that are signed by an external root of trust. There are many configurable issuers to integrate with external issuers, along with ways to run with a delegated signing certificate. The cert-manager API can be used by other software in zero trust networking to request the necessary certificates (for example, Red Hat OpenShift Service Mesh), or can be used directly by customer software.
6.7.2. Traffic authentication and encryption
Ensure that all traffic on the wire is encrypted and the endpoints are identifiable. An example of this is Mutual TLS, or mTLS, which is a method for mutual authentication.
Leverage:
- OpenShift Container Platform: With transparent pod-to-pod IPsec, the source and destination of the traffic can be identified by the IP address. There is the capability for egress traffic to be encrypted using IPsec. By using the egress IP feature, the source IP address of the traffic can be used to identify the source of the traffic inside the cluster.
- Red Hat OpenShift Service Mesh: Provides powerful mTLS capabilities that can transparently augment traffic leaving a pod to provide authentication and encryption.
- OpenShift cert-manager Operator: Use custom resource definitions (CRDs) to request certificates that can be mounted for your programs to use for SSL/TLS protocols.
6.7.3. Identification and authentication
After you have the ability to mint certificates using a CA, you can use it to establish trust relationships by verification of the identity of the other end of a connection — either a user or a client machine. This also requires management of certificate lifecycles to limit use if compromised.
Leverage:
- OpenShift Container Platform: Cluster-signed service certificates to ensure that a client is talking to a trusted endpoint. This requires that the service uses SSL/TLS and that the client uses the cluster CA. The client identity must be provided using some other means.
- Red Hat Single Sign-On: Provides request authentication integration with enterprise user directories or third-party identity providers.
- Red Hat OpenShift Service Mesh: Transparent upgrade of connections to mTLS, auto-rotation, custom certificate expiration, and request authentication with JSON web token (JWT).
- OpenShift cert-manager Operator: Creation and management of certificates for use by your application. Certificates can be controlled by CRDs and mounted as secrets, or your application can be changed to interact directly with the cert-manager API.
6.7.4. Inter-service authorization
It is critical to be able to control access to services based on the identity of the requester. This is done by the platform and does not require each application to implement it. That allows better auditing and inspection of the policies.
Leverage:
-
OpenShift Container Platform: Can enforce isolation in the networking layer of the platform using the Kubernetes
NetworkPolicyandAdminNetworkPolicyobjects. - Red Hat OpenShift Service Mesh: Sophisticated L4 and L7 control of traffic using standard Istio objects and using mTLS to identify the source and destination of traffic and then apply policies based on that information.
6.7.5. Transaction-level verification
In addition to the ability to identify and authenticate connections, it is also useful to control access to individual transactions. This can include rate-limiting by source, observability, and semantic validation that a transaction is well formed.
Leverage:
- Red Hat OpenShift Service Mesh: Perform L7 inspection of requests, rejecting malformed HTTP requests, transaction-level observability and reporting. Service Mesh can also provide request-based authentication using JWT.
6.7.6. Risk assessment
As the number of security policies in a cluster increase, visualization of what the policies allow and deny becomes increasingly important. These tools make it easier to create, visualize, and manage cluster security policies.
Leverage:
-
Red Hat OpenShift Service Mesh: Create and visualize Kubernetes
NetworkPolicyandAdminNetworkPolicy, and OpenShift NetworkingEgressFirewallobjects using the OpenShift web console. - Red Hat Advanced Cluster Security for Kubernetes: Advanced visualization of objects.
6.7.7. Site-wide policy enforcement and distribution
After deploying applications on a cluster, it becomes challenging to manage all of the objects that make up the security rules. It becomes critical to be able to apply site-wide policies and audit the deployed objects for compliance with the policies. This should allow for delegation of some permissions to users and cluster administrators within defined bounds, and should allow for exceptions to the policies if necessary.
Leverage:
- Red Hat OpenShift Service Mesh: RBAC to control policy objects and delegate control.
- Red Hat Advanced Cluster Security for Kubernetes: Policy enforcement engine.
- Red Hat Advanced Cluster Management (RHACM) for Kubernetes: Centralized policy control.
6.7.8. Observability for constant, and retrospective, evaluation
After you have a running cluster, you want to be able to observe the traffic and verify that the traffic comports with the defined rules. This is important for intrusion detection, forensics, and is helpful for operational load management.
Leverage:
- Network Observability Operator: Allows for inspection, monitoring, and alerting on network connections to pods and nodes in the cluster.
- Red Hat Advanced Cluster Management (RHACM) for Kubernetes: Monitors, collects, and evaluates system-level events such as process execution, network connections and flows, and privilege escalation. It can determine a baseline for a cluster, and then detect anomalous activity and alert you about it.
- Red Hat OpenShift Service Mesh: Can monitor traffic entering and leaving a pod.
- Red Hat OpenShift Distributed Tracing Platform: For suitably instrumented applications, you can see all traffic associated with a particular action as it splits into sub-requests to microservices. This allows you to identify bottlenecks within a distributed application.
6.7.9. Endpoint security
It is important to be able to trust that the software running the services in your cluster has not been compromised. For example, you might need to ensure that certified images are run on trusted hardware, and have policies to only allow connections to or from an endpoint based on endpoint characteristics.
Leverage:
- OpenShift Container Platform: Secureboot can ensure that the nodes in the cluster are running trusted software, so the platform itself (including the container runtime) have not been tampered with. You can configure OpenShift Container Platform to only run images that have been signed by certain signatures.
- Red Hat Trusted Artifact Signer: This can be used in a trusted build chain and produce signed container images.
6.7.10. Extending trust outside of the cluster
You might want to extend trust outside of the cluster by allowing a cluster to mint CAs for a subdomain. Alternatively, you might want to attest to workload identity in the cluster to a remote endpoint.
Leverage:
- OpenShift cert-manager Operator: You can use cert-manager to manage delegated CAs so that you can distribute trust across different clusters, or through your organization.
- Red Hat OpenShift Service Mesh: Can use SPIFFE to provide remote attestation of workloads to endpoints running in remote or local clusters.
Chapter 7. Configuring an Ingress Controller for manual DNS Management
As a cluster administrator, when you create an Ingress Controller, the Operator manages the DNS records automatically. This has some limitations when the required DNS zone is different from the cluster DNS zone or when the DNS zone is hosted outside the cloud provider.
As a cluster administrator, you can configure an Ingress Controller to stop automatic DNS management and start manual DNS management. Set dnsManagementPolicy to specify when it should be automatically or manually managed.
When you change an Ingress Controller from Managed to Unmanaged DNS management policy, the Operator does not clean up the previous wildcard DNS record provisioned on the cloud. When you change an Ingress Controller from Unmanaged to Managed DNS management policy, the Operator attempts to create the DNS record on the cloud provider if it does not exist or updates the DNS record if it already exists.
When you set dnsManagementPolicy to unmanaged, you have to manually manage the lifecycle of the wildcard DNS record on the cloud provider.
7.1. Managed DNS management policy
The Managed DNS management policy for Ingress Controllers ensures that the lifecycle of the wildcard DNS record on the cloud provider is automatically managed by the Operator.
7.2. Unmanaged DNS management policy
The Unmanaged DNS management policy for Ingress Controllers ensures that the lifecycle of the wildcard DNS record on the cloud provider is not automatically managed, instead it becomes the responsibility of the cluster administrator.
On the AWS cloud platform, if the domain on the Ingress Controller does not match with dnsConfig.Spec.BaseDomain then the DNS management policy is automatically set to Unmanaged.
7.3. Creating a custom Ingress Controller with the Unmanaged DNS management policy
As a cluster administrator, you can create a new custom Ingress Controller with the Unmanaged DNS management policy.
Prerequisites
-
Install the OpenShift CLI (
oc). -
Log in as a user with
cluster-adminprivileges.
Procedure
Create a custom resource (CR) file named
sample-ingress.yamlcontaining the following:apiVersion: operator.openshift.io/v1 kind: IngressController metadata: namespace: openshift-ingress-operator name: <name> spec: domain: <domain> endpointPublishingStrategy: type: LoadBalancerService loadBalancer: scope: External dnsManagementPolicy: Unmanagedwhere:
metadata.name-
Specify the
<name>with a name for theIngressControllerobject. spec.domain-
Specify the
domainbased on the DNS record that was created as a prerequisite. loadBalancer.scope-
Specify the
scopeasExternalto expose the load balancer externally.loadBalancer.dnsManagementPolicy: Specifies if the Ingress Controller is managing the lifecycle of the wildcard DNS record associated with the load balancer. The valid values areManagedandUnmanaged. The default value isManaged.
Save the file to apply the changes.
oc apply -f <name>.yaml1 Inspect the output and confirm that
dnsManagementPolicyis set toUnmanaged.
7.4. Modifying an existing Ingress Controller
As a cluster administrator, you can modify an existing Ingress Controller to manually manage the DNS record lifecycle.
Prerequisites
-
Install the OpenShift CLI (
oc). -
Log in as a user with
cluster-adminprivileges.
Procedure
Modify the chosen
IngressControllerto setdnsManagementPolicy:SCOPE=$(oc -n openshift-ingress-operator get ingresscontroller <name> -o=jsonpath="{.status.endpointPublishingStrategy.loadBalancer.scope}")oc -n openshift-ingress-operator patch ingresscontrollers/<name> --type=merge --patch='{"spec":{"endpointPublishingStrategy":{"type":"LoadBalancerService","loadBalancer":{"dnsManagementPolicy":"Unmanaged", "scope":"${SCOPE}"}}}}'- Optional: You can delete the associated DNS record in the cloud provider.
Chapter 8. Verifying connectivity to an endpoint
The Cluster Network Operator (CNO) runs a controller, the connectivity check controller, that performs a connection health check between resources within your cluster. By reviewing the results of the health checks, you can diagnose connection problems or eliminate network connectivity as the cause of an issue that you are investigating.
8.1. Connection health checks that are performed
To verify that cluster resources are reachable, a TCP connection is made to each of the following cluster API services:
- Kubernetes API server service
- Kubernetes API server endpoints
- OpenShift API server service
- OpenShift API server endpoints
- Load balancers
To verify that services and service endpoints are reachable on every node in the cluster, a TCP connection is made to each of the following targets:
- Health check target service
- Health check target endpoints
8.2. Implementation of connection health checks
The connectivity check controller orchestrates connection verification checks in your cluster. The results for the connection tests are stored in PodNetworkConnectivity objects in the openshift-network-diagnostics namespace. Connection tests are performed every minute in parallel.
The Cluster Network Operator (CNO) deploys several resources to the cluster to send and receive connectivity health checks:
- Health check source
-
This program deploys in a single pod replica set managed by a
Deploymentobject. The program consumesPodNetworkConnectivityobjects and connects to thespec.targetEndpointspecified in each object. - Health check target
- A pod deployed as part of a daemon set on every node in the cluster. The pod listens for inbound health checks. The presence of this pod on every node allows for the testing of connectivity to each node.
You can configure the nodes which network connectivity sources and targets run on with a node selector. Additionally, you can specify permissible tolerations for source and target pods. The configuration is defined in the singleton cluster custom resource of the Network API in the config.openshift.io/v1 API group.
Pod scheduling occurs after you have updated the configuration. Therefore, you must apply node labels that you intend to use in your selectors before updating the configuration. Labels applied after updating your network connectivity check pod placement are ignored.
Refer to the default configuration in the following YAML:
Default configuration for connectivity source and target pods
apiVersion: config.openshift.io/v1
kind: Network
metadata:
name: cluster
spec:
# ...
networkDiagnostics:
mode: "All"
sourcePlacement:
nodeSelector:
checkNodes: groupA
tolerations:
- key: myTaint
effect: NoSchedule
operator: Exists
targetPlacement:
nodeSelector:
checkNodes: groupB
tolerations:
- key: myOtherTaint
effect: NoExecute
operator: Exists- 1 1 1
- Specifies the network diagnostics configuration. If a value is not specified or an empty object is specified, and
spec.disableNetworkDiagnostics=trueis set in thenetwork.operator.openshift.iocustom resource namedcluster, network diagnostics are disabled. If set, this value overridesspec.disableNetworkDiagnostics=true. - 2
- Specifies the diagnostics mode. The value can be the empty string,
All, orDisabled. The empty string is equivalent to specifyingAll. - 3
- Optional: Specifies a selector for connectivity check source pods. You can use the
nodeSelectorandtolerationsfields to further specify thesourceNodepods. These are optional for both source and target pods. You can omit them, use both, or use only one of them. - 4
- Optional: Specifies a selector for connectivity check target pods. You can use the
nodeSelectorandtolerationsfields to further specify thetargetNodepods. These are optional for both source and target pods. You can omit them, use both, or use only one of them.
8.3. Configuring pod connectivity check placement
As a cluster administrator, you can configure which nodes the connectivity check pods run by modifying the network.config.openshift.io object named cluster.
Prerequisites
-
Install the OpenShift CLI (
oc).
Procedure
Edit the connectivity check configuration by entering the following command:
$ oc edit network.config.openshift.io cluster-
In the text editor, update the
networkDiagnosticsstanza to specify the node selectors that you want for the source and target pods. - Save your changes and exit the text editor.
Verification
- Verify that the source and target pods are running on the intended nodes by entering the following command:
$ oc get pods -n openshift-network-diagnostics -o wideExample output
NAME READY STATUS RESTARTS AGE IP NODE NOMINATED NODE READINESS GATES
network-check-source-84c69dbd6b-p8f7n 1/1 Running 0 9h 10.131.0.8 ip-10-0-40-197.us-east-2.compute.internal <none> <none>
network-check-target-46pct 1/1 Running 0 9h 10.131.0.6 ip-10-0-40-197.us-east-2.compute.internal <none> <none>
network-check-target-8kwgf 1/1 Running 0 9h 10.128.2.4 ip-10-0-95-74.us-east-2.compute.internal <none> <none>
network-check-target-jc6n7 1/1 Running 0 9h 10.129.2.4 ip-10-0-21-151.us-east-2.compute.internal <none> <none>
network-check-target-lvwnn 1/1 Running 0 9h 10.128.0.7 ip-10-0-17-129.us-east-2.compute.internal <none> <none>
network-check-target-nslvj 1/1 Running 0 9h 10.130.0.7 ip-10-0-89-148.us-east-2.compute.internal <none> <none>
network-check-target-z2sfx 1/1 Running 0 9h 10.129.0.4 ip-10-0-60-253.us-east-2.compute.internal <none> <none>8.4. PodNetworkConnectivityCheck object fields
The PodNetworkConnectivityCheck object fields are described in the following tables.
| Field | Type | Description |
|---|---|---|
|
|
|
The name of the object in the following format:
|
|
|
|
The namespace that the object is associated with. This value is always |
|
|
|
The name of the pod where the connection check originates, such as |
|
|
|
The target of the connection check, such as |
|
|
| Configuration for the TLS certificate to use. |
|
|
| The name of the TLS certificate used, if any. The default value is an empty string. |
|
|
| An object representing the condition of the connection test and logs of recent connection successes and failures. |
|
|
| The latest status of the connection check and any previous statuses. |
|
|
| Connection test logs from unsuccessful attempts. |
|
|
| Connect test logs covering the time periods of any outages. |
|
|
| Connection test logs from successful attempts. |
The following table describes the fields for objects in the status.conditions array:
| Field | Type | Description |
|---|---|---|
|
|
| The time that the condition of the connection transitioned from one status to another. |
|
|
| The details about last transition in a human readable format. |
|
|
| The last status of the transition in a machine readable format. |
|
|
| The status of the condition. |
|
|
| The type of the condition. |
The following table describes the fields for objects in the status.conditions array:
| Field | Type | Description |
|---|---|---|
|
|
| The timestamp from when the connection failure is resolved. |
|
|
| Connection log entries, including the log entry related to the successful end of the outage. |
|
|
| A summary of outage details in a human readable format. |
|
|
| The timestamp from when the connection failure is first detected. |
|
|
| Connection log entries, including the original failure. |
8.4.1. Connection log fields
The fields for a connection log entry are described in the following table. The object is used in the following fields:
-
status.failures[] -
status.successes[] -
status.outages[].startLogs[] -
status.outages[].endLogs[]
| Field | Type | Description |
|---|---|---|
|
|
| Records the duration of the action. |
|
|
| Provides the status in a human readable format. |
|
|
|
Provides the reason for status in a machine readable format. The value is one of |
|
|
| Indicates if the log entry is a success or failure. |
|
|
| The start time of connection check. |
8.5. Verifying network connectivity for an endpoint
As a cluster administrator, you can verify the connectivity of an endpoint, such as an API server, load balancer, service, or pod, and verify that network diagnostics is enabled.
Prerequisites
-
Install the OpenShift CLI (
oc). -
Access to the cluster as a user with the
cluster-adminrole.
Procedure
Confirm that network diagnostics are enable by entering the following command:
$ oc get network.config.openshift.io cluster -o yamlExample output
# ... status: # ... conditions: - lastTransitionTime: "2024-05-27T08:28:39Z" message: "" reason: AsExpected status: "True" type: NetworkDiagnosticsAvailableList the current
PodNetworkConnectivityCheckobjects by entering the following command:$ oc get podnetworkconnectivitycheck -n openshift-network-diagnosticsExample output
NAME AGE network-check-source-ci-ln-x5sv9rb-f76d1-4rzrp-worker-b-6xdmh-to-kubernetes-apiserver-endpoint-ci-ln-x5sv9rb-f76d1-4rzrp-master-0 75m network-check-source-ci-ln-x5sv9rb-f76d1-4rzrp-worker-b-6xdmh-to-kubernetes-apiserver-endpoint-ci-ln-x5sv9rb-f76d1-4rzrp-master-1 73m network-check-source-ci-ln-x5sv9rb-f76d1-4rzrp-worker-b-6xdmh-to-kubernetes-apiserver-endpoint-ci-ln-x5sv9rb-f76d1-4rzrp-master-2 75m network-check-source-ci-ln-x5sv9rb-f76d1-4rzrp-worker-b-6xdmh-to-kubernetes-apiserver-service-cluster 75m network-check-source-ci-ln-x5sv9rb-f76d1-4rzrp-worker-b-6xdmh-to-kubernetes-default-service-cluster 75m network-check-source-ci-ln-x5sv9rb-f76d1-4rzrp-worker-b-6xdmh-to-load-balancer-api-external 75m network-check-source-ci-ln-x5sv9rb-f76d1-4rzrp-worker-b-6xdmh-to-load-balancer-api-internal 75m network-check-source-ci-ln-x5sv9rb-f76d1-4rzrp-worker-b-6xdmh-to-network-check-target-ci-ln-x5sv9rb-f76d1-4rzrp-master-0 75m network-check-source-ci-ln-x5sv9rb-f76d1-4rzrp-worker-b-6xdmh-to-network-check-target-ci-ln-x5sv9rb-f76d1-4rzrp-master-1 75m network-check-source-ci-ln-x5sv9rb-f76d1-4rzrp-worker-b-6xdmh-to-network-check-target-ci-ln-x5sv9rb-f76d1-4rzrp-master-2 75m network-check-source-ci-ln-x5sv9rb-f76d1-4rzrp-worker-b-6xdmh-to-network-check-target-ci-ln-x5sv9rb-f76d1-4rzrp-worker-b-6xdmh 74m network-check-source-ci-ln-x5sv9rb-f76d1-4rzrp-worker-b-6xdmh-to-network-check-target-ci-ln-x5sv9rb-f76d1-4rzrp-worker-c-n8mbf 74m network-check-source-ci-ln-x5sv9rb-f76d1-4rzrp-worker-b-6xdmh-to-network-check-target-ci-ln-x5sv9rb-f76d1-4rzrp-worker-d-4hnrz 74m network-check-source-ci-ln-x5sv9rb-f76d1-4rzrp-worker-b-6xdmh-to-network-check-target-service-cluster 75m network-check-source-ci-ln-x5sv9rb-f76d1-4rzrp-worker-b-6xdmh-to-openshift-apiserver-endpoint-ci-ln-x5sv9rb-f76d1-4rzrp-master-0 75m network-check-source-ci-ln-x5sv9rb-f76d1-4rzrp-worker-b-6xdmh-to-openshift-apiserver-endpoint-ci-ln-x5sv9rb-f76d1-4rzrp-master-1 75m network-check-source-ci-ln-x5sv9rb-f76d1-4rzrp-worker-b-6xdmh-to-openshift-apiserver-endpoint-ci-ln-x5sv9rb-f76d1-4rzrp-master-2 74m network-check-source-ci-ln-x5sv9rb-f76d1-4rzrp-worker-b-6xdmh-to-openshift-apiserver-service-cluster 75mView the connection test logs:
- From the output of the previous command, identify the endpoint that you want to review the connectivity logs for.
View the object by entering the following command:
$ oc get podnetworkconnectivitycheck <name> \ -n openshift-network-diagnostics -o yamlwhere
<name>specifies the name of thePodNetworkConnectivityCheckobject.Example output
apiVersion: controlplane.operator.openshift.io/v1alpha1 kind: PodNetworkConnectivityCheck metadata: name: network-check-source-ci-ln-x5sv9rb-f76d1-4rzrp-worker-b-6xdmh-to-kubernetes-apiserver-endpoint-ci-ln-x5sv9rb-f76d1-4rzrp-master-0 namespace: openshift-network-diagnostics ... spec: sourcePod: network-check-source-7c88f6d9f-hmg2f targetEndpoint: 10.0.0.4:6443 tlsClientCert: name: "" status: conditions: - lastTransitionTime: "2021-01-13T20:11:34Z" message: 'kubernetes-apiserver-endpoint-ci-ln-x5sv9rb-f76d1-4rzrp-master-0: tcp connection to 10.0.0.4:6443 succeeded' reason: TCPConnectSuccess status: "True" type: Reachable failures: - latency: 2.241775ms message: 'kubernetes-apiserver-endpoint-ci-ln-x5sv9rb-f76d1-4rzrp-master-0: failed to establish a TCP connection to 10.0.0.4:6443: dial tcp 10.0.0.4:6443: connect: connection refused' reason: TCPConnectError success: false time: "2021-01-13T20:10:34Z" - latency: 2.582129ms message: 'kubernetes-apiserver-endpoint-ci-ln-x5sv9rb-f76d1-4rzrp-master-0: failed to establish a TCP connection to 10.0.0.4:6443: dial tcp 10.0.0.4:6443: connect: connection refused' reason: TCPConnectError success: false time: "2021-01-13T20:09:34Z" - latency: 3.483578ms message: 'kubernetes-apiserver-endpoint-ci-ln-x5sv9rb-f76d1-4rzrp-master-0: failed to establish a TCP connection to 10.0.0.4:6443: dial tcp 10.0.0.4:6443: connect: connection refused' reason: TCPConnectError success: false time: "2021-01-13T20:08:34Z" outages: - end: "2021-01-13T20:11:34Z" endLogs: - latency: 2.032018ms message: 'kubernetes-apiserver-endpoint-ci-ln-x5sv9rb-f76d1-4rzrp-master-0: tcp connection to 10.0.0.4:6443 succeeded' reason: TCPConnect success: true time: "2021-01-13T20:11:34Z" - latency: 2.241775ms message: 'kubernetes-apiserver-endpoint-ci-ln-x5sv9rb-f76d1-4rzrp-master-0: failed to establish a TCP connection to 10.0.0.4:6443: dial tcp 10.0.0.4:6443: connect: connection refused' reason: TCPConnectError success: false time: "2021-01-13T20:10:34Z" - latency: 2.582129ms message: 'kubernetes-apiserver-endpoint-ci-ln-x5sv9rb-f76d1-4rzrp-master-0: failed to establish a TCP connection to 10.0.0.4:6443: dial tcp 10.0.0.4:6443: connect: connection refused' reason: TCPConnectError success: false time: "2021-01-13T20:09:34Z" - latency: 3.483578ms message: 'kubernetes-apiserver-endpoint-ci-ln-x5sv9rb-f76d1-4rzrp-master-0: failed to establish a TCP connection to 10.0.0.4:6443: dial tcp 10.0.0.4:6443: connect: connection refused' reason: TCPConnectError success: false time: "2021-01-13T20:08:34Z" message: Connectivity restored after 2m59.999789186s start: "2021-01-13T20:08:34Z" startLogs: - latency: 3.483578ms message: 'kubernetes-apiserver-endpoint-ci-ln-x5sv9rb-f76d1-4rzrp-master-0: failed to establish a TCP connection to 10.0.0.4:6443: dial tcp 10.0.0.4:6443: connect: connection refused' reason: TCPConnectError success: false time: "2021-01-13T20:08:34Z" successes: - latency: 2.845865ms message: 'kubernetes-apiserver-endpoint-ci-ln-x5sv9rb-f76d1-4rzrp-master-0: tcp connection to 10.0.0.4:6443 succeeded' reason: TCPConnect success: true time: "2021-01-13T21:14:34Z" - latency: 2.926345ms message: 'kubernetes-apiserver-endpoint-ci-ln-x5sv9rb-f76d1-4rzrp-master-0: tcp connection to 10.0.0.4:6443 succeeded' reason: TCPConnect success: true time: "2021-01-13T21:13:34Z" - latency: 2.895796ms message: 'kubernetes-apiserver-endpoint-ci-ln-x5sv9rb-f76d1-4rzrp-master-0: tcp connection to 10.0.0.4:6443 succeeded' reason: TCPConnect success: true time: "2021-01-13T21:12:34Z" - latency: 2.696844ms message: 'kubernetes-apiserver-endpoint-ci-ln-x5sv9rb-f76d1-4rzrp-master-0: tcp connection to 10.0.0.4:6443 succeeded' reason: TCPConnect success: true time: "2021-01-13T21:11:34Z" - latency: 1.502064ms message: 'kubernetes-apiserver-endpoint-ci-ln-x5sv9rb-f76d1-4rzrp-master-0: tcp connection to 10.0.0.4:6443 succeeded' reason: TCPConnect success: true time: "2021-01-13T21:10:34Z" - latency: 1.388857ms message: 'kubernetes-apiserver-endpoint-ci-ln-x5sv9rb-f76d1-4rzrp-master-0: tcp connection to 10.0.0.4:6443 succeeded' reason: TCPConnect success: true time: "2021-01-13T21:09:34Z" - latency: 1.906383ms message: 'kubernetes-apiserver-endpoint-ci-ln-x5sv9rb-f76d1-4rzrp-master-0: tcp connection to 10.0.0.4:6443 succeeded' reason: TCPConnect success: true time: "2021-01-13T21:08:34Z" - latency: 2.089073ms message: 'kubernetes-apiserver-endpoint-ci-ln-x5sv9rb-f76d1-4rzrp-master-0: tcp connection to 10.0.0.4:6443 succeeded' reason: TCPConnect success: true time: "2021-01-13T21:07:34Z" - latency: 2.156994ms message: 'kubernetes-apiserver-endpoint-ci-ln-x5sv9rb-f76d1-4rzrp-master-0: tcp connection to 10.0.0.4:6443 succeeded' reason: TCPConnect success: true time: "2021-01-13T21:06:34Z" - latency: 1.777043ms message: 'kubernetes-apiserver-endpoint-ci-ln-x5sv9rb-f76d1-4rzrp-master-0: tcp connection to 10.0.0.4:6443 succeeded' reason: TCPConnect success: true time: "2021-01-13T21:05:34Z"
Chapter 9. Changing the MTU for the cluster network
As a cluster administrator, you can change the maximum transmission unit (MTU) for the cluster network after cluster installation. This change is disruptive as cluster nodes must be rebooted to finalize the MTU change.
You can change the MTU only for clusters that use the OVN-Kubernetes plugin or the OpenShift SDN network plugin.
9.1. About the cluster MTU
During installation, the cluster network maximum transmission unit (MTU) is set automatically based on the primary network interface MTU of cluster nodes. Typically, you do not need to override the detected MTU, but in some instances you must override it.
You might want to change the MTU of the cluster network for one of the following reasons:
- The MTU detected during cluster installation is not correct for your infrastructure.
- Your cluster infrastructure now requires a different MTU, such as from the addition of nodes that need a different MTU for optimal performance.
Only the OVN-Kubernetes network plugin supports changing the MTU value.
9.1.1. Service interruption considerations
When you initiate a maximum transmission unit (MTU) change on your cluster the following effects might impact service availability:
- At least two rolling reboots are required to complete the migration to a new MTU. During this time, some nodes are not available as they restart.
- Specific applications deployed to the cluster with shorter timeout intervals than the absolute TCP timeout interval might experience disruption during the MTU change.
9.1.2. MTU value selection
When planning your maximum transmission unit (MTU) migration there are two related but distinct MTU values to consider.
- Hardware MTU: This MTU value is set based on the specifics of your network infrastructure.
-
Cluster network MTU: This MTU value is always less than your hardware MTU to account for the cluster network overlay overhead. The specific overhead is determined by your network plugin. For OVN-Kubernetes, the overhead is
100bytes. For OpenShift SDN, the overhead is50bytes.
If your cluster requires different MTU values for different nodes, you must subtract the overhead value for your network plugin from the lowest MTU value that is used by any node in your cluster. For example, if some nodes in your cluster have an MTU of 9001, and some have an MTU of 1500, you must set this value to 1400.
To avoid selecting an MTU value that is not acceptable by a node, verify the maximum MTU value (maxmtu) that is accepted by the network interface by using the ip -d link command.
9.1.3. How the migration process works
The following table summarizes the migration process by segmenting between the user-initiated steps in the process and the actions that the migration performs in response.
| User-initiated steps | OpenShift Container Platform activity |
|---|---|
| Set the following values in the Cluster Network Operator configuration:
| Cluster Network Operator (CNO): Confirms that each field is set to a valid value.
If the values provided are valid, the CNO writes out a new temporary configuration with the MTU for the cluster network set to the value of the Machine Config Operator (MCO): Performs a rolling reboot of each node in the cluster. |
| Reconfigure the MTU of the primary network interface for the nodes on the cluster. You can use one of the following methods to accomplish this:
| N/A |
|
Set the | Machine Config Operator (MCO): Performs a rolling reboot of each node in the cluster with the new MTU configuration. |
9.2. Changing the cluster network MTU
As a cluster administrator, you can increase or decrease the maximum transmission unit (MTU) for your cluster.
You cannot roll back an MTU value for nodes during the MTU migration process, but you can roll back the value after the MTU migration process completes.
The migration is disruptive and nodes in your cluster might be temporarily unavailable as the MTU update takes effect.
The following procedures describe how to change the cluster network MTU by using machine configs, Dynamic Host Configuration Protocol (DHCP), or an ISO image. If you use either the DHCP or ISO approaches, you must refer to configuration artifacts that you kept after installing your cluster to complete the procedure.
Prerequisites
-
You have installed the OpenShift CLI (
oc). -
You have access to the cluster using an account with
cluster-adminpermissions. You have identified the target MTU for your cluster.
-
The MTU for the OVN-Kubernetes network plugin must be set to
100less than the lowest hardware MTU value in your cluster. -
The MTU for the OpenShift SDN network plugin must be set to
50less than the lowest hardware MTU value in your cluster.
-
The MTU for the OVN-Kubernetes network plugin must be set to
- If your nodes are physical machines, ensure that the cluster network and the connected network switches support jumbo frames.
- If your nodes are virtual machines (VMs), ensure that the hypervisor and the connected network switches support jumbo frames.
Procedure
To obtain the current MTU for the cluster network, enter the following command:
$ oc describe network.config clusterExample output
... Status: Cluster Network: Cidr: 10.217.0.0/22 Host Prefix: 23 Cluster Network MTU: 1400 Network Type: OVNKubernetes Service Network: 10.217.4.0/23 ...Prepare your configuration for the hardware MTU:
If your hardware MTU is specified with DHCP, update your DHCP configuration such as with the following dnsmasq configuration:
dhcp-option-force=26,<mtu>where:
<mtu>- Specifies the hardware MTU for the DHCP server to advertise.
- If your hardware MTU is specified with a kernel command line with PXE, update that configuration accordingly.
If your hardware MTU is specified in a NetworkManager connection configuration, complete the following steps. This approach is the default for OpenShift Container Platform if you do not explicitly specify your network configuration with DHCP, a kernel command line, or some other method. Your cluster nodes must all use the same underlying network configuration for the following procedure to work unmodified.
Find the primary network interface:
If you are using the OpenShift SDN network plugin, enter the following command:
$ oc debug node/<node_name> -- chroot /host ip route list match 0.0.0.0/0 | awk '{print $5 }'where:
<node_name>- Specifies the name of a node in your cluster.
If you are using the OVN-Kubernetes network plugin, enter the following command:
$ oc debug node/<node_name> -- chroot /host nmcli -g connection.interface-name c show ovs-if-phys0where:
<node_name>- Specifies the name of a node in your cluster.
Create the following NetworkManager configuration in the
<interface>-mtu.conffile:Example NetworkManager connection configuration
[connection-<interface>-mtu] match-device=interface-name:<interface> ethernet.mtu=<mtu>where:
<mtu>- Specifies the new hardware MTU value.
<interface>- Specifies the primary network interface name.
Create two
MachineConfigobjects, one for the control plane nodes and another for the worker nodes in your cluster:Create the following Butane config in the
control-plane-interface.bufile:NoteThe Butane version you specify in the config file should match the OpenShift Container Platform version and always ends in
0. For example,4.16.0. See "Creating machine configs with Butane" for information about Butane.variant: openshift version: 4.16.0 metadata: name: 01-control-plane-interface labels: machineconfiguration.openshift.io/role: master storage: files: - path: /etc/NetworkManager/conf.d/99-<interface>-mtu.conf1 contents: local: <interface>-mtu.conf2 mode: 0600Create the following Butane config in the
worker-interface.bufile:NoteThe Butane version you specify in the config file should match the OpenShift Container Platform version and always ends in
0. For example,4.16.0. See "Creating machine configs with Butane" for information about Butane.variant: openshift version: 4.16.0 metadata: name: 01-worker-interface labels: machineconfiguration.openshift.io/role: worker storage: files: - path: /etc/NetworkManager/conf.d/99-<interface>-mtu.conf1 contents: local: <interface>-mtu.conf2 mode: 0600Create
MachineConfigobjects from the Butane configs by running the following command:$ for manifest in control-plane-interface worker-interface; do butane --files-dir . $manifest.bu > $manifest.yaml doneWarningDo not apply these machine configs until explicitly instructed later in this procedure. Applying these machine configs now causes a loss of stability for the cluster.
To begin the MTU migration, specify the migration configuration by entering the following command. The Machine Config Operator performs a rolling reboot of the nodes in the cluster in preparation for the MTU change.
$ oc patch Network.operator.openshift.io cluster --type=merge --patch \ '{"spec": { "migration": { "mtu": { "network": { "from": <overlay_from>, "to": <overlay_to> } , "machine": { "to" : <machine_to> } } } } }'where:
<overlay_from>- Specifies the current cluster network MTU value.
<overlay_to>-
Specifies the target MTU for the cluster network. This value is set relative to the value of
<machine_to>. For OVN-Kubernetes, this value must be100less than the value of<machine_to>. For OpenShift SDN, this value must be50less than the value of<machine_to>. <machine_to>- Specifies the MTU for the primary network interface on the underlying host network.
Example that increases the cluster MTU
$ oc patch Network.operator.openshift.io cluster --type=merge --patch \ '{"spec": { "migration": { "mtu": { "network": { "from": 1400, "to": 9000 } , "machine": { "to" : 9100} } } } }'As the Machine Config Operator updates machines in each machine config pool, it reboots each node one by one. You must wait until all the nodes are updated. Check the machine config pool status by entering the following command:
$ oc get machineconfigpoolsA successfully updated node has the following status:
UPDATED=true,UPDATING=false,DEGRADED=false.NoteBy default, the Machine Config Operator updates one machine per pool at a time, causing the total time the migration takes to increase with the size of the cluster.
Confirm the status of the new machine configuration on the hosts:
To list the machine configuration state and the name of the applied machine configuration, enter the following command:
$ oc describe node | egrep "hostname|machineconfig"Example output
kubernetes.io/hostname=master-0 machineconfiguration.openshift.io/currentConfig: rendered-master-c53e221d9d24e1c8bb6ee89dd3d8ad7b machineconfiguration.openshift.io/desiredConfig: rendered-master-c53e221d9d24e1c8bb6ee89dd3d8ad7b machineconfiguration.openshift.io/reason: machineconfiguration.openshift.io/state: DoneVerify that the following statements are true:
-
The value of
machineconfiguration.openshift.io/statefield isDone. -
The value of the
machineconfiguration.openshift.io/currentConfigfield is equal to the value of themachineconfiguration.openshift.io/desiredConfigfield.
-
The value of
To confirm that the machine config is correct, enter the following command:
$ oc get machineconfig <config_name> -o yaml | grep ExecStartwhere
<config_name>is the name of the machine config from themachineconfiguration.openshift.io/currentConfigfield.The machine config must include the following update to the systemd configuration:
ExecStart=/usr/local/bin/mtu-migration.sh
Update the underlying network interface MTU value:
If you are specifying the new MTU with a NetworkManager connection configuration, enter the following command. The MachineConfig Operator automatically performs a rolling reboot of the nodes in your cluster.
$ for manifest in control-plane-interface worker-interface; do oc create -f $manifest.yaml done- If you are specifying the new MTU with a DHCP server option or a kernel command line and PXE, make the necessary changes for your infrastructure.
As the Machine Config Operator updates machines in each machine config pool, it reboots each node one by one. You must wait until all the nodes are updated. Check the machine config pool status by entering the following command:
$ oc get machineconfigpoolsA successfully updated node has the following status:
UPDATED=true,UPDATING=false,DEGRADED=false.NoteBy default, the Machine Config Operator updates one machine per pool at a time, causing the total time the migration takes to increase with the size of the cluster.
Confirm the status of the new machine configuration on the hosts:
To list the machine configuration state and the name of the applied machine configuration, enter the following command:
$ oc describe node | egrep "hostname|machineconfig"Example output
kubernetes.io/hostname=master-0 machineconfiguration.openshift.io/currentConfig: rendered-master-c53e221d9d24e1c8bb6ee89dd3d8ad7b machineconfiguration.openshift.io/desiredConfig: rendered-master-c53e221d9d24e1c8bb6ee89dd3d8ad7b machineconfiguration.openshift.io/reason: machineconfiguration.openshift.io/state: DoneVerify that the following statements are true:
-
The value of
machineconfiguration.openshift.io/statefield isDone. -
The value of the
machineconfiguration.openshift.io/currentConfigfield is equal to the value of themachineconfiguration.openshift.io/desiredConfigfield.
-
The value of
To confirm that the machine config is correct, enter the following command:
$ oc get machineconfig <config_name> -o yaml | grep path:where
<config_name>is the name of the machine config from themachineconfiguration.openshift.io/currentConfigfield.If the machine config is successfully deployed, the previous output contains the
/etc/NetworkManager/conf.d/99-<interface>-mtu.conffile path and theExecStart=/usr/local/bin/mtu-migration.shline.
Finalize the MTU migration for your plugin. In both example commands,
<mtu>specifies the new cluster network MTU that you specified with<overlay_to>.To finalize the MTU migration, enter the following command for the OVN-Kubernetes network plugin:
$ oc patch Network.operator.openshift.io cluster --type=merge --patch \ '{"spec": { "migration": null, "defaultNetwork":{ "ovnKubernetesConfig": { "mtu": <mtu> }}}}'To finalize the MTU migration, enter the following command for the OpenShift SDN network plugin:
$ oc patch Network.operator.openshift.io cluster --type=merge --patch \ '{"spec": { "migration": null, "defaultNetwork":{ "openshiftSDNConfig": { "mtu": <mtu> }}}}'
After finalizing the MTU migration, each machine config pool node is rebooted one by one. You must wait until all the nodes are updated. Check the machine config pool status by entering the following command:
$ oc get machineconfigpoolsA successfully updated node has the following status:
UPDATED=true,UPDATING=false,DEGRADED=false.
Verification
To get the current MTU for the cluster network, enter the following command:
$ oc describe network.config clusterGet the current MTU for the primary network interface of a node:
To list the nodes in your cluster, enter the following command:
$ oc get nodesTo obtain the current MTU setting for the primary network interface on a node, enter the following command:
$ oc debug node/<node> -- chroot /host ip address show <interface>where:
<node>- Specifies a node from the output from the previous step.
<interface>- Specifies the primary network interface name for the node.
Example output
ens3: <BROADCAST,MULTICAST,UP,LOWER_UP> mtu 8051
9.2.1. Checking the current cluster MTU value
To ensure network stability and performance in a hybrid environment where part of your cluster is in the cloud and part is an on-premise environment, you can obtain the current maximum transmission unit (MTU) for the cluster network.
Procedure
To obtain the current MTU for the cluster network, enter the following command:
$ oc describe network.config clusterExample output
... Status: Cluster Network: Cidr: 10.217.0.0/22 Host Prefix: 23 Cluster Network MTU: 1400 Network Type: OVNKubernetes Service Network: 10.217.4.0/23 ...
9.2.2. Preparing your hardware MTU configuration
To maintain network stability during an MTU change, you must prepare the configuration for your underlying hardware using a method such as DHCP, PXE, or NetworkManager. This preparation ensures that all cluster nodes are ready to accept the new MTU value before you apply the changes to the cluster network.
Procedure
Prepare your configuration for the hardware MTU:
If your hardware MTU is specified with DHCP, update your DHCP configuration such as with the following dnsmasq configuration:
dhcp-option-force=26,<mtu>where:
<mtu>- Specifies the hardware MTU for the DHCP server to advertise.
- If your hardware MTU is specified with a kernel command line with PXE, update that configuration accordingly.
- If your hardware MTU is specified in a NetworkManager connection configuration, complete the following steps. This approach is the default for OpenShift Container Platform if you do not explicitly specify your network configuration with DHCP, a kernel command line, or some other method. Your cluster nodes must all use the same underlying network configuration for the following procedure to work unmodified.
Find the primary network interface by entering the following command:
$ oc debug node/<node_name> -- chroot /host nmcli -g connection.interface-name c show ovs-if-phys0where:
<node_name>- Specifies the name of a node in your cluster.
Create the following
NetworkManagerconfiguration in the<interface>-mtu.conffile:[connection-<interface>-mtu] match-device=interface-name:<interface> ethernet.mtu=<mtu>where:
<interface>- Specifies the primary network interface name.
<mtu>- Specifies the new hardware MTU value.
-
If you used Kubernetes NMState to configure the
br-exbridge, use the Kubernetes NMState Operator to update the MTU for thebr-exbridge. Changing the MTU for this bridge in a.nmconnectionfile could lead to persistence issues as the Machine Config Operator (MCO) might overwrite the file.
9.2.3. Creating MachineConfig objects
To prepare your nodes for a hardware MTU change, you must create MachineConfig objects for both control plane and compute nodes. Creating these objects ensures that the updated network interface settings are ready for deployment without causing immediate cluster instability.
Procedure
Create two
MachineConfigobjects, one for the control plane nodes and another for the worker nodes in your cluster:Create the following Butane config in the
control-plane-interface.bufile:NoteThe Butane version you specify in the config file should match the OpenShift Container Platform version and always ends in
0. For example,4.16.0. See "Creating machine configs with Butane" for information about Butane.variant: openshift version: 4.16.0 metadata: name: 01-control-plane-interface labels: machineconfiguration.openshift.io/role: master storage: files: - path: /etc/NetworkManager/conf.d/99-<interface>-mtu.conf contents: local: <interface>-mtu.conf mode: 0600where:
storage.files.path-
Specifies the
NetworkManagerconnection name for the primary network interface. storage.files.local-
Specifies the local filename for the updated
NetworkManagerconfiguration file from an earlier step.
Create the following Butane config in the
worker-interface.bufile:NoteThe Butane version you specify in the config file should match the OpenShift Container Platform version and always ends in
0. For example,4.16.0. See "Creating machine configs with Butane" for information about Butane.variant: openshift version: 4.16.0 metadata: name: 01-worker-interface labels: machineconfiguration.openshift.io/role: worker storage: files: - path: /etc/NetworkManager/conf.d/99-<interface>-mtu.conf contents: local: <interface>-mtu.conf mode: 0600where:
storage.files.path-
Specifies the
NetworkManagerconnection name for the primary network interface. storage.files.local-
Specifies the local filename for the updated
NetworkManagerconfiguration file from an earlier step.
Create
MachineConfigobjects from the Butane configs by running the following command:$ for manifest in control-plane-interface worker-interface; do butane --files-dir . $manifest.bu > $manifest.yaml doneWarningDo not apply these machine configs until explicitly instructed later in this procedure. Applying these machine configs now causes a loss of stability for the cluster.
9.2.4. Beginning the MTU migration
Start the maximum transmission unit (MTU) migration by specifying the migration configuration for the cluster network and machine interfaces. The Machine Config Operator performs a rolling reboot of the nodes to prepare the cluster for the MTU change.
Procedure
To begin the MTU migration, specify the migration configuration by entering the following command. The Machine Config Operator performs a rolling reboot of the nodes in the cluster in preparation for the MTU change.
$ oc patch Network.operator.openshift.io cluster --type=merge --patch \ '{"spec": { "migration": { "mtu": { "network": { "from": <overlay_from>, "to": <overlay_to> } , "machine": { "to" : <machine_to> } } } } }'where:
<overlay_from>- Specifies the current cluster network MTU value.
<overlay_to>-
Specifies the target MTU for the cluster network. This value is set relative to the value of
<machine_to>. For OVN-Kubernetes, this value must be100less than the value of<machine_to>. <machine_to>- Specifies the MTU for the primary network interface on the underlying host network.
$ oc patch Network.operator.openshift.io cluster --type=merge --patch \ '{"spec": { "migration": { "mtu": { "network": { "from": 1400, "to": 9000 } , "machine": { "to" : 9100} } } } }'As the Machine Config Operator updates machines in each machine config pool, the Operator reboots each node one by one. You must wait until all the nodes are updated. Check the machine config pool status by entering the following command:
$ oc get machineconfigpoolsA successfully updated node has the following status:
UPDATED=true,UPDATING=false,DEGRADED=false.NoteBy default, the Machine Config Operator updates one machine per pool at a time, causing the total time the migration takes to increase with the size of the cluster.
9.2.5. Verifying the machine configuration
Verify the machine configuration on your hosts to confirm that the maximum transmission unit (MTU) migration applied successfully. Checking the configuration state and system settings help ensures that the nodes use the correct migration script.
Procedure
Confirm the status of the new machine configuration on the hosts:
To list the machine configuration state and the name of the applied machine configuration, enter the following command:
$ oc describe node | egrep "hostname|machineconfig"Example output
kubernetes.io/hostname=master-0 machineconfiguration.openshift.io/currentConfig: rendered-master-c53e221d9d24e1c8bb6ee89dd3d8ad7b machineconfiguration.openshift.io/desiredConfig: rendered-master-c53e221d9d24e1c8bb6ee89dd3d8ad7b machineconfiguration.openshift.io/reason: machineconfiguration.openshift.io/state: DoneVerify that the following statements are true:
-
The value of
machineconfiguration.openshift.io/statefield isDone. -
The value of the
machineconfiguration.openshift.io/currentConfigfield is equal to the value of themachineconfiguration.openshift.io/desiredConfigfield.
-
The value of
To confirm that the machine config is correct, enter the following command:
$ oc get machineconfig <config_name> -o yaml | grep ExecStartwhere:
<config_name>-
Specifies the name of the machine config from the
machineconfiguration.openshift.io/currentConfigfield.
The machine config must include the following update to the systemd configuration:
ExecStart=/usr/local/bin/mtu-migration.sh
9.2.6. Applying the new hardware MTU value
To ensure consistent network communication across your cluster, you must apply the new hardware maximum transmission unit (MTU) value to your nodes. This process involves updating the underlying network interfaces and verifying that the Machine Config Operator successfully reboots and updates each node.
Procedure
Update the underlying network interface MTU value:
If you are specifying the new MTU with a NetworkManager connection configuration, enter the following command. The MachineConfig Operator automatically performs a rolling reboot of the nodes in your cluster.
$ for manifest in control-plane-interface worker-interface; do oc create -f $manifest.yaml done- If you are specifying the new MTU with a DHCP server option or a kernel command line and PXE, make the necessary changes for your infrastructure.
As the Machine Config Operator updates machines in each machine config pool, the Operator reboots each node one by one. You must wait until all the nodes are updated. Check the machine config pool status by entering the following command:
$ oc get machineconfigpoolsA successfully updated node has the following status:
UPDATED=true,UPDATING=false,DEGRADED=false.NoteBy default, the Machine Config Operator updates one machine per pool at a time, causing the total time the migration takes to increase with the size of the cluster.
Confirm the status of the new machine configuration on the hosts:
To list the machine configuration state and the name of the applied machine configuration, enter the following command:
$ oc describe node | egrep "hostname|machineconfig"Example output
kubernetes.io/hostname=master-0 machineconfiguration.openshift.io/currentConfig: rendered-master-c53e221d9d24e1c8bb6ee89dd3d8ad7b machineconfiguration.openshift.io/desiredConfig: rendered-master-c53e221d9d24e1c8bb6ee89dd3d8ad7b machineconfiguration.openshift.io/reason: machineconfiguration.openshift.io/state: DoneVerify that the following statements are true:
-
The value of
machineconfiguration.openshift.io/statefield isDone. -
The value of the
machineconfiguration.openshift.io/currentConfigfield is equal to the value of themachineconfiguration.openshift.io/desiredConfigfield.
-
The value of
To confirm that the machine config is correct, enter the following command:
$ oc get machineconfig <config_name> -o yaml | grep path:where:
<config_name>-
Specifies the name of the machine config from the
machineconfiguration.openshift.io/currentConfigfield.
If the machine config is successfully deployed, the previous output contains the
/etc/NetworkManager/conf.d/99-<interface>-mtu.conffile path and theExecStart=/usr/local/bin/mtu-migration.shline.
9.2.7. Finalizing the MTU migration
Finalize the MTU migration to apply the new maximum transmission unit (MTU) settings to the OVN-Kubernetes network plugin. This updates the cluster configuration and triggers a rolling reboot of the nodes to complete the process.
Procedure
To finalize the MTU migration, enter the following command for the OVN-Kubernetes network plugin:
$ oc patch Network.operator.openshift.io cluster --type=merge --patch \ '{"spec": { "migration": null, "defaultNetwork":{ "ovnKubernetesConfig": { "mtu": <mtu> }}}}'where:
<mtu>-
Specifies the new cluster network MTU that you specified with
<overlay_to>.
After finalizing the MTU migration, each machine config pool node is rebooted one by one. You must wait until all the nodes are updated. Check the machine config pool status by entering the following command:
$ oc get machineconfigpoolsA successfully updated node has the following status:
UPDATED=true,UPDATING=false,DEGRADED=false.
Verification
To get the current MTU for the cluster network, enter the following command:
$ oc describe network.config clusterGet the current MTU for the primary network interface of a node:
To list the nodes in your cluster, enter the following command:
$ oc get nodesTo obtain the current MTU setting for the primary network interface on a node, enter the following command:
$ oc adm node-logs <node> -u ovs-configuration | grep configure-ovs.sh | grep mtu | grep <interface> | head -1where:
<node>- Specifies a node from the output from the previous step.
<interface>- Specifies the primary network interface name for the node.
Example output
ens3: <BROADCAST,MULTICAST,UP,LOWER_UP> mtu 8051
Chapter 10. Configuring the node port service range
To meet your cluster node port requirements in OpenShift Container Platform, you can configure the node port service range during installation or expand it after installation. You can expand the default range of 30000-32768 on either side while preserving this default range within your new configuration.
Red Hat has not performed testing outside the default port range of 30000-32768. For ranges outside the default port range, ensure that you test to verify the expanding node port range does not impact your cluster. In particular, ensure that there is:
- No overlap with any ports already in use by host processes
- No overlap with any ports already in use by pods that are configured with host networking
If you expanded the range and a port allocation issue occurs, create a new cluster and set the required range for it.
If you expand the node port range and OpenShift CLI (oc) stops working because of a port conflict with the OpenShift Container Platform API server, you must create a new cluster.
10.1. Expanding the node port range
To expand the node port range for your OpenShift Container Platform cluster after installation, you can use the oc patch command to update the serviceNodePortRange parameter. You can expand the range on either side, but you cannot shrink it after installation.
Red Hat has not performed testing outside the default port range of 30000-32768. For ranges outside the default port range, ensure that you test to verify that expanding your node port range does not impact your cluster. If you expanded the range and a port allocation issue occurs, create a new cluster and set the required range for it.
When expanding the serviceNodePortRange parameter, ensure the value you set for the parameter does not overlap with the ephemeral port range, net.ipv4.ip_local_port_range, of the kernel.
OVN-Kubernetes uses this ephemeral range for source network address translation (SNAT) source port selection on outbound pod traffic. When a SNAT source port coincides with a node port number, return traffic can be misrouted, causing intermittent outbound TCP connection timeouts.
For more information, see "Safe and unsafe sysctls" in the Additional resources section.
Prerequisites
-
Installed the OpenShift CLI (
oc). -
Logged in to the cluster as a user with
cluster-adminprivileges. -
You ensured that your cluster infrastructure allows access to the ports that exist in the extended range. For example, if you expand the node port range to
30000-32900, your firewall or packet filtering configuration must allow the inclusive port range of30000-32900.
Procedure
To expand the range for the
serviceNodePortRangeparameter in thenetwork.config.openshift.ioobject that your cluster uses to manage traffic for pods, enter the following command:$ oc patch network.config.openshift.io cluster --type=merge -p \ '{ "spec": { "serviceNodePortRange": "<port_range>" } }'where:
<port_range>-
Specifies the expanded range, such as
30000-32900.
TipYou can also apply the following YAML to update the node port range:
apiVersion: config.openshift.io/v1 kind: Network metadata: name: cluster spec: serviceNodePortRange: "<port_range>" # ...Example output
network.config.openshift.io/cluster patched
Verification
To confirm that the updated configuration is active, enter the following command. The update can take several minutes to apply.
$ oc get configmaps -n openshift-kube-apiserver config \ -o jsonpath="{.data['config\.yaml']}" | \ grep -Eo '"service-node-port-range":["[[:digit:]]+-[[:digit:]]+"]'Example output
"service-node-port-range":["30000-32900"]
Chapter 11. Configuring the cluster network range
To expand the cluster network range in OpenShift Container Platform to support more nodes and IP addresses, you can modify the cluster network CIDR mask after cluster installation. This procedure requires the OVN-Kubernetes network plugin and provides more IP space for additional nodes.
For example, if you deployed a cluster and specified 10.128.0.0/19 as the cluster network range and a host prefix of 23, you are limited to 16 nodes. You can expand that to 510 nodes by changing the CIDR mask on a cluster to /14.
The following limitations apply when modifying the cluster network IP address range:
- The CIDR mask size specified must always be smaller than the currently configured CIDR mask size, because you can only increase IP space by adding more nodes to an installed cluster
- The host prefix cannot be modified
- Pods that are configured with an overridden default gateway must be recreated after the cluster network expands
11.1. Expanding the cluster network IP address range
To expand the cluster network IP address range in OpenShift Container Platform to support more nodes, you can modify the cluster network CIDR mask using the oc patch command.
This change requires rolling out a new Operator configuration across the cluster, and can take up to 30 minutes to take effect.
Prerequisites
-
You have installed the OpenShift CLI (
oc). -
You have logged in to the cluster with a user with
cluster-adminprivileges. - You have ensured that the cluster uses the OVN-Kubernetes network plugin.
Procedure
To obtain the cluster network range and host prefix for your cluster, enter the following command:
$ oc get network.operator.openshift.io \ -o jsonpath="{.items[0].spec.clusterNetwork}"Example output
[{"cidr":"10.217.0.0/22","hostPrefix":23}]To expand the cluster network IP address range, enter the following command. Use the CIDR IP address range and host prefix returned from the output of the previous command.
$ oc patch Network.config.openshift.io cluster --type='merge' --patch \ '{ "spec":{ "clusterNetwork": [ {"cidr":"<network>/<cidr>","hostPrefix":<prefix>} ], "networkType": "OVNKubernetes" } }'where:
<network>-
Specifies the network part of the
cidrfield that you obtained from the previous step. You cannot change this value. <cidr>-
Specifies the network prefix length. For example,
14. Change this value to a smaller number than the value from the output in the previous step to expand the cluster network range. <prefix>-
Specifies the current host prefix for your cluster. This value must be the same value for the
hostPrefixfield that you obtained from the previous step.
Example command
$ oc patch Network.config.openshift.io cluster --type='merge' --patch \ '{ "spec":{ "clusterNetwork": [ {"cidr":"10.217.0.0/14","hostPrefix": 23} ], "networkType": "OVNKubernetes" } }'Example output
network.config.openshift.io/cluster patchedTo confirm that the configuration is active, enter the following command. It can take up to 30 minutes for this change to take effect.
$ oc get network.operator.openshift.io \ -o jsonpath="{.items[0].spec.clusterNetwork}"Example output
[{"cidr":"10.217.0.0/14","hostPrefix":23}]
Chapter 12. Configuring IP failover
To provide high availability for Virtual IP addresses and ensure services remain accessible when nodes fail in OpenShift Container Platform, you can configure IP failover using Keepalived.
IP failover uses Keepalived to host a set of externally accessible Virtual IP (VIP) addresses on a set of hosts. Each VIP address is only serviced by a single host at a time. Keepalived uses the Virtual Router Redundancy Protocol (VRRP) to determine which host, from the set of hosts, services which VIP. If a host becomes unavailable, or if the service that Keepalived is watching does not respond, the VIP is switched to another host from the set. This means a VIP is always serviced as long as a host is available.
Every VIP in the set is serviced by a node selected from the set. If a single node is available, the VIPs are served. There is no way to explicitly distribute the VIPs over the nodes, so there can be nodes with no VIPs and other nodes with many VIPs. If there is only one node, all VIPs are on it.
The administrator must ensure that all of the VIP addresses meet the following requirements:
- Accessible on the configured hosts from outside the cluster.
- Not used for any other purpose within the cluster.
Keepalived on each node determines whether the needed service is running. If it is, VIPs are supported and Keepalived participates in the negotiation to determine which node serves the VIP. For a node to participate, the service must be listening on the watch port on a VIP or the check must be disabled.
Each VIP in the set might be served by a different node.
IP failover monitors a port on each VIP to determine whether the port is reachable on the node. If the port is not reachable, the VIP is not assigned to the node. If the port is set to 0, this check is suppressed. The check script does the needed testing.
When a node running Keepalived passes the check script, the VIP on that node can enter the master state based on its priority and the priority of the current master and as determined by the preemption strategy.
A cluster administrator can provide a script through the OPENSHIFT_HA_NOTIFY_SCRIPT variable, and this script is called whenever the state of the VIP on the node changes. Keepalived uses the master state when it is servicing the VIP, the backup state when another node is servicing the VIP, or in the fault state when the check script fails. The notify script is called with the new state whenever the state changes.
You can create an IP failover deployment configuration on OpenShift Container Platform. The IP failover deployment configuration specifies the set of VIP addresses, and the set of nodes on which to service them. A cluster can have multiple IP failover deployment configurations, with each managing its own set of unique VIP addresses. Each node in the IP failover configuration runs an IP failover pod, and this pod runs Keepalived.
When using VIPs to access a pod with host networking, the application pod runs on all nodes that are running the IP failover pods. This enables any of the IP failover nodes to become the master and service the VIPs when needed. If application pods are not running on all nodes with IP failover, either some IP failover nodes never service the VIPs or some application pods never receive any traffic. Use the same selector and replication count, for both IP failover and the application pods, to avoid this mismatch.
While using VIPs to access a service, any of the nodes can be in the IP failover set of nodes, since the service is reachable on all nodes, no matter where the application pod is running. Any of the IP failover nodes can become master at any time. The service can either use external IPs and a service port or it can use a NodePort. Setting up a NodePort is a privileged operation.
When using external IPs in the service definition, the VIPs are set to the external IPs, and the IP failover monitoring port is set to the service port. When using a node port, the port is open on every node in the cluster, and the service load-balances traffic from whatever node currently services the VIP. In this case, the IP failover monitoring port is set to the NodePort in the service definition.
Even though a service VIP is highly available, performance can still be affected. Keepalived makes sure that each of the VIPs is serviced by some node in the configuration, and several VIPs can end up on the same node even when other nodes have none. Strategies that externally load-balance across a set of VIPs can be thwarted when IP failover puts multiple VIPs on the same node.
When you use ExternalIP, you can set up IP failover to have the same VIP range as the ExternalIP range. You can also disable the monitoring port. In this case, all of the VIPs appear on same node in the cluster. Any user can set up a service with an ExternalIP and make it highly available.
There are a maximum of 254 VIPs in the cluster.
12.1. IP failover environment variables
The IP failover environment variables reference lists all variables you can use to configure IP failover in OpenShift Container Platform, including VIP addresses, monitoring ports, and network interfaces.
| Variable Name | Default | Description |
|---|---|---|
|
|
|
The IP failover pod tries to open a TCP connection to this port on each Virtual IP (VIP). If connection is established, the service is considered to be running. If this port is set to |
|
|
The interface name that IP failover uses to send Virtual Router Redundancy Protocol (VRRP) traffic. The default value is
If your cluster uses the OVN-Kubernetes network plugin, set this value to | |
|
|
|
The number of replicas to create. This must match |
|
|
The list of IP address ranges to replicate. This must be provided. For example, | |
|
|
|
The offset value used to set the virtual router IDs. Using different offset values allows multiple IP failover configurations to exist within the same cluster. The default offset is |
|
|
The number of groups to create for VRRP. If not set, a group is created for each virtual IP range specified with the | |
|
| INPUT |
The name of the iptables chain, to automatically add an |
|
| The full path name in the pod file system of a script that is periodically run to verify the application is operating. | |
|
|
| The period, in seconds, that the check script is run. |
|
| The full path name in the pod file system of a script that is run whenever the state changes. | |
|
|
|
The strategy for handling a new higher priority host. The |
12.2. Configuring IP failover in your cluster
To configure IP failover in your OpenShift Container Platform cluster and provide high availability for Virtual IP addresses, you can create a deployment that runs Keepalived on selected nodes to monitor services and fail over VIPs when nodes become unavailable.
The IP failover deployment ensures that a failover pod runs on each of the nodes matching the constraints or the label used. The pod, which runs Keepalived, can monitor an endpoint and use Virtual Router Redundancy Protocol (VRRP) to fail over the virtual IP (VIP) from one node to another if the first node cannot reach the service or endpoint.
For production use, set a selector that selects at least two nodes, and set replicas equal to the number of selected nodes.
Prerequisites
-
You have logged in to the cluster as a user with
cluster-adminprivileges. - You have created a pull secret.
Red Hat OpenStack Platform (RHOSP) only:
- You have installed an RHOSP client (RHCOS documentation) on the target environment.
-
You have downloaded the RHOSP
openrc.shrc file (RHCOS documentation).
Procedure
Create an IP failover service account:
$ oc create sa ipfailoverUpdate security context constraints (SCC) for
hostNetwork:$ oc adm policy add-scc-to-user privileged -z ipfailover$ oc adm policy add-scc-to-user hostnetwork -z ipfailoverRed Hat OpenStack Platform (RHOSP) only: Complete the following steps to make a failover VIP address reachable on RHOSP ports.
Use the RHOSP CLI to show the default RHOSP API and VIP addresses in the
allowed_address_pairsparameter of your RHOSP cluster:$ openstack port show <cluster_name> -c allowed_address_pairsOutput example
*Field* *Value* allowed_address_pairs ip_address='192.168.0.5', mac_address='fa:16:3e:31:f9:cb' ip_address='192.168.0.7', mac_address='fa:16:3e:31:f9:cb'Set a different VIP address for the IP failover deployment and make the address reachable on RHOSP ports by entering the following command in the RHOSP CLI. Do not set any default RHOSP API and VIP addresses as the failover VIP address for the IP failover deployment.
Example of adding the
1.1.1.1failover IP address as an allowed address on RHOSP ports.$ openstack port set <cluster_name> --allowed-address ip-address=1.1.1.1,mac-address=fa:fa:16:3e:31:f9:cb- Create a deployment YAML file to configure IP failover for your deployment. See "Example deployment YAML for IP failover configuration" in a later step.
Specify the following specification in the IP failover deployment so that you pass the failover VIP address to the
OPENSHIFT_HA_VIRTUAL_IPSenvironment variable:Example of adding the
1.1.1.1VIP address toOPENSHIFT_HA_VIRTUAL_IPSapiVersion: apps/v1 kind: Deployment metadata: name: ipfailover-keepalived # ... spec: env: - name: OPENSHIFT_HA_VIRTUAL_IPS value: "1.1.1.1" # ...
Create a deployment YAML file to configure IP failover.
NoteFor Red Hat OpenStack Platform (RHOSP), you do not need to re-create the deployment YAML file. You already created this file as part of the earlier instructions.
Example deployment YAML for IP failover configuration
apiVersion: apps/v1 kind: Deployment metadata: name: ipfailover-keepalived labels: ipfailover: hello-openshift spec: strategy: type: Recreate replicas: 2 selector: matchLabels: ipfailover: hello-openshift template: metadata: labels: ipfailover: hello-openshift spec: serviceAccountName: ipfailover privileged: true hostNetwork: true nodeSelector: node-role.kubernetes.io/worker: "" containers: - name: openshift-ipfailover image: registry.redhat.io/openshift4/ose-keepalived-ipfailover-rhel9:v4.16 ports: - containerPort: 63000 hostPort: 63000 imagePullPolicy: IfNotPresent securityContext: privileged: true volumeMounts: - name: lib-modules mountPath: /lib/modules readOnly: true - name: host-slash mountPath: /host readOnly: true mountPropagation: HostToContainer - name: etc-sysconfig mountPath: /etc/sysconfig readOnly: true - name: config-volume mountPath: /etc/keepalive env: - name: OPENSHIFT_HA_CONFIG_NAME value: "ipfailover" - name: OPENSHIFT_HA_VIRTUAL_IPS value: "1.1.1.1-2" - name: OPENSHIFT_HA_VIP_GROUPS value: "10" - name: OPENSHIFT_HA_NETWORK_INTERFACE value: "ens3" #The host interface to assign the VIPs - name: OPENSHIFT_HA_MONITOR_PORT value: "30060" - name: OPENSHIFT_HA_VRRP_ID_OFFSET value: "0" - name: OPENSHIFT_HA_REPLICA_COUNT value: "2" #Must match the number of replicas in the deployment - name: OPENSHIFT_HA_USE_UNICAST value: "false" #- name: OPENSHIFT_HA_UNICAST_PEERS #value: "10.0.148.40,10.0.160.234,10.0.199.110" - name: OPENSHIFT_HA_IPTABLES_CHAIN value: "INPUT" #- name: OPENSHIFT_HA_NOTIFY_SCRIPT # value: /etc/keepalive/mynotifyscript.sh - name: OPENSHIFT_HA_CHECK_SCRIPT value: "/etc/keepalive/mycheckscript.sh" - name: OPENSHIFT_HA_PREEMPTION value: "preempt_delay 300" - name: OPENSHIFT_HA_CHECK_INTERVAL value: "2" livenessProbe: initialDelaySeconds: 10 exec: command: - pgrep - keepalived volumes: - name: lib-modules hostPath: path: /lib/modules - name: host-slash hostPath: path: / - name: etc-sysconfig hostPath: path: /etc/sysconfig # config-volume contains the check script # created with `oc create configmap keepalived-checkscript --from-file=mycheckscript.sh` - configMap: defaultMode: 0755 name: keepalived-checkscript name: config-volume imagePullSecrets: - name: openshift-pull-secretwhere:
ipfailover-keepalived- Specifies the name of the IP failover deployment.
OPENSHIFT_HA_VIRTUAL_IPS-
Specifies the lis t of IP address ranges to replicate. This must be provided. For example,
1.2.3.4-6,1.2.3.9. OPENSHIFT_HA_VIP_GROUPS-
Specifies the number of groups to create for VRRP. If not set, a group is created for each virtual IP range specified with the
OPENSHIFT_HA_VIP_GROUPSvariable. OPENSHIFT_HA_NETWORK_INTERFACE-
Specifies the interface name that IP failover uses to send VRRP traffic. By default,
eth0is used. OPENSHIFT_HA_MONITOR_PORT-
Specifies the IP failover pod tries to open a TCP connection to this port on each VIP. If connection is established, the service is considered to be running. If this port is set to
0, the test always passes. The default value is80. OPENSHIFT_HA_VRRP_ID_OFFSET-
Specifies the offset value used to set the virtual router IDs. Using different offset values allows multiple IP failover configurations to exist within the same cluster. The default offset is
10, and the allowed range is0through255. OPENSHIFT_HA_REPLICA_COUNT-
Specifies the number of replicas to create. This must match
spec.replicasvalue in IP failover configuration. The default value is2. OPENSHIFT_HA_USE_UNICAST-
Specifies whether to use unicast mode for VRRP. The default value is
false. OPENSHIFT_HA_UNICAST_PEERS-
Specifies the list of IP addresses of the unicast peers. This must be provided if
OPENSHIFT_HA_USE_UNICASTis set totrue. OPENSHIFT_HA_IPTABLES_CHAIN-
Specifies the name of the
iptableschain to automatically add aniptablesrule to allow the VRRP traffic on. If the value is not set, aniptablesrule is not added. If the chain does not exist, it is not created, and Keepalived operates in unicast mode. The default isINPUT. OPENSHIFT_HA_NOTIFY_SCRIPT- Specifies the full path name in the pod file system of a script that is run whenever the state changes.
OPENSHIFT_HA_CHECK_SCRIPT- Specifies the full path name in the pod file system of a script that is periodically run to verify the application is operating.
OPENSHIFT_HA_PREEMPTION-
Specifies the strategy for handling a new higher priority host. The default value is
preempt_delay 300, which causes a Keepalived instance to take over a VIP after 5 minutes if a lower-priority master is holding the VIP. OPENSHIFT_HA_CHECK_INTERVAL-
Specifies the period, in seconds, that the check script is run. The default value is
2. openshift-pull-secret- Specifies the name of the pull secret to use for the IP failover deployment. Create the pull secret before creating the deployment, otherwise you will get an error when creating the deployment.
12.3. Configuring check and notify scripts
To customize health monitoring for IP failover and receive notifications when VIP state changes in OpenShift Container Platform, you can configure check and notify scripts by using ConfigMap objects.
The check and notify scripts run inside the IP failover pod and use the pod file system rather than the host file system. The host file system is available to the pod under the /hosts mount path. When configuring a check or notify script, you must provide the full path to the script.
Each IP failover pod manages a Keepalived daemon that controls one or more virtual IP (VIP) addresses on the node where the pod is running. Keepalived tracks the state of each VIP on the node, which can be master, backup, or fault.
The full path names of the check and notify scripts are added to the Keepalived configuration file, /etc/keepalived/keepalived.conf, which is loaded each time Keepalived starts. You add the scripts to the pod by using a ConfigMap object, as described in the following sections.
- Check script
Keepalived monitors application health by periodically running an optional, user-supplied check script. For example, the script can test a web server by issuing a request and verifying the response. If you do not provide a check script, Keepalived runs a default script that tests the TCP connection. This default test is suppressed when the monitor port is set to
0.If the check script returns a non-zero value, the node enters the
backupstate and any VIPs that it holds are reassigned.- Notify script
As a cluster administrator, you can provide an optional notify script that Keepalived calls whenever the VIP state changes. Keepalived passes the following parameters to the notify script:
-
$1—grouporinstance -
$2— Name of thegrouporinstance -
$3— New state:master,backup, orfault
-
Prerequisites
-
You installed the OpenShift CLI (
oc). -
You are logged in to the cluster with a user with
cluster-adminprivileges.
Procedure
Create the desired script and create a
ConfigMapobject to hold it. The script has no input arguments and must return0forOKand1forfail.The check script,
mycheckscript.sh:#!/bin/bash # Whatever tests are needed # E.g., send request and verify response exit 0Create the
ConfigMapobject by running the following command:$ oc create configmap mycustomcheck --from-file=mycheckscript.shAdd the script to the pod. The
defaultModefor the mountedConfigMapobject files must able to run by usingoccommands or by editing the IP failover configuration.Add the script to the pod by running the following command. A value of
0755,493decimal, is typical. For example:$ oc set env deploy/ipfailover-keepalived \ OPENSHIFT_HA_CHECK_SCRIPT=/etc/keepalive/mycheckscript.sh$ oc set volume deploy/ipfailover-keepalived --add --overwrite \ --name=config-volume \ --mount-path=/etc/keepalive \ --source='{"configMap": { "name": "mycustomcheck", "defaultMode": 493}}'NoteThe
oc set envcommand is whitespace sensitive. There must be no whitespace on either side of the=sign.Alternatively, edit the
ipfailover-keepalivedconfiguration by running the following command:$ oc edit deploy ipfailover-keepalivedExample
ipfailover-keepalivedconfigurationspec: containers: - env: - name: OPENSHIFT_HA_CHECK_SCRIPT value: /etc/keepalive/mycheckscript.sh ... volumeMounts: - mountPath: /etc/keepalive name: config-volume dnsPolicy: ClusterFirst ... volumes: - configMap: defaultMode: 0755 name: customrouter name: config-volume ...where:
spec.container.env.name-
Specifies the
OPENSHIFT_HA_CHECK_SCRIPTenvironment variable to point to the mounted script file. spec.container.volumeMounts-
Specifies the
spec.container.volumeMountsfield to create the mount point. spec.volumes-
Specifies a new
spec.volumesfield to mention the config map. spec.volumes.configMap.defaultMode-
Specifies run permission on the files. When read back, it is displayed in decimal,
493.
-
Save the changes and exit the editor. This restarts the
ipfailover-keepalivedconfiguration.
12.4. Configuring VRRP preemption
To control VIP preemption behavior when nodes recover in OpenShift Container Platform, you can configure the OPENSHIFT_HA_PREEMPTION variable to set a delay before higher priority VIPs take over or disable preemption entirely.
When a virtual IP (VIP) on a node recovers from the fault state, it enters the backup state if it has a lower priority than the VIP currently in the master state.
There are two options for the OPENSHIFT_HA_PREEMPTION variable:
-
nopreempt: When set, themasterrole does not move from a lower-priority VIP to a higher-priority VIP. -
preempt_delay 300: When set, Keepalived waits 300 seconds before moving themasterrole to the higher-priority VIP.
In the following example, the OPENSHIFT_HA_PREEMPTION value is set to preempt_delay 300.
Procedure
To specify preemption enter
oc edit deploy ipfailover-keepalivedto edit the router deployment configuration:$ oc edit deploy ipfailover-keepalived# ... spec: containers: - env: - name: OPENSHIFT_HA_PREEMPTION value: preempt_delay 300 #...
12.5. Deploying multiple IP failover instances
When deploying multiple IP failover instances in OpenShift Container Platform, each Keepalived daemon assigns unique VRRP IDs to virtual IP addresses. Configure the OPENSHIFT_HA_VRRP_ID_OFFSET variable to prevent VRRP ID range overlaps between different IP failover configurations.
Each IP failover pod created by an IP failover configuration (one pod per node or replica) runs a Keepalived daemon. When multiple IP failover configurations are present, additional pods are created, and their Keepalived daemons participate together in Virtual Router Redundancy Protocol (VRRP) negotiation. This negotiation determines which node services each virtual IP (VIP).
For each VIP, Keepalived assigns a unique internal vrrp-id. During VRRP negotiation, these vrrp-id values are used to select the node that services the corresponding VIP.
The IP failover pod assigns vrrp-id values sequentially to the VIPs defined in the IP failover configuration, starting from the value specified by OPENSHIFT_HA_VRRP_ID_OFFSET. Valid vrrp-id values are in the range 1..255.
When you deploy multiple IP failover configurations, ensure that the configured offset leaves sufficient space for additional VIPs and prevents vrrp-id ranges from overlapping across configurations.
12.6. Configuring IP failover for more than 254 addresses
To configure IP failover for more than 254 Virtual IP addresses in OpenShift Container Platform, you can use the OPENSHIFT_HA_VIP_GROUPS variable to group multiple addresses together. By using the OPENSHIFT_HA_VIP_GROUPS variable, you can change the number of VIPs per VRRP instance and define the number of VIP groups available for each VRRP instance when configuring IP failover.
Grouping VIPs creates a wider range of allocation of VIPs per VRRP in the case of VRRP failover events, and is useful when all hosts in the cluster have access to a service locally. For example, when a service is being exposed with an ExternalIP.
As a rule for failover, do not limit services, such as the router, to one specific host. Instead, services should be replicated to each host so that in the case of IP failover, the services do not have to be recreated on the new host.
If you are using OpenShift Container Platform health checks, the nature of IP failover and groups means that all instances in the group are not checked. For that reason, the Kubernetes health checks must be used to ensure that services are live.
Prerequisites
-
You are logged in to the cluster with a user with
cluster-adminprivileges.
Procedure
To change the number of IP addresses assigned to each group, change the value for the
OPENSHIFT_HA_VIP_GROUPSvariable, for example:Example
DeploymentYAML for IP failover configuration... spec: env: - name: OPENSHIFT_HA_VIP_GROUPS value: "3" ...In this example, the
OPENSHIFT_HA_VIP_GROUPSvariable is set to3. In an environment with seven VIPs, it creates three groups, assigning three VIPs to the first group, and two VIPs to the two remaining groups.NoteIf the number of groups set by
OPENSHIFT_HA_VIP_GROUPSis fewer than the number of IP addresses set to fail over, the group contains more than one IP address, and all of the addresses move as a single unit.
12.7. High availability For ExternalIP
High availability for ExternalIP in non-cloud clusters of OpenShift Container Platform combines IP failover with ExternalIP auto-assignment to ensure services remain accessible when nodes fail. You can configure this by using the same CIDR range for both ExternalIP auto-assignment and IP failover.
To configure high availability for ExternalIP, you can specify a spec.ExternalIP.autoAssignCIDRs range of the cluster network configuration, and then use the same range in creating the IP failover configuration.
Because IP failover can support up to a maximum of 255 VIPs for the entire cluster, the spec.ExternalIP.autoAssignCIDRs must be /24 or smaller.
12.8. Removing IP failover
To remove IP failover from your OpenShift Container Platform cluster and clean up iptables rules and virtual IP addresses, you can delete the deployment and service account, then run a cleanup job on each configured node.
When IP failover is initially configured, the worker nodes in the cluster are modified with an iptables rule that explicitly allows multicast packets on 224.0.0.18 for Keepalived. Because of the change to the nodes, removing IP failover requires running a job to remove the iptables rule and removing the virtual IP addresses used by Keepalived.
Procedure
Optional: Identify and delete any check and notify scripts that are stored as config maps:
Identify whether any pods for IP failover use a config map as a volume:
$ oc get pod -l ipfailover \ -o jsonpath="\ {range .items[?(@.spec.volumes[*].configMap)]} {'Namespace: '}{.metadata.namespace} {'Pod: '}{.metadata.name} {'Volumes that use config maps:'} {range .spec.volumes[?(@.configMap)]} {'volume: '}{.name} {'configMap: '}{.configMap.name}{'\n'}{end} {end}"Example output
Namespace: default Pod: keepalived-worker-59df45db9c-2x9mn Volumes that use config maps: volume: config-volume configMap: mycustomcheckIf the preceding step provided the names of config maps that are used as volumes, delete the config maps:
$ oc delete configmap <configmap_name>
Identify an existing deployment for IP failover:
$ oc get deployment -l ipfailoverExample output
NAMESPACE NAME READY UP-TO-DATE AVAILABLE AGE default ipfailover 2/2 2 2 105dDelete the deployment:
$ oc delete deployment <ipfailover_deployment_name>Remove the
ipfailoverservice account:$ oc delete sa ipfailoverRun a job that removes the IP tables rule that was added when IP failover was initially configured:
Create a file such as
remove-ipfailover-job.yamlwith contents that are similar to the following example:apiVersion: batch/v1 kind: Job metadata: generateName: remove-ipfailover- labels: app: remove-ipfailover spec: template: metadata: name: remove-ipfailover spec: containers: - name: remove-ipfailover image: registry.redhat.io/openshift4/ose-keepalived-ipfailover-rhel9:v4.16 command: ["/var/lib/ipfailover/keepalived/remove-failover.sh"] nodeSelector: kubernetes.io/hostname: <host_name> restartPolicy: Never-
The
nodeSelectoris likely the same as the selector used in the old IP failover deployment. - Run the job for each node in your cluster that was configured for IP failover and replace the hostname each time.
-
The
Run the job:
$ oc create -f remove-ipfailover-job.yamlExample output
job.batch/remove-ipfailover-2h8dm created
Verification
Confirm that the job removed the initial configuration for IP failover.
$ oc logs job/remove-ipfailover-2h8dmExample output
remove-failover.sh: OpenShift IP Failover service terminating. - Removing ip_vs module ... - Cleaning up ... - Releasing VIPs (interface eth0) ...
Chapter 13. Configuring system controls and interface attributes using the tuning plugin
To modify kernel parameters and interface attributes at runtime in OpenShift Container Platform, you can use the tuning Container Network Interface (CNI) meta plugin. The plugin operates in a chain with a main CNI plugin and allows you to change sysctls and interface attributes such as promiscuous mode, all-multicast mode, MTU, and MAC address.

13.1. Configuring system controls by using the tuning CNI
To configure interface-level network sysctls in OpenShift Container Platform, you can use the tuning CNI meta plugin in a network attachment definition. Configure the net.ipv4.conf.IFNAME.accept_redirects sysctl to enable accepting and sending ICMP-redirected packets.
Procedure
Create a network attachment definition, such as
tuning-example.yaml, with the following content:apiVersion: "k8s.cni.cncf.io/v1" kind: NetworkAttachmentDefinition metadata: name: <name> namespace: default spec: config: '{ "cniVersion": "0.4.0", "name": "<name>", "plugins": [{ "type": "<main_CNI_plugin>" }, { "type": "tuning", "sysctl": { "net.ipv4.conf.IFNAME.accept_redirects": "1" } } ] }where:
metadata.name- Specifies the name for the additional network attachment to create. The name must be unique within the specified namespace.
metadata.namespace- Specifies the namespace that the object is associated with.
spec.config.cniVersion- Specifies the CNI specification version.
spec.config.name- Specifies the name for the configuration. It is recommended to match the configuration name to the name value of the network attachment definition.
spec.config.plugins.type- Specifies the name of the main CNI plugin to configure.
spec.config.plugins.tuning.sysctl-
Specifies the sysctl to set. The interface name is represented by the
IFNAMEtoken and is replaced with the actual name of the interface at runtime.
Example network attachment definition
apiVersion: "k8s.cni.cncf.io/v1" kind: NetworkAttachmentDefinition metadata: name: tuningnad namespace: default spec: config: '{ "cniVersion": "0.4.0", "name": "tuningnad", "plugins": [{ "type": "bridge" }, { "type": "tuning", "sysctl": { "net.ipv4.conf.IFNAME.accept_redirects": "1" } } ] }'Apply the YAML by running the following command:
$ oc apply -f tuning-example.yamlExample output
networkattachmentdefinition.k8.cni.cncf.io/tuningnad createdCreate a pod such as
examplepod.yamlwith the network attachment definition similar to the following:apiVersion: v1 kind: Pod metadata: name: tunepod namespace: default annotations: k8s.v1.cni.cncf.io/networks: tuningnad spec: containers: - name: podexample image: centos command: ["/bin/bash", "-c", "sleep INF"] securityContext: runAsUser: 2000 runAsGroup: 3000 allowPrivilegeEscalation: false capabilities: drop: ["ALL"] securityContext: runAsNonRoot: true seccompProfile: type: RuntimeDefaultwhere:
metadata.annotations.k8s.v1.cni.cncf.io/networks-
Specifies the name of the configured
NetworkAttachmentDefinition. spec.containers.securityContext.runAsUser- Specifies which user ID the container is run with.
spec.containers.securityContext.runAsGroup- Specifies which primary group ID the containers is run with.
spec.containers.securityContext.allowPrivilegeEscalation-
Specifies if a pod can request to allow privilege escalation. If unspecified, it defaults to true. This boolean directly controls whether the
no_new_privsflag gets set on the container process. spec.containers.securityContext.capabilities- Specifies privileged actions without giving full root access. This policy ensures all capabilities are dropped from the pod.
spec.securityContext.runAsNonRoot: true- Specifies that the container will run with a user with any UID other than 0.
spec.securityContext.seccompProfile- Specifies the default seccomp profile for a pod or container workload.
Apply the yaml by running the following command:
$ oc apply -f examplepod.yamlVerify that the pod is created by running the following command:
$ oc get podExample output
NAME READY STATUS RESTARTS AGE tunepod 1/1 Running 0 47sLog in to the pod by running the following command:
$ oc rsh tunepodVerify the values of the configured sysctl flags. For example, find the value
net.ipv4.conf.net1.accept_redirectsby running the following command:sh-4.4# sysctl net.ipv4.conf.net1.accept_redirectsExpected output
net.ipv4.conf.net1.accept_redirects = 1
13.2. Enabling all-multicast mode by using the tuning CNI
To enable all-multicast mode on network interfaces in OpenShift Container Platform, you can use the tuning Container Network Interface (CNI) meta plugin in a network attachment definition. When enabled, the interface receives all multicast packets on the network.
Procedure
Create a network attachment definition, such as
tuning-example.yaml, with the following content:apiVersion: "k8s.cni.cncf.io/v1" kind: NetworkAttachmentDefinition metadata: name: <name> namespace: default spec: config: '{ "cniVersion": "0.4.0", "name": "<name>", "plugins": [{ "type": "<main_CNI_plugin>" }, { "type": "tuning", "allmulti": true } } ] }where:
<name>- Specifies the name for the additional network attachment to create. The name must be unique within the specified namespace.
default- Specifies the namespace that the object is associated with.
"0.4.0"- Specifies the CNI specification version.
"<name>"- Specifies the name for the configuration. Match the configuration name to the name value of the network attachment definition.
"<main_CNI_plugin>"- Specifies the name of the main CNI plugin to configure.
"tuning"- Specifies the name of the CNI meta plugin.
"true"- Specifies the all-multicast mode of interface. If enabled, all multicast packets on the network will be received by the interface.
Example network attachment definition
apiVersion: "k8s.cni.cncf.io/v1" kind: NetworkAttachmentDefinition metadata: name: setallmulti namespace: default spec: config: '{ "cniVersion": "0.4.0", "name": "setallmulti", "plugins": [ { "type": "bridge" }, { "type": "tuning", "allmulti": true } ] }'Apply the settings specified in the YAML file by running the following command:
$ oc apply -f tuning-allmulti.yamlExample output
networkattachmentdefinition.k8s.cni.cncf.io/setallmulti createdCreate a pod with a network attachment definition similar to that specified in the following
examplepod.yamlsample file:apiVersion: v1 kind: Pod metadata: name: allmultipod namespace: default annotations: k8s.v1.cni.cncf.io/networks: setallmulti spec: containers: - name: podexample image: centos command: ["/bin/bash", "-c", "sleep INF"] securityContext: runAsUser: 2000 runAsGroup: 3000 allowPrivilegeEscalation: false capabilities: drop: ["ALL"] securityContext: runAsNonRoot: true seccompProfile: type: RuntimeDefaultwhere:
metadata.annotations.k8s.v1.cni.cncf.io/networks-
Specifies the name of the configured
NetworkAttachmentDefinition. spec.containers.securityContext.runAsUser- Specifies which user ID the container is run with.
spec.containers.securityContext.runAsGroup- Specifies which primary group ID the containers is run with.
spec.containers.securityContext.allowPrivilegeEscalation-
Specifies if a pod can request to allow privilege escalation. If unspecified, it defaults to true. This boolean directly controls whether the
no_new_privsflag gets set on the container process. spec.containers.securityContext.capabilities- Specifies privileged actions without giving full root access. This policy ensures all capabilities are dropped from the pod.
spec.containers.securityContext.runAsNonRoot: true- Specifies that the container will run with a user with any UID other than 0.
spec.containers.securityContext.seccompProfile- Specifies the default seccomp profile for a pod or container workload.
Apply the settings specified in the YAML file by running the following command:
$ oc apply -f examplepod.yamlVerify that the pod is created by running the following command:
$ oc get podExample output
NAME READY STATUS RESTARTS AGE allmultipod 1/1 Running 0 23sLog in to the pod by running the following command:
$ oc rsh allmultipodList all the interfaces associated with the pod by running the following command:
sh-4.4# ip linkExample output
1: lo: <LOOPBACK,UP,LOWER_UP> mtu 65536 qdisc noqueue state UNKNOWN mode DEFAULT group default qlen 1000 link/loopback 00:00:00:00:00:00 brd 00:00:00:00:00:00 2: eth0@if22: <BROADCAST,MULTICAST,UP,LOWER_UP> mtu 8901 qdisc noqueue state UP mode DEFAULT group default link/ether 0a:58:0a:83:00:10 brd ff:ff:ff:ff:ff:ff link-netnsid 0 3: net1@if24: <BROADCAST,MULTICAST,ALLMULTI,UP,LOWER_UP> mtu 1500 qdisc noqueue state UP mode DEFAULT group default link/ether ee:9b:66:a4:ec:1d brd ff:ff:ff:ff:ff:ff link-netnsid 0where:
eth0@if22- Specifies the primary interface.
net1@if24- Specifies the secondary interface configured with the network-attachment-definition that supports the all-multicast mode (ALLMULTI flag).
Chapter 14. Using the Stream Control Transmission Protocol (SCTP)
As a cluster administrator, you can use the Stream Control Transmission Protocol (SCTP) on a bare-metal cluster.
14.1. Support for SCTP on OpenShift Container Platform
As a cluster administrator, you can enable SCTP on the hosts in the cluster. On Red Hat Enterprise Linux CoreOS (RHCOS), the SCTP module is disabled by default.
SCTP is a reliable message based protocol that runs on top of an IP network.
When enabled, you can use SCTP as a protocol with pods, services, and network policy. A Service object must be defined with the type parameter set to either the ClusterIP or NodePort value.
14.1.1. Example configurations using SCTP protocol
You can configure a pod or service to use SCTP by setting the protocol parameter to the SCTP value in the pod or service object.
In the following example, a pod is configured to use SCTP:
apiVersion: v1
kind: Pod
metadata:
namespace: project1
name: example-pod
spec:
containers:
- name: example-pod
...
ports:
- containerPort: 30100
name: sctpserver
protocol: SCTPIn the following example, a service is configured to use SCTP:
apiVersion: v1
kind: Service
metadata:
namespace: project1
name: sctpserver
spec:
...
ports:
- name: sctpserver
protocol: SCTP
port: 30100
targetPort: 30100
type: ClusterIP
In the following example, a NetworkPolicy object is configured to apply to SCTP network traffic on port 80 from any pods with a specific label:
kind: NetworkPolicy
apiVersion: networking.k8s.io/v1
metadata:
name: allow-sctp-on-http
spec:
podSelector:
matchLabels:
role: web
ingress:
- ports:
- protocol: SCTP
port: 8014.2. Enabling Stream Control Transmission Protocol (SCTP)
As a cluster administrator, you can load and enable the blacklisted SCTP kernel module on worker nodes in your cluster.
Prerequisites
-
Install the OpenShift CLI (
oc). -
Access to the cluster as a user with the
cluster-adminrole.
Procedure
Create a file named
load-sctp-module.yamlthat contains the following YAML definition:apiVersion: machineconfiguration.openshift.io/v1 kind: MachineConfig metadata: name: load-sctp-module labels: machineconfiguration.openshift.io/role: worker spec: config: ignition: version: 3.2.0 storage: files: - path: /etc/modprobe.d/sctp-blacklist.conf mode: 0644 overwrite: true contents: source: data:, - path: /etc/modules-load.d/sctp-load.conf mode: 0644 overwrite: true contents: source: data:,sctpTo create the
MachineConfigobject, enter the following command:$ oc create -f load-sctp-module.yamlOptional: To watch the status of the nodes while the MachineConfig Operator applies the configuration change, enter the following command. When the status of a node transitions to
Ready, the configuration update is applied.$ oc get nodes
14.3. Verifying Stream Control Transmission Protocol (SCTP) is enabled
You can verify that SCTP is working on a cluster by creating a pod with an application that listens for SCTP traffic, associating it with a service, and then connecting to the exposed service.
Prerequisites
-
Access to the internet from the cluster to install the
ncpackage. -
Install the OpenShift CLI (
oc). -
Access to the cluster as a user with the
cluster-adminrole.
Procedure
Create a pod starts an SCTP listener:
Create a file named
sctp-server.yamlthat defines a pod with the following YAML:apiVersion: v1 kind: Pod metadata: name: sctpserver labels: app: sctpserver spec: containers: - name: sctpserver image: registry.access.redhat.com/ubi9/ubi command: ["/bin/sh", "-c"] args: ["dnf install -y nc && sleep inf"] ports: - containerPort: 30102 name: sctpserver protocol: SCTPCreate the pod by entering the following command:
$ oc create -f sctp-server.yaml
Create a service for the SCTP listener pod.
Create a file named
sctp-service.yamlthat defines a service with the following YAML:apiVersion: v1 kind: Service metadata: name: sctpservice labels: app: sctpserver spec: type: NodePort selector: app: sctpserver ports: - name: sctpserver protocol: SCTP port: 30102 targetPort: 30102To create the service, enter the following command:
$ oc create -f sctp-service.yaml
Create a pod for the SCTP client.
Create a file named
sctp-client.yamlwith the following YAML:apiVersion: v1 kind: Pod metadata: name: sctpclient labels: app: sctpclient spec: containers: - name: sctpclient image: registry.access.redhat.com/ubi9/ubi command: ["/bin/sh", "-c"] args: ["dnf install -y nc && sleep inf"]To create the
Podobject, enter the following command:$ oc apply -f sctp-client.yaml
Run an SCTP listener on the server.
To connect to the server pod, enter the following command:
$ oc rsh sctpserverTo start the SCTP listener, enter the following command:
$ nc -l 30102 --sctp
Connect to the SCTP listener on the server.
- Open a new terminal window or tab in your terminal program.
Obtain the IP address of the
sctpserviceservice. Enter the following command:$ oc get services sctpservice -o go-template='{{.spec.clusterIP}}{{"\n"}}'To connect to the client pod, enter the following command:
$ oc rsh sctpclientTo start the SCTP client, enter the following command. Replace
<cluster_IP>with the cluster IP address of thesctpserviceservice.# nc <cluster_IP> 30102 --sctp
Chapter 15. Using PTP hardware
15.1. About Precision Time Protocol in OpenShift cluster nodes
Precision Time Protocol (PTP) is used to synchronize clocks in a network. When used in conjunction with hardware support, PTP is capable of sub-microsecond accuracy, and is more accurate than Network Time Protocol (NTP).
15.1.1. Elements of a PTP domain
PTP is used to synchronize multiple nodes connected in a network, with clocks for each node. The clocks synchronized by PTP are organized in a leader-follower hierarchy. The hierarchy is created and updated automatically by the best master clock (BMC) algorithm, which runs on every clock. Follower clocks are synchronized to leader clocks, and follower clocks can themselves be the source for other downstream clocks.
Figure 15.1. PTP nodes in the network

The three primary types of PTP clocks are described below.
- Grandmaster clock
- The grandmaster clock provides standard time information to other clocks across the network and ensures accurate and stable synchronisation. It writes time stamps and responds to time requests from other clocks. Grandmaster clocks synchronize to a Global Navigation Satellite System (GNSS) time source. The Grandmaster clock is the authoritative source of time in the network and is responsible for providing time synchronization to all other devices.
- Boundary clock
- The boundary clock has ports in two or more communication paths and can be a source and a destination to other destination clocks at the same time. The boundary clock works as a destination clock upstream. The destination clock receives the timing message, adjusts for delay, and then creates a new source time signal to pass down the network. The boundary clock produces a new timing packet that is still correctly synced with the source clock and can reduce the number of connected devices reporting directly to the source clock.
- Ordinary clock
- The ordinary clock has a single port connection that can play the role of source or destination clock, depending on its position in the network. The ordinary clock can read and write timestamps.
15.1.2. Overview of linuxptp and gpsd in OpenShift Container Platform nodes
OpenShift Container Platform uses the PTP Operator with linuxptp and gpsd packages for high precision network synchronization. The linuxptp package provides tools and daemons for PTP timing in networks. Cluster hosts with Global Navigation Satellite System (GNSS) capable NICs use gpsd to interface with GNSS clock sources.
The linuxptp package includes the ts2phc, pmc, ptp4l, and phc2sys programs for system clock synchronization.
- ts2phc
ts2phcsynchronizes the PTP hardware clock (PHC) across PTP devices with a high degree of precision.ts2phcis used in grandmaster clock configurations. It receives the precision timing signal a high precision clock source such as Global Navigation Satellite System (GNSS). GNSS provides an accurate and reliable source of synchronized time for use in large distributed networks. GNSS clocks typically provide time information with a precision of a few nanoseconds.The
ts2phcsystem daemon sends timing information from the grandmaster clock to other PTP devices in the network by reading time information from the grandmaster clock and converting it to PHC format. PHC time is used by other devices in the network to synchronize their clocks with the grandmaster clock.- pmc
-
pmcimplements a PTP management client (pmc) according to IEEE standard 1588.1588.pmcprovides basic management access for theptp4lsystem daemon.pmcreads from standard input and sends the output over the selected transport, printing any replies it receives. - ptp4l
ptp4limplements the PTP boundary clock and ordinary clock and runs as a system daemon.ptp4ldoes the following:- Synchronizes the PHC to the source clock with hardware time stamping
- Synchronizes the system clock to the source clock with software time stamping
- phc2sys
-
phc2syssynchronizes the system clock to the PHC on the network interface controller (NIC). Thephc2syssystem daemon continuously monitors the PHC for timing information. When it detects a timing error, the PHC corrects the system clock.
The gpsd package includes the ubxtool, gspipe, gpsd, programs for GNSS clock synchronization with the host clock.
- ubxtool
-
ubxtoolCLI allows you to communicate with a u-blox GPS system. TheubxtoolCLI uses the u-blox binary protocol to communicate with the GPS. - gpspipe
-
gpspipeconnects togpsdoutput and pipes it tostdout. - gpsd
-
gpsdis a service daemon that monitors one or more GPS or AIS receivers connected to the host.
15.1.2.1. Advantages of PTP over NTP
One of the main advantages that PTP has over NTP is the hardware support present in various network interface controllers (NIC) and network switches. The specialized hardware allows PTP to account for delays in message transfer and improves the accuracy of time synchronization. To achieve the best possible accuracy, it is recommended that all networking components between PTP clocks are PTP hardware enabled.
Hardware-based PTP provides optimal accuracy, since the NIC can timestamp the PTP packets at the exact moment they are sent and received. Compare this to software-based PTP, which requires additional processing of the PTP packets by the operating system.
If your openshift-sdn cluster with PTP uses the User Datagram Protocol (UDP) for hardware time stamping and you migrate to the OVN-Kubernetes plugin, the hardware time stamping cannot be applied to primary interface devices, such as an Open vSwitch (OVS) bridge. As a result, UDP version 4 configurations cannot work with a br-ex interface.
You can configure linuxptp services and use PTP-capable hardware in OpenShift Container Platform cluster nodes.
Use the OpenShift Container Platform web console or OpenShift CLI (oc) to install PTP by deploying the PTP Operator. The PTP Operator creates and manages the linuxptp services and provides the following features:
- Discovery of the PTP-capable devices in the cluster.
-
Management of the configuration of
linuxptpservices. -
Notification of PTP clock events that negatively affect the performance and reliability of your application with the PTP Operator
cloud-event-proxysidecar.
The PTP Operator works with PTP-capable devices on clusters provisioned only on bare-metal infrastructure.
Before enabling PTP, ensure that NTP is disabled for the required nodes. You can disable the chrony time service (chronyd) using a MachineConfig custom resource. For more information, see Disabling chrony time service.
Additional resources
15.1.3. Overview of GNSS timing for PTP grandmaster clocks
OpenShift Container Platform supports receiving precision PTP timing from Global Navigation Satellite System (GNSS) sources and grandmaster clocks (T-GM) in the cluster.
OpenShift Container Platform supports PTP timing from GNSS sources with Intel E810 Westport Channel NICs only.
Figure 15.2. Overview of Synchronization with GNSS and T-GM

- Global Navigation Satellite System (GNSS)
GNSS is a satellite-based system used to provide positioning, navigation, and timing information to receivers around the globe. In PTP, GNSS receivers are often used as a highly accurate and stable reference clock source. These receivers receive signals from multiple GNSS satellites, allowing them to calculate precise time information. The timing information obtained from GNSS is used as a reference by the PTP grandmaster clock.
By using GNSS as a reference, the grandmaster clock in the PTP network can provide highly accurate timestamps to other devices, enabling precise synchronization across the entire network.
- Digital Phase-Locked Loop (DPLL)
- DPLL provides clock synchronization between different PTP nodes in the network. DPLL compares the phase of the local system clock signal with the phase of the incoming synchronization signal, for example, PTP messages from the PTP grandmaster clock. The DPLL continuously adjusts the local clock frequency and phase to minimize the phase difference between the local clock and the reference clock.
15.1.3.1. Handling leap second events in GNSS-synced PTP grandmaster clocks
A leap second is a one-second adjustment that is occasionally applied to Coordinated Universal Time (UTC) to keep it synchronized with International Atomic Time (TAI). UTC leap seconds are unpredictable. Internationally agreed leap seconds are listed in leap-seconds.list. This file is regularly updated by the International Earth Rotation and Reference Systems Service (IERS). An unhandled leap second can have a significant impact on far edge RAN networks. It can cause the far edge RAN application to immediately disconnect voice calls and data sessions.
15.1.4. About PTP and clock synchronization error events
Cloud native applications such as virtual RAN (vRAN) require access to notifications about hardware timing events that are critical to the functioning of the overall network. PTP clock synchronization errors can negatively affect the performance and reliability of your low-latency application, for example, a vRAN application running in a distributed unit (DU).
Loss of PTP synchronization is a critical error for a RAN network. If synchronization is lost on a node, the radio might be shut down and the network Over the Air (OTA) traffic might be shifted to another node in the wireless network. Fast event notifications mitigate against workload errors by allowing cluster nodes to communicate PTP clock sync status to the vRAN application running in the DU.
Event notifications are available to vRAN applications running on the same DU node. A publish/subscribe REST API passes events notifications to the messaging bus. Publish/subscribe messaging, or pub-sub messaging, is an asynchronous service-to-service communication architecture where any message published to a topic is immediately received by all of the subscribers to the topic.
The PTP Operator generates fast event notifications for every PTP-capable network interface. You can access the events by using a cloud-event-proxy sidecar container over an HTTP message bus.
PTP fast event notifications are available for network interfaces configured to use PTP ordinary clocks, PTP grandmaster clocks, or PTP boundary clocks.
15.1.5. 2-card E810 NIC configuration reference
OpenShift Container Platform supports single and dual-NIC Intel E810 hardware for PTP timing in grandmaster clocks (T-GM) and boundary clocks (T-BC).
- Dual NIC grandmaster clock
You can use a cluster host that has dual-NIC hardware as PTP grandmaster clock. One NIC receives timing information from the global navigation satellite system (GNSS). The second NIC receives the timing information from the first using the SMA1 Tx/Rx connections on the E810 NIC faceplate. The system clock on the cluster host is synchronized from the NIC that is connected to the GNSS satellite.
Dual NIC grandmaster clocks are a feature of distributed RAN (D-RAN) configurations where the Remote Radio Unit (RRU) and Baseband Unit (BBU) are located at the same radio cell site. D-RAN distributes radio functions across multiple sites, with backhaul connections linking them to the core network.
Figure 15.3. Dual NIC grandmaster clock
 Note
NoteIn a dual-NIC T-GM configuration, a single
ts2phcprogram operate on two PTP hardware clocks (PHCs), one for each NIC.- Dual NIC boundary clock
For 5G telco networks that deliver mid-band spectrum coverage, each virtual distributed unit (vDU) requires connections to 6 radio units (RUs). To make these connections, each vDU host requires 2 NICs configured as boundary clocks.
Dual NIC hardware allows you to connect each NIC to the same upstream leader clock with separate
ptp4linstances for each NIC feeding the downstream clocks.- Highly available system clock with dual-NIC boundary clocks
You can configure Intel E810-XXVDA4 Salem channel dual-NIC hardware as dual PTP boundary clocks that provide timing for a highly available system clock. This configuration is useful when you have multiple time sources on different NICs. High availability ensures that the node does not lose timing synchronization if one of the two timing sources is lost or disconnected.
Each NIC is connected to the same upstream leader clock. Highly available boundary clocks use multiple PTP domains to synchronize with the target system clock. When a T-BC is highly available, the host system clock can maintain the correct offset even if one or more
ptp4linstances syncing the NIC PHC clock fails. If any single SFP port or cable failure occurs, the boundary clock stays in sync with the leader clock.Boundary clock leader source selection is done using the A-BMCA algorithm. For more information, see ITU-T recommendation G.8275.1.
15.1.6. 3-card Intel E810 PTP grandmaster clock
OpenShift Container Platform supports cluster hosts with 3 Intel E810 NICs as PTP grandmaster clocks (T-GM).
- 3-card grandmaster clock
You can use a cluster host that has 3 NICs as PTP grandmaster clock. One NIC receives timing information from the global navigation satellite system (GNSS). The second and third NICs receive the timing information from the first by using the SMA1 Tx/Rx connections on the E810 NIC faceplate. The system clock on the cluster host is synchronized from the NIC that is connected to the GNSS satellite.
3-card NIC grandmaster clocks can be used for distributed RAN (D-RAN) configurations where the Radio Unit (RU) is connected directly to the distributed unit (DU) without a front haul switch, for example, if the RU and DU are located in the same radio cell site. D-RAN distributes radio functions across multiple sites, with backhaul connections linking them to the core network.
Figure 15.4. 3-card Intel E810 PTP grandmaster clock
 Note
NoteIn a 3-card T-GM configuration, a single
ts2phcprocess reports as 3ts2phcinstances in the system.
15.2. Configuring PTP devices
The PTP Operator adds the NodePtpDevice.ptp.openshift.io custom resource definition (CRD) to OpenShift Container Platform.
When installed, the PTP Operator searches your cluster for Precision Time Protocol (PTP) capable network devices on each node. The Operator creates and updates a NodePtpDevice custom resource (CR) object for each node that provides a compatible PTP-capable network device.
Network interface controller (NIC) hardware with built-in PTP capabilities sometimes require a device-specific configuration. You can use hardware-specific NIC features for supported hardware with the PTP Operator by configuring a plugin in the PtpConfig custom resource (CR). The linuxptp-daemon service uses the named parameters in the plugin stanza to start linuxptp processes, ptp4l and phc2sys, based on the specific hardware configuration.
In OpenShift Container Platform 4.16, the Intel E810 NIC is supported with a PtpConfig plugin.
15.2.1. Installing the PTP Operator using the CLI
As a cluster administrator, you can install the Operator by using the CLI.
Prerequisites
- A cluster installed on bare-metal hardware with nodes that have hardware that supports PTP.
-
Install the OpenShift CLI (
oc). -
Log in as a user with
cluster-adminprivileges.
Procedure
Create a namespace for the PTP Operator.
Save the following YAML in the
ptp-namespace.yamlfile:apiVersion: v1 kind: Namespace metadata: name: openshift-ptp annotations: workload.openshift.io/allowed: management labels: name: openshift-ptp openshift.io/cluster-monitoring: "true"Create the
NamespaceCR:$ oc create -f ptp-namespace.yaml
Create an Operator group for the PTP Operator.
Save the following YAML in the
ptp-operatorgroup.yamlfile:apiVersion: operators.coreos.com/v1 kind: OperatorGroup metadata: name: ptp-operators namespace: openshift-ptp spec: targetNamespaces: - openshift-ptpCreate the
OperatorGroupCR:$ oc create -f ptp-operatorgroup.yaml
Subscribe to the PTP Operator.
Save the following YAML in the
ptp-sub.yamlfile:apiVersion: operators.coreos.com/v1alpha1 kind: Subscription metadata: name: ptp-operator-subscription namespace: openshift-ptp spec: channel: "stable" name: ptp-operator source: redhat-operators sourceNamespace: openshift-marketplaceCreate the
SubscriptionCR:$ oc create -f ptp-sub.yaml
To verify that the Operator is installed, enter the following command:
$ oc get csv -n openshift-ptp -o custom-columns=Name:.metadata.name,Phase:.status.phaseExample output
Name Phase 4.16.0-202301261535 Succeeded
15.2.2. Installing the PTP Operator by using the web console
As a cluster administrator, you can install the PTP Operator by using the web console.
You have to create the namespace and Operator group as mentioned in the previous section.
Procedure
Install the PTP Operator using the OpenShift Container Platform web console:
- In the OpenShift Container Platform web console, click Operators → OperatorHub.
- Choose PTP Operator from the list of available Operators, and then click Install.
- On the Install Operator page, under A specific namespace on the cluster select openshift-ptp. Then, click Install.
Optional: Verify that the PTP Operator installed successfully:
- Switch to the Operators → Installed Operators page.
Ensure that PTP Operator is listed in the openshift-ptp project with a Status of InstallSucceeded.
NoteDuring installation an Operator might display a Failed status. If the installation later succeeds with an InstallSucceeded message, you can ignore the Failed message.
If the Operator does not appear as installed, to troubleshoot further:
- Go to the Operators → Installed Operators page and inspect the Operator Subscriptions and Install Plans tabs for any failure or errors under Status.
-
Go to the Workloads → Pods page and check the logs for pods in the
openshift-ptpproject.
15.2.3. Discovering PTP-capable network devices in your cluster
Identify PTP-capable network devices that exist in your cluster so that you can configure them
Prerequisites
- You installed the PTP Operator.
Procedure
To return a complete list of PTP capable network devices in your cluster, run the following command:
$ oc get NodePtpDevice -n openshift-ptp -o yamlExample output
apiVersion: v1 items: - apiVersion: ptp.openshift.io/v1 kind: NodePtpDevice metadata: creationTimestamp: "2022-01-27T15:16:28Z" generation: 1 name: dev-worker-0 namespace: openshift-ptp resourceVersion: "6538103" uid: d42fc9ad-bcbf-4590-b6d8-b676c642781a spec: {} status: devices: - name: eno1 - name: eno2 - name: eno3 - name: eno4 - name: enp5s0f0 - name: enp5s0f1 ...where:
-worker-0-
The value for the
nameparameter is the same as the name of the parent node. devices-
The
devicescollection includes a list of the PTP capable devices that the PTP Operator discovers for the node.
15.2.4. Configuring linuxptp services as a grandmaster clock
You can configure the linuxptp services (ptp4l, phc2sys, ts2phc) as grandmaster clock (T-GM) by creating a PtpConfig custom resource (CR) that configures the host NIC.
The ts2phc utility allows you to synchronize the system clock with the PTP grandmaster clock so that the node can stream precision clock signal to downstream PTP ordinary clocks and boundary clocks.
Use the following example PtpConfig CR as the basis to configure linuxptp services as T-GM for an Intel Westport Channel E810-XXVDA4T network interface.
To configure PTP fast events, set appropriate values for ptp4lOpts, ptp4lConf, and ptpClockThreshold. ptpClockThreshold is used only when events are enabled. See "Configuring the PTP fast event notifications publisher" for more information.
Prerequisites
- For T-GM clocks in production environments, install an Intel E810 Westport Channel NIC in the bare-metal cluster host.
-
Install the OpenShift CLI (
oc). -
Log in as a user with
cluster-adminprivileges. - Install the PTP Operator.
Procedure
Create the
PtpConfigCR. For example:Depending on your requirements, use one of the following T-GM configurations for your deployment. Save the YAML in the
grandmaster-clock-ptp-config.yamlfile:apiVersion: ptp.openshift.io/v1 kind: PtpConfig metadata: name: grandmaster namespace: openshift-ptp annotations: {} spec: profile: - name: "grandmaster" ptp4lOpts: "-2 --summary_interval -4" phc2sysOpts: -r -u 0 -m -N 8 -R 16 -s $iface_master -n 24 ptpSchedulingPolicy: SCHED_FIFO ptpSchedulingPriority: 10 ptpSettings: logReduce: "true" plugins: e810: enableDefaultConfig: false settings: LocalMaxHoldoverOffSet: 1500 LocalHoldoverTimeout: 14400 MaxInSpecOffset: 1500 pins: $e810_pins # "$iface_master": # "U.FL2": "0 2" # "U.FL1": "0 1" # "SMA2": "0 2" # "SMA1": "0 1" ublxCmds: - args: #ubxtool -P 29.20 -z CFG-HW-ANT_CFG_VOLTCTRL,1 - "-P" - "29.20" - "-z" - "CFG-HW-ANT_CFG_VOLTCTRL,1" reportOutput: false - args: #ubxtool -P 29.20 -e GPS - "-P" - "29.20" - "-e" - "GPS" reportOutput: false - args: #ubxtool -P 29.20 -d Galileo - "-P" - "29.20" - "-d" - "Galileo" reportOutput: false - args: #ubxtool -P 29.20 -d GLONASS - "-P" - "29.20" - "-d" - "GLONASS" reportOutput: false - args: #ubxtool -P 29.20 -d BeiDou - "-P" - "29.20" - "-d" - "BeiDou" reportOutput: false - args: #ubxtool -P 29.20 -d SBAS - "-P" - "29.20" - "-d" - "SBAS" reportOutput: false - args: #ubxtool -P 29.20 -t -w 5 -v 1 -e SURVEYIN,600,50000 - "-P" - "29.20" - "-t" - "-w" - "5" - "-v" - "1" - "-e" - "SURVEYIN,600,50000" reportOutput: true - args: #ubxtool -P 29.20 -p MON-HW - "-P" - "29.20" - "-p" - "MON-HW" reportOutput: true - args: #ubxtool -P 29.20 -p CFG-MSG,1,38,248 - "-P" - "29.20" - "-p" - "CFG-MSG,1,38,248" reportOutput: true ts2phcOpts: " " ts2phcConf: | [nmea] ts2phc.master 1 [global] use_syslog 0 verbose 1 logging_level 7 ts2phc.pulsewidth 100000000 #cat /dev/GNSS to find available serial port #example value of gnss_serialport is /dev/ttyGNSS_1700_0 ts2phc.nmea_serialport $gnss_serialport [$iface_master] ts2phc.extts_polarity rising ts2phc.extts_correction 0 ptp4lConf: | [$iface_master] masterOnly 1 [$iface_master_1] masterOnly 1 [$iface_master_2] masterOnly 1 [$iface_master_3] masterOnly 1 [global] # # Default Data Set # twoStepFlag 1 priority1 128 priority2 128 domainNumber 24 #utc_offset 37 clockClass 6 clockAccuracy 0x27 offsetScaledLogVariance 0xFFFF free_running 0 freq_est_interval 1 dscp_event 0 dscp_general 0 dataset_comparison G.8275.x G.8275.defaultDS.localPriority 128 # # Port Data Set # logAnnounceInterval -3 logSyncInterval -4 logMinDelayReqInterval -4 logMinPdelayReqInterval 0 announceReceiptTimeout 3 syncReceiptTimeout 0 delayAsymmetry 0 fault_reset_interval -4 neighborPropDelayThresh 20000000 masterOnly 0 G.8275.portDS.localPriority 128 # # Run time options # assume_two_step 0 logging_level 6 path_trace_enabled 0 follow_up_info 0 hybrid_e2e 0 inhibit_multicast_service 0 net_sync_monitor 0 tc_spanning_tree 0 tx_timestamp_timeout 50 unicast_listen 0 unicast_master_table 0 unicast_req_duration 3600 use_syslog 1 verbose 0 summary_interval -4 kernel_leap 1 check_fup_sync 0 clock_class_threshold 7 # # Servo Options # pi_proportional_const 0.0 pi_integral_const 0.0 pi_proportional_scale 0.0 pi_proportional_exponent -0.3 pi_proportional_norm_max 0.7 pi_integral_scale 0.0 pi_integral_exponent 0.4 pi_integral_norm_max 0.3 step_threshold 2.0 first_step_threshold 0.00002 clock_servo pi sanity_freq_limit 200000000 ntpshm_segment 0 # # Transport options # transportSpecific 0x0 ptp_dst_mac 01:1B:19:00:00:00 p2p_dst_mac 01:80:C2:00:00:0E udp_ttl 1 udp6_scope 0x0E uds_address /var/run/ptp4l # # Default interface options # clock_type BC network_transport L2 delay_mechanism E2E time_stamping hardware tsproc_mode filter delay_filter moving_median delay_filter_length 10 egressLatency 0 ingressLatency 0 boundary_clock_jbod 0 # # Clock description # productDescription ;; revisionData ;; manufacturerIdentity 00:00:00 userDescription ; timeSource 0x20 recommend: - profile: "grandmaster" priority: 4 match: - nodeLabel: "node-role.kubernetes.io/$mcp"NoteFor E810 Westport Channel NICs, set the value for
ts2phc.nmea_serialportto/dev/gnss0.Create the CR by running the following command:
$ oc create -f grandmaster-clock-ptp-config.yaml
Verification
Check that the
PtpConfigprofile is applied to the node.Get the list of pods in the
openshift-ptpnamespace by running the following command:$ oc get pods -n openshift-ptp -o wideExample output
NAME READY STATUS RESTARTS AGE IP NODE linuxptp-daemon-74m2g 3/3 Running 3 4d15h 10.16.230.7 compute-1.example.com ptp-operator-5f4f48d7c-x7zkf 1/1 Running 1 4d15h 10.128.1.145 compute-1.example.comCheck that the profile is correct. Examine the logs of the
linuxptpdaemon that corresponds to the node you specified in thePtpConfigprofile. Run the following command:$ oc logs linuxptp-daemon-74m2g -n openshift-ptp -c linuxptp-daemon-containerExample output
ts2phc[94980.334]: [ts2phc.0.config] nmea delay: 98690975 ns ts2phc[94980.334]: [ts2phc.0.config] ens3f0 extts index 0 at 1676577329.999999999 corr 0 src 1676577330.901342528 diff -1 ts2phc[94980.334]: [ts2phc.0.config] ens3f0 master offset -1 s2 freq -1 ts2phc[94980.441]: [ts2phc.0.config] nmea sentence: GNRMC,195453.00,A,4233.24427,N,07126.64420,W,0.008,,160223,,,A,V phc2sys[94980.450]: [ptp4l.0.config] CLOCK_REALTIME phc offset 943 s2 freq -89604 delay 504 phc2sys[94980.512]: [ptp4l.0.config] CLOCK_REALTIME phc offset 1000 s2 freq -89264 delay 474
15.2.4.1. Configuring linuxptp services as a grandmaster clock for dual E810 Westport Channel NICs
You can configure the linuxptp services (ptp4l, phc2sys, ts2phc) as a grandmaster clock (T-GM) for 2 E810 NICs by creating a PtpConfig custom resource (CR) that configures the NICs.
You can configure the linuxptp services as a T-GM for the following E810 NICs:
- Intel E810-XXVDA4T Westport Channel NIC
- Intel E810-CQDA2T Logan Beach NIC
For distributed RAN (D-RAN) use cases, you can configure PTP for 2 NICs as follows:
- NIC 1 is synced to the global navigation satellite system (GNSS) time source.
-
NIC 2 is synced to the 1PPS timing output provided by NIC one. This configuration is provided by the PTP hardware plugin in the
PtpConfigCR.
The 2-card PTP T-GM configuration uses one instance of ptp4l and one instance of ts2phc. The ptp4l and ts2phc programs are each configured to operate on two PTP hardware clocks (PHCs), one for each NIC. The host system clock is synchronized from the NIC that is connected to the GNSS time source.
Use the following example PtpConfig CR as the basis to configure linuxptp services as T-GM for dual Intel Westport Channel E810-XXVDA4T network interfaces.
To configure PTP fast events, set appropriate values for ptp4lOpts, ptp4lConf, and ptpClockThreshold. ptpClockThreshold is used only when events are enabled. See "Configuring the PTP fast event notifications publisher" for more information.
Prerequisites
- For T-GM clocks in production environments, install two Intel E810 Westport Channel NICs in the bare-metal cluster host.
-
Install the OpenShift CLI (
oc). -
Log in as a user with
cluster-adminprivileges. - Install the PTP Operator.
Procedure
Create the
PtpConfigCR. For example:Save the following YAML in the
grandmaster-clock-ptp-config-dual-nics.yamlfile:# In this example two cards $iface_nic1 and $iface_nic2 are connected via # SMA1 ports by a cable and $iface_nic2 receives 1PPS signals from $iface_nic1 apiVersion: ptp.openshift.io/v1 kind: PtpConfig metadata: name: grandmaster namespace: openshift-ptp annotations: {} spec: profile: - name: "grandmaster" ptp4lOpts: "-2 --summary_interval -4" phc2sysOpts: -r -u 0 -m -N 8 -R 16 -s $iface_nic1 -n 24 ptpSchedulingPolicy: SCHED_FIFO ptpSchedulingPriority: 10 ptpSettings: logReduce: "true" plugins: e810: enableDefaultConfig: false settings: LocalMaxHoldoverOffSet: 1500 LocalHoldoverTimeout: 14400 MaxInSpecOffset: 1500 pins: $e810_pins # "$iface_nic1": # "U.FL2": "0 2" # "U.FL1": "0 1" # "SMA2": "0 2" # "SMA1": "2 1" # "$iface_nic2": # "U.FL2": "0 2" # "U.FL1": "0 1" # "SMA2": "0 2" # "SMA1": "1 1" ublxCmds: - args: #ubxtool -P 29.20 -z CFG-HW-ANT_CFG_VOLTCTRL,1 - "-P" - "29.20" - "-z" - "CFG-HW-ANT_CFG_VOLTCTRL,1" reportOutput: false - args: #ubxtool -P 29.20 -e GPS - "-P" - "29.20" - "-e" - "GPS" reportOutput: false - args: #ubxtool -P 29.20 -d Galileo - "-P" - "29.20" - "-d" - "Galileo" reportOutput: false - args: #ubxtool -P 29.20 -d GLONASS - "-P" - "29.20" - "-d" - "GLONASS" reportOutput: false - args: #ubxtool -P 29.20 -d BeiDou - "-P" - "29.20" - "-d" - "BeiDou" reportOutput: false - args: #ubxtool -P 29.20 -d SBAS - "-P" - "29.20" - "-d" - "SBAS" reportOutput: false - args: #ubxtool -P 29.20 -t -w 5 -v 1 -e SURVEYIN,600,50000 - "-P" - "29.20" - "-t" - "-w" - "5" - "-v" - "1" - "-e" - "SURVEYIN,600,50000" reportOutput: true - args: #ubxtool -P 29.20 -p MON-HW - "-P" - "29.20" - "-p" - "MON-HW" reportOutput: true - args: #ubxtool -P 29.20 -p CFG-MSG,1,38,248 - "-P" - "29.20" - "-p" - "CFG-MSG,1,38,248" reportOutput: true ts2phcOpts: " " ts2phcConf: | [nmea] ts2phc.master 1 [global] use_syslog 0 verbose 1 logging_level 7 ts2phc.pulsewidth 100000000 #cat /dev/GNSS to find available serial port #example value of gnss_serialport is /dev/ttyGNSS_1700_0 ts2phc.nmea_serialport $gnss_serialport [$iface_nic1] ts2phc.extts_polarity rising ts2phc.extts_correction 0 [$iface_nic2] ts2phc.master 0 ts2phc.extts_polarity rising #this is a measured value in nanoseconds to compensate for SMA cable delay ts2phc.extts_correction -10 ptp4lConf: | [$iface_nic1] masterOnly 1 [$iface_nic1_1] masterOnly 1 [$iface_nic1_2] masterOnly 1 [$iface_nic1_3] masterOnly 1 [$iface_nic2] masterOnly 1 [$iface_nic2_1] masterOnly 1 [$iface_nic2_2] masterOnly 1 [$iface_nic2_3] masterOnly 1 [global] # # Default Data Set # twoStepFlag 1 priority1 128 priority2 128 domainNumber 24 #utc_offset 37 clockClass 6 clockAccuracy 0x27 offsetScaledLogVariance 0xFFFF free_running 0 freq_est_interval 1 dscp_event 0 dscp_general 0 dataset_comparison G.8275.x G.8275.defaultDS.localPriority 128 # # Port Data Set # logAnnounceInterval -3 logSyncInterval -4 logMinDelayReqInterval -4 logMinPdelayReqInterval 0 announceReceiptTimeout 3 syncReceiptTimeout 0 delayAsymmetry 0 fault_reset_interval -4 neighborPropDelayThresh 20000000 masterOnly 0 G.8275.portDS.localPriority 128 # # Run time options # assume_two_step 0 logging_level 6 path_trace_enabled 0 follow_up_info 0 hybrid_e2e 0 inhibit_multicast_service 0 net_sync_monitor 0 tc_spanning_tree 0 tx_timestamp_timeout 50 unicast_listen 0 unicast_master_table 0 unicast_req_duration 3600 use_syslog 1 verbose 0 summary_interval -4 kernel_leap 1 check_fup_sync 0 clock_class_threshold 7 # # Servo Options # pi_proportional_const 0.0 pi_integral_const 0.0 pi_proportional_scale 0.0 pi_proportional_exponent -0.3 pi_proportional_norm_max 0.7 pi_integral_scale 0.0 pi_integral_exponent 0.4 pi_integral_norm_max 0.3 step_threshold 2.0 first_step_threshold 0.00002 clock_servo pi sanity_freq_limit 200000000 ntpshm_segment 0 # # Transport options # transportSpecific 0x0 ptp_dst_mac 01:1B:19:00:00:00 p2p_dst_mac 01:80:C2:00:00:0E udp_ttl 1 udp6_scope 0x0E uds_address /var/run/ptp4l # # Default interface options # clock_type BC network_transport L2 delay_mechanism E2E time_stamping hardware tsproc_mode filter delay_filter moving_median delay_filter_length 10 egressLatency 0 ingressLatency 0 boundary_clock_jbod 1 # # Clock description # productDescription ;; revisionData ;; manufacturerIdentity 00:00:00 userDescription ; timeSource 0x20 recommend: - profile: "grandmaster" priority: 4 match: - nodeLabel: "node-role.kubernetes.io/$mcp"NoteFor E810 Westport Channel NICs, set the value for
ts2phc.nmea_serialportto/dev/gnss0.Create the CR by running the following command:
$ oc create -f grandmaster-clock-ptp-config-dual-nics.yaml
Verification
Check that the
PtpConfigprofile is applied to the node.Get the list of pods in the
openshift-ptpnamespace by running the following command:$ oc get pods -n openshift-ptp -o wideExample output
NAME READY STATUS RESTARTS AGE IP NODE linuxptp-daemon-74m2g 3/3 Running 3 4d15h 10.16.230.7 compute-1.example.com ptp-operator-5f4f48d7c-x7zkf 1/1 Running 1 4d15h 10.128.1.145 compute-1.example.comCheck that the profile is correct. Examine the logs of the
linuxptpdaemon that corresponds to the node you specified in thePtpConfigprofile. Run the following command:$ oc logs linuxptp-daemon-74m2g -n openshift-ptp -c linuxptp-daemon-containerExample output
ts2phc[509863.660]: [ts2phc.0.config] nmea delay: 347527248 ns ts2phc[509863.660]: [ts2phc.0.config] ens2f0 extts index 0 at 1705516553.000000000 corr 0 src 1705516553.652499081 diff 0 ts2phc[509863.660]: [ts2phc.0.config] ens2f0 master offset 0 s2 freq -0 I0117 18:35:16.000146 1633226 stats.go:57] state updated for ts2phc =s2 I0117 18:35:16.000163 1633226 event.go:417] dpll State s2, gnss State s2, tsphc state s2, gm state s2, ts2phc[1705516516]:[ts2phc.0.config] ens2f0 nmea_status 1 offset 0 s2 GM[1705516516]:[ts2phc.0.config] ens2f0 T-GM-STATUS s2 ts2phc[509863.677]: [ts2phc.0.config] ens7f0 extts index 0 at 1705516553.000000010 corr -10 src 1705516553.652499081 diff 0 ts2phc[509863.677]: [ts2phc.0.config] ens7f0 master offset 0 s2 freq -0 I0117 18:35:16.016597 1633226 stats.go:57] state updated for ts2phc =s2 phc2sys[509863.719]: [ptp4l.0.config] CLOCK_REALTIME phc offset -6 s2 freq +15441 delay 510 phc2sys[509863.782]: [ptp4l.0.config] CLOCK_REALTIME phc offset -7 s2 freq +15438 delay 502
15.2.4.2. Configuring linuxptp services as a grandmaster clock for 3 E810 NICs
You can configure the linuxptp services (ptp4l, phc2sys, ts2phc) as a grandmaster clock (T-GM) for 3 E810 NICs by creating a PtpConfig custom resource (CR) that configures the NICs.
You can configure the linuxptp services as a T-GM with 3 NICs for the following E810 NICs:
- Intel E810-XXVDA4T Westport Channel NIC
- Intel E810-CQDA2T Logan Beach NIC
For distributed RAN (D-RAN) use cases, you can configure PTP for 3 NICs as follows:
- NIC 1 is synced to the Global Navigation Satellite System (GNSS)
- NICs 2 and 3 are synced to NIC 1 with 1PPS faceplate connections
Use the following example PtpConfig CRs as the basis to configure linuxptp services as a 3-card Intel E810 T-GM.
Prerequisites
- For T-GM clocks in production environments, install 3 Intel E810 NICs in the bare-metal cluster host.
-
Install the OpenShift CLI (
oc). -
Log in as a user with
cluster-adminprivileges. - Install the PTP Operator.
Procedure
Create the
PtpConfigCR. For example:Save the following YAML in the
three-nic-grandmaster-clock-ptp-config.yamlfile:# In this example, the three cards are connected via SMA cables: # - $iface_timeTx1 has the GNSS signal input # - $iface_timeTx2 SMA1 is connected to $iface_timeTx1 SMA1 # - $iface_timeTx3 SMA1 is connected to $iface_timeTx1 SMA2 apiVersion: ptp.openshift.io/v1 kind: PtpConfig metadata: name: gm-3card namespace: openshift-ptp annotations: ran.openshift.io/ztp-deploy-wave: "10" spec: profile: - name: grandmaster ptp4lOpts: -2 --summary_interval -4 phc2sysOpts: -r -u 0 -m -N 8 -R 16 -s $iface_timeTx1 -n 24 ptpSchedulingPolicy: SCHED_FIFO ptpSchedulingPriority: 10 ptpSettings: logReduce: "true" plugins: e810: enableDefaultConfig: false settings: LocalHoldoverTimeout: 14400 LocalMaxHoldoverOffSet: 1500 MaxInSpecOffset: 1500 pins: # Syntax guide: # - The 1st number in each pair must be one of: # 0 - Disabled # 1 - RX # 2 - TX # - The 2nd number in each pair must match the channel number $iface_timeTx1: SMA1: 2 1 SMA2: 2 2 U.FL1: 0 1 U.FL2: 0 2 $iface_timeTx2: SMA1: 1 1 SMA2: 0 2 U.FL1: 0 1 U.FL2: 0 2 $iface_timeTx3: SMA1: 1 1 SMA2: 0 2 U.FL1: 0 1 U.FL2: 0 2 ublxCmds: - args: #ubxtool -P 29.20 -z CFG-HW-ANT_CFG_VOLTCTRL,1 - "-P" - "29.20" - "-z" - "CFG-HW-ANT_CFG_VOLTCTRL,1" reportOutput: false - args: #ubxtool -P 29.20 -e GPS - "-P" - "29.20" - "-e" - "GPS" reportOutput: false - args: #ubxtool -P 29.20 -d Galileo - "-P" - "29.20" - "-d" - "Galileo" reportOutput: false - args: #ubxtool -P 29.20 -d GLONASS - "-P" - "29.20" - "-d" - "GLONASS" reportOutput: false - args: #ubxtool -P 29.20 -d BeiDou - "-P" - "29.20" - "-d" - "BeiDou" reportOutput: false - args: #ubxtool -P 29.20 -d SBAS - "-P" - "29.20" - "-d" - "SBAS" reportOutput: false - args: #ubxtool -P 29.20 -t -w 5 -v 1 -e SURVEYIN,600,50000 - "-P" - "29.20" - "-t" - "-w" - "5" - "-v" - "1" - "-e" - "SURVEYIN,600,50000" reportOutput: true - args: #ubxtool -P 29.20 -p MON-HW - "-P" - "29.20" - "-p" - "MON-HW" reportOutput: true - args: #ubxtool -P 29.20 -p CFG-MSG,1,38,248 - "-P" - "29.20" - "-p" - "CFG-MSG,1,38,248" reportOutput: true ts2phcOpts: " " ts2phcConf: | [nmea] ts2phc.master 1 [global] use_syslog 0 verbose 1 logging_level 7 ts2phc.pulsewidth 100000000 #example value of nmea_serialport is /dev/gnss0 ts2phc.nmea_serialport (?<gnss_serialport>[/\w\s/]+) leapfile /usr/share/zoneinfo/leap-seconds.list [$iface_timeTx1] ts2phc.extts_polarity rising ts2phc.extts_correction 0 [$iface_timeTx2] ts2phc.master 0 ts2phc.extts_polarity rising #this is a measured value in nanoseconds to compensate for SMA cable delay ts2phc.extts_correction -10 [$iface_timeTx3] ts2phc.master 0 ts2phc.extts_polarity rising #this is a measured value in nanoseconds to compensate for SMA cable delay ts2phc.extts_correction -10 ptp4lConf: | [$iface_timeTx1] masterOnly 1 [$iface_timeTx1_1] masterOnly 1 [$iface_timeTx1_2] masterOnly 1 [$iface_timeTx1_3] masterOnly 1 [$iface_timeTx2] masterOnly 1 [$iface_timeTx2_1] masterOnly 1 [$iface_timeTx2_2] masterOnly 1 [$iface_timeTx2_3] masterOnly 1 [$iface_timeTx3] masterOnly 1 [$iface_timeTx3_1] masterOnly 1 [$iface_timeTx3_2] masterOnly 1 [$iface_timeTx3_3] masterOnly 1 [global] # # Default Data Set # twoStepFlag 1 priority1 128 priority2 128 domainNumber 24 #utc_offset 37 clockClass 6 clockAccuracy 0x27 offsetScaledLogVariance 0xFFFF free_running 0 freq_est_interval 1 dscp_event 0 dscp_general 0 dataset_comparison G.8275.x G.8275.defaultDS.localPriority 128 # # Port Data Set # logAnnounceInterval -3 logSyncInterval -4 logMinDelayReqInterval -4 logMinPdelayReqInterval 0 announceReceiptTimeout 3 syncReceiptTimeout 0 delayAsymmetry 0 fault_reset_interval -4 neighborPropDelayThresh 20000000 masterOnly 0 G.8275.portDS.localPriority 128 # # Run time options # assume_two_step 0 logging_level 6 path_trace_enabled 0 follow_up_info 0 hybrid_e2e 0 inhibit_multicast_service 0 net_sync_monitor 0 tc_spanning_tree 0 tx_timestamp_timeout 50 unicast_listen 0 unicast_master_table 0 unicast_req_duration 3600 use_syslog 1 verbose 0 summary_interval -4 kernel_leap 1 check_fup_sync 0 clock_class_threshold 7 # # Servo Options # pi_proportional_const 0.0 pi_integral_const 0.0 pi_proportional_scale 0.0 pi_proportional_exponent -0.3 pi_proportional_norm_max 0.7 pi_integral_scale 0.0 pi_integral_exponent 0.4 pi_integral_norm_max 0.3 step_threshold 2.0 first_step_threshold 0.00002 clock_servo pi sanity_freq_limit 200000000 ntpshm_segment 0 # # Transport options # transportSpecific 0x0 ptp_dst_mac 01:1B:19:00:00:00 p2p_dst_mac 01:80:C2:00:00:0E udp_ttl 1 udp6_scope 0x0E uds_address /var/run/ptp4l # # Default interface options # clock_type BC network_transport L2 delay_mechanism E2E time_stamping hardware tsproc_mode filter delay_filter moving_median delay_filter_length 10 egressLatency 0 ingressLatency 0 boundary_clock_jbod 1 # # Clock description # productDescription ;; revisionData ;; manufacturerIdentity 00:00:00 userDescription ; timeSource 0x20 ptpClockThreshold: holdOverTimeout: 5 maxOffsetThreshold: 1500 minOffsetThreshold: -1500 recommend: - profile: grandmaster priority: 4 match: - nodeLabel: node-role.kubernetes.io/$mcpNoteSet the value for
ts2phc.nmea_serialportto/dev/gnss0.Create the CR by running the following command:
$ oc create -f three-nic-grandmaster-clock-ptp-config.yaml
Verification
Check that the
PtpConfigprofile is applied to the node.Get the list of pods in the
openshift-ptpnamespace by running the following command:$ oc get pods -n openshift-ptp -o wideExample output
NAME READY STATUS RESTARTS AGE IP NODE linuxptp-daemon-74m3q 3/3 Running 3 4d15h 10.16.230.7 compute-1.example.com ptp-operator-5f4f48d7c-x6zkn 1/1 Running 1 4d15h 10.128.1.145 compute-1.example.comCheck that the profile is correct. Run the following command, and examine the logs of the
linuxptpdaemon that corresponds to the node you specified in thePtpConfigprofile:$ oc logs linuxptp-daemon-74m3q -n openshift-ptp -c linuxptp-daemon-containerExample output
ts2phc[2527.586]: [ts2phc.0.config:7] adding tstamp 1742826342.000000000 to clock /dev/ptp11 ts2phc[2527.586]: [ts2phc.0.config:7] adding tstamp 1742826342.000000000 to clock /dev/ptp7 ts2phc[2527.586]: [ts2phc.0.config:7] adding tstamp 1742826342.000000000 to clock /dev/ptp14 ts2phc[2527.586]: [ts2phc.0.config:7] nmea delay: 56308811 ns ts2phc[2527.586]: [ts2phc.0.config:6] /dev/ptp14 offset 0 s2 freq +0 ts2phc[2527.587]: [ts2phc.0.config:6] /dev/ptp7 offset 0 s2 freq +0 ts2phc[2527.587]: [ts2phc.0.config:6] /dev/ptp11 offset 0 s2 freq -0 I0324 14:25:05.000439 106907 stats.go:61] state updated for ts2phc =s2 I0324 14:25:05.000504 106907 event.go:419] dpll State s2, gnss State s2, tsphc state s2, gm state s2, I0324 14:25:05.000906 106907 stats.go:61] state updated for ts2phc =s2 I0324 14:25:05.001059 106907 stats.go:61] state updated for ts2phc =s2 ts2phc[1742826305]:[ts2phc.0.config] ens4f0 nmea_status 1 offset 0 s2 GM[1742826305]:[ts2phc.0.config] ens4f0 T-GM-STATUS s2where:
adding tstamp <timestamp> to clock /dev/ptp<N>-
Indicates
ts2phcis actively synchronizing the PTP hardware clock (PHC) by applying a specific timestamp. /dev/ptp<N> offset 0 s2 freq +0-
Displays the estimated offset between the PTP device and the reference; an offset of 0 and state
s2signifies full synchronization. T-GM-STATUS s2-
Confirms the Telecom Grandmaster (T-GM) is in a locked state (
s2), providing a stable time reference for the network.
15.2.5. Grandmaster clock PtpConfig configuration reference
The following reference information describes the configuration options for the PtpConfig custom resource (CR) that configures the linuxptp services (ptp4l, phc2sys, ts2phc) as a grandmaster clock.
| PtpConfig CR field | Description |
|---|---|
|
|
Specify an array of
The plugin mechanism allows the PTP Operator to do automated hardware configuration. For the Intel Westport Channel NIC, when |
|
|
Specify system configuration options for the |
|
|
Specify the required configuration to start |
|
| Specify the maximum amount of time to wait for the transmit (TX) timestamp from the sender before discarding the data. |
|
| Specify the JBOD boundary clock time delay value. This value is used to correct the time values that are passed between the network time devices. |
|
|
Specify system config options for the Note
Ensure that the network interface listed here is configured as grandmaster and is referenced as required in the |
|
|
Configure the scheduling policy for |
|
|
Set an integer value from 1-65 to configure FIFO priority for |
|
|
Optional. If |
|
|
Sets the configuration for the
|
|
|
Set options for the |
|
|
Specify an array of one or more |
|
|
Specify the |
|
|
Specify the |
|
|
Specify |
|
|
Set |
|
|
Set |
15.2.5.1. Grandmaster clock class sync state reference
The following table describes the PTP grandmaster clock (T-GM) gm.ClockClass states.
Clock class states categorize T-GM clocks based on their accuracy and stability with regard to the Primary Reference Time Clock (PRTC) or other timing source.
Holdover specification is the amount of time a PTP clock can maintain synchronization without receiving updates from the primary time source.
| Clock class state | Description |
|---|---|
|
|
T-GM clock is connected to a PRTC in |
|
|
T-GM clock is in |
|
|
T-GM clock is in |
For more information, see "Phase/time traceability information", ITU-T G.8275.1/Y.1369.1 Recommendations.
15.2.5.2. Intel Westport Channel E810 hardware configuration reference
Use this information to understand how to use the Intel E810-XXVDA4T hardware plugin to configure the E810 network interface as PTP grandmaster clock. Hardware pin configuration determines how the network interface interacts with other components and devices in the system. The E810-XXVDA4T NIC has four connectors for external 1PPS signals: SMA1, SMA2, U.FL1, and U.FL2.
| Hardware pin | Recommended setting | Description |
|---|---|---|
|
|
|
Disables the |
|
|
|
Disables the |
|
|
|
Disables the |
|
|
|
Disables the |
SMA1 and U.FL1 connectors share channel one. SMA2 and U.FL2 connectors share channel two.
Set spec.profile.plugins.e810.ublxCmds parameters to configure the GNSS clock in the PtpConfig custom resource (CR).
You must configure an offset value to compensate for T-GM GPS antenna cable signal delay. To configure the optimal T-GM antenna offset value, make precise measurements of the GNSS antenna cable signal delay. Red Hat cannot assist in this measurement or provide any values for the required delay offsets.
Each of these ublxCmds stanzas correspond to a configuration that is applied to the host NIC by using ubxtool commands. For example:
ublxCmds:
- args:
- "-P"
- "29.20"
- "-z"
- "CFG-HW-ANT_CFG_VOLTCTRL,1"
- "-z"
- "CFG-TP-ANT_CABLEDELAY,<antenna_delay_offset>"
reportOutput: falsewhere:
"CFG-TP-ANT_CABLEDELAY,<antenna_delay_offset>"- Measured T-GM antenna delay offset in nanoseconds. To get the required delay offset value, you must measure the cable delay using external test equipment.
The following table describes the equivalent ubxtool commands:
| ubxtool command | Description |
|---|---|
|
|
Enables antenna voltage control, allows antenna status to be reported in the |
|
| Enables the antenna to receive GPS signals. |
|
| Configures the antenna to receive signal from the Galileo GPS satellite. |
|
| Disables the antenna from receiving signal from the GLONASS GPS satellite. |
|
| Disables the antenna from receiving signal from the BeiDou GPS satellite. |
|
| Disables the antenna from receiving signal from the SBAS GPS satellite. |
|
| Configures the GNSS receiver survey-in process to improve its initial position estimate. This can take up to 24 hours to achieve an optimal result. |
|
| Runs a single automated scan of the hardware and reports on the NIC state and configuration settings. |
15.2.5.3. Dual E810 Westport Channel NIC configuration reference
Use this information to understand how to use the Intel E810-XXVDA4T hardware plugin to configure a pair of E810 network interfaces as PTP grandmaster clock (T-GM).
Before you configure the dual-NIC cluster host, you must connect the two NICs with an SMA1 cable using the 1PPS faceplace connections.
When you configure a dual-NIC T-GM, you need to compensate for the 1PPS signal delay that occurs when you connect the NICs using the SMA1 connection ports. Various factors such as cable length, ambient temperature, and component and manufacturing tolerances can affect the signal delay. To compensate for the delay, you must calculate the specific value that you use to offset the signal delay.
| PtpConfig field | Description |
|---|---|
|
| Configure the E810 hardware pins using the PTP Operator E810 hardware plugin.
|
|
|
Use the |
|
|
Set the value of |
Each value in the spec.profile.plugins.e810.pins list follows the <function> <channel_number> format.
Where:
<function>: Specifies the pin role. The following values are associated with the pin role:
-
0: Disabled -
1: Receive (Rx) – for 1PPS IN -
2: Transmit (Tx) – for 1PPS OUT
<channel_number>: A number associated with the physical connector. The following channel numbers are associated with the physical connectors:
-
1:SMA1orU.FL1 -
2:SMA2orU.FL2
Examples:
-
2 1: Enables1PPS OUT(Tx) onSMA1. -
1 1: Enables1PPS IN(Rx) onSMA1.
The PTP Operator passes these values to the Intel E810 hardware plugin and writes them to the sysfs pin configuration interface on each NIC.
15.2.5.4. 3-card E810 NIC configuration reference
Use this information to understand how to configure 3 E810 NICs as PTP grandmaster clock (T-GM).
Before you configure the 3-card cluster host, you must connect the 3 NICs by using the 1PPS faceplate connections. The primary NIC 1PPS_out outputs feed the other 2 NICs.
When you configure a 3-card T-GM, you need to compensate for the 1PPS signal delay that occurs when you connect the NICs by using the SMA1 connection ports. Various factors such as cable length, ambient temperature, and component and manufacturing tolerances can affect the signal delay. To compensate for the delay, you must calculate the specific value that you use to offset the signal delay.
| PtpConfig field | Description |
|---|---|
|
| Configure the E810 hardware pins with the PTP Operator E810 hardware plugin.
|
|
|
Use the |
|
|
Set the value of |
15.2.6. Configuring dynamic leap seconds handling for PTP grandmaster clocks
The PTP Operator container image includes the latest leap-seconds.list file that is available at the time of release.
You can configure the PTP Operator to automatically update the leap second file by using Global Positioning System (GPS) announcements.
Leap second information is stored in an automatically generated ConfigMap resource named leap-configmap in the openshift-ptp namespace. The PTP Operator mounts the leap-configmap resource as a volume in the linuxptp-daemon pod that is accessible by the ts2phc process.
If the GPS satellite broadcasts new leap second data, the PTP Operator updates the leap-configmap resource with the new data. The ts2phc process picks up the changes automatically.
The following procedure is provided as reference. The 4.16 version of the PTP Operator enables automatic leap second management by default.
Prerequisites
-
You have installed the OpenShift CLI (
oc). -
You have logged in as a user with
cluster-adminprivileges. - You have installed the PTP Operator and configured a PTP grandmaster clock (T-GM) in the cluster.
Procedure
Configure automatic leap second handling in the
phc2sysOptssection of thePtpConfigCR. Set the following options:phc2sysOpts: -r -u 0 -m -N 8 -R 16 -S 2 -s ens2f0 -n 24NotePreviously, the T-GM required an offset adjustment in the
phc2sysconfiguration (-O -37) to account for historical leap seconds. This is no longer needed.Configure the Intel e810 NIC to enable periodical reporting of
NAV-TIMELSmessages by the GPS receiver in thespec.profile.plugins.e810.ublxCmdssection of thePtpConfigCR. For example:- args: #ubxtool -P 29.20 -p CFG-MSG,1,38,248 - "-P" - "29.20" - "-p" - "CFG-MSG,1,38,248"
Verification
Validate that the configured T-GM is receiving
NAV-TIMELSmessages from the connected GPS. Run the following command:$ oc -n openshift-ptp -c linuxptp-daemon-container exec -it $(oc -n openshift-ptp get pods -o name | grep daemon) -- ubxtool -t -p NAV-TIMELS -P 29.20Example output
1722509534.4417 UBX-NAV-STATUS: iTOW 384752000 gpsFix 5 flags 0xdd fixStat 0x0 flags2 0x8 ttff 18261, msss 1367642864 1722509534.4419 UBX-NAV-TIMELS: iTOW 384752000 version 0 reserved2 0 0 0 srcOfCurrLs 2 currLs 18 srcOfLsChange 2 lsChange 0 timeToLsEvent 70376866 dateOfLsGpsWn 2441 dateOfLsGpsDn 7 reserved2 0 0 0 valid x3 1722509534.4421 UBX-NAV-CLOCK: iTOW 384752000 clkB 784281 clkD 435 tAcc 3 fAcc 215 1722509535.4477 UBX-NAV-STATUS: iTOW 384753000 gpsFix 5 flags 0xdd fixStat 0x0 flags2 0x8 ttff 18261, msss 1367643864 1722509535.4479 UBX-NAV-CLOCK: iTOW 384753000 clkB 784716 clkD 435 tAcc 3 fAcc 218Validate that the
leap-configmapresource has been successfully generated by the PTP Operator and is up to date with the latest version of the leap-seconds.list. Run the following command:$ oc -n openshift-ptp get configmap leap-configmap -o jsonpath='{.data.<node_name>}'Replace
<node_name>with the node where you have installed and configured the PTP T-GM clock with automatic leap second management. Escape special characters in the node name. For example,node-1\.example\.com.Example output
# Do not edit # This file is generated automatically by linuxptp-daemon #$ 3913697179 #@ 4291747200 2272060800 10 # 1 Jan 1972 2287785600 11 # 1 Jul 1972 2303683200 12 # 1 Jan 1973 2335219200 13 # 1 Jan 1974 2366755200 14 # 1 Jan 1975 2398291200 15 # 1 Jan 1976 2429913600 16 # 1 Jan 1977 2461449600 17 # 1 Jan 1978 2492985600 18 # 1 Jan 1979 2524521600 19 # 1 Jan 1980 2571782400 20 # 1 Jul 1981 2603318400 21 # 1 Jul 1982 2634854400 22 # 1 Jul 1983 2698012800 23 # 1 Jul 1985 2776982400 24 # 1 Jan 1988 2840140800 25 # 1 Jan 1990 2871676800 26 # 1 Jan 1991 2918937600 27 # 1 Jul 1992 2950473600 28 # 1 Jul 1993 2982009600 29 # 1 Jul 1994 3029443200 30 # 1 Jan 1996 3076704000 31 # 1 Jul 1997 3124137600 32 # 1 Jan 1999 3345062400 33 # 1 Jan 2006 3439756800 34 # 1 Jan 2009 3550089600 35 # 1 Jul 2012 3644697600 36 # 1 Jul 2015 3692217600 37 # 1 Jan 2017 #h e65754d4 8f39962b aa854a61 661ef546 d2af0bfa
15.2.7. Configuring linuxptp services as a boundary clock
You can configure the linuxptp services (ptp4l, phc2sys) as boundary clock by creating a PtpConfig custom resource (CR) object.
Use the following example PtpConfig CR as the basis to configure linuxptp services as the boundary clock for your particular hardware and environment. This example CR does not configure PTP fast events. To configure PTP fast events, set appropriate values for ptp4lOpts, ptp4lConf, and ptpClockThreshold. ptpClockThreshold is used only when events are enabled. See "Configuring the PTP fast event notifications publisher" for more information.
Prerequisites
-
Install the OpenShift CLI (
oc). -
Log in as a user with
cluster-adminprivileges. - Install the PTP Operator.
Procedure
Create the following
PtpConfigCR, and then save the YAML in theboundary-clock-ptp-config.yamlfile.Example PTP boundary clock configuration
apiVersion: ptp.openshift.io/v1 kind: PtpConfig metadata: name: boundary-clock namespace: openshift-ptp annotations: {} spec: profile: - name: boundary-clock ptp4lOpts: "-2" phc2sysOpts: "-a -r -n 24" ptpSchedulingPolicy: SCHED_FIFO ptpSchedulingPriority: 10 ptpSettings: logReduce: "true" ptp4lConf: | # The interface name is hardware-specific [$iface_slave] masterOnly 0 [$iface_master_1] masterOnly 1 [$iface_master_2] masterOnly 1 [$iface_master_3] masterOnly 1 [global] # # Default Data Set # twoStepFlag 1 slaveOnly 0 priority1 128 priority2 128 domainNumber 24 #utc_offset 37 clockClass 248 clockAccuracy 0xFE offsetScaledLogVariance 0xFFFF free_running 0 freq_est_interval 1 dscp_event 0 dscp_general 0 dataset_comparison G.8275.x G.8275.defaultDS.localPriority 128 # # Port Data Set # logAnnounceInterval -3 logSyncInterval -4 logMinDelayReqInterval -4 logMinPdelayReqInterval -4 announceReceiptTimeout 3 syncReceiptTimeout 0 delayAsymmetry 0 fault_reset_interval -4 neighborPropDelayThresh 20000000 masterOnly 0 G.8275.portDS.localPriority 128 # # Run time options # assume_two_step 0 logging_level 6 path_trace_enabled 0 follow_up_info 0 hybrid_e2e 0 inhibit_multicast_service 0 net_sync_monitor 0 tc_spanning_tree 0 tx_timestamp_timeout 50 unicast_listen 0 unicast_master_table 0 unicast_req_duration 3600 use_syslog 1 verbose 0 summary_interval 0 kernel_leap 1 check_fup_sync 0 clock_class_threshold 135 # # Servo Options # pi_proportional_const 0.0 pi_integral_const 0.0 pi_proportional_scale 0.0 pi_proportional_exponent -0.3 pi_proportional_norm_max 0.7 pi_integral_scale 0.0 pi_integral_exponent 0.4 pi_integral_norm_max 0.3 step_threshold 2.0 first_step_threshold 0.00002 max_frequency 900000000 clock_servo pi sanity_freq_limit 200000000 ntpshm_segment 0 # # Transport options # transportSpecific 0x0 ptp_dst_mac 01:1B:19:00:00:00 p2p_dst_mac 01:80:C2:00:00:0E udp_ttl 1 udp6_scope 0x0E uds_address /var/run/ptp4l # # Default interface options # clock_type BC network_transport L2 delay_mechanism E2E time_stamping hardware tsproc_mode filter delay_filter moving_median delay_filter_length 10 egressLatency 0 ingressLatency 0 boundary_clock_jbod 0 # # Clock description # productDescription ;; revisionData ;; manufacturerIdentity 00:00:00 userDescription ; timeSource 0xA0 recommend: - profile: boundary-clock priority: 4 match: - nodeLabel: "node-role.kubernetes.io/$mcp"Expand Table 15.7. PTP boundary clock CR configuration options CR field Description nameThe name of the
PtpConfigCR.profileSpecify an array of one or more
profileobjects.nameSpecify the name of a profile object which uniquely identifies a profile object.
ptp4lOptsSpecify system config options for the
ptp4lservice. The options should not include the network interface name-i <interface>and service config file-f /etc/ptp4l.confbecause the network interface name and the service config file are automatically appended.ptp4lConfSpecify the required configuration to start
ptp4las boundary clock. For example,ens1f0synchronizes from a grandmaster clock andens1f3synchronizes connected devices.<interface_1>The interface that receives the synchronization clock.
<interface_2>The interface that sends the synchronization clock.
tx_timestamp_timeoutFor Intel Columbiaville 800 Series NICs, set
tx_timestamp_timeoutto50.boundary_clock_jbodFor Intel Columbiaville 800 Series NICs, ensure
boundary_clock_jbodis set to0. For Intel Fortville X710 Series NICs, ensureboundary_clock_jbodis set to1.phc2sysOptsSpecify system config options for the
phc2sysservice. If this field is empty, the PTP Operator does not start thephc2sysservice.ptpSchedulingPolicyScheduling policy for ptp4l and phc2sys processes. Default value is
SCHED_OTHER. UseSCHED_FIFOon systems that support FIFO scheduling.ptpSchedulingPriorityInteger value from 1-65 used to set FIFO priority for
ptp4landphc2sysprocesses whenptpSchedulingPolicyis set toSCHED_FIFO. TheptpSchedulingPriorityfield is not used whenptpSchedulingPolicyis set toSCHED_OTHER.ptpClockThresholdOptional. If
ptpClockThresholdis not present, default values are used for theptpClockThresholdfields.ptpClockThresholdconfigures how long after the PTP master clock is disconnected before PTP events are triggered.holdOverTimeoutis the time value in seconds before the PTP clock event state changes toFREERUNwhen the PTP master clock is disconnected. ThemaxOffsetThresholdandminOffsetThresholdsettings configure offset values in nanoseconds that compare against the values forCLOCK_REALTIME(phc2sys) or master offset (ptp4l). When theptp4lorphc2sysoffset value is outside this range, the PTP clock state is set toFREERUN. When the offset value is within this range, the PTP clock state is set toLOCKED.recommendSpecify an array of one or more
recommendobjects that define rules on how theprofileshould be applied to nodes..recommend.profileSpecify the
.recommend.profileobject name defined in theprofilesection..recommend.prioritySpecify the
prioritywith an integer value between0and99. A larger number gets lower priority, so a priority of99is lower than a priority of10. If a node can be matched with multiple profiles according to rules defined in thematchfield, the profile with the higher priority is applied to that node..recommend.matchSpecify
.recommend.matchrules withnodeLabelornodeNamevalues..recommend.match.nodeLabelSet
nodeLabelwith thekeyof thenode.Labelsfield from the node object by using theoc get nodes --show-labelscommand. For example,node-role.kubernetes.io/worker..recommend.match.nodeNameSet
nodeNamewith the value of thenode.Namefield from the node object by using theoc get nodescommand. For example,compute-1.example.com.Create the CR by running the following command:
$ oc create -f boundary-clock-ptp-config.yaml
Verification
Check that the
PtpConfigprofile is applied to the node.Get the list of pods in the
openshift-ptpnamespace by running the following command:$ oc get pods -n openshift-ptp -o wideExample output
NAME READY STATUS RESTARTS AGE IP NODE linuxptp-daemon-4xkbb 1/1 Running 0 43m 10.1.196.24 compute-0.example.com linuxptp-daemon-tdspf 1/1 Running 0 43m 10.1.196.25 compute-1.example.com ptp-operator-657bbb64c8-2f8sj 1/1 Running 0 43m 10.129.0.61 control-plane-1.example.comCheck that the profile is correct. Examine the logs of the
linuxptpdaemon that corresponds to the node you specified in thePtpConfigprofile. Run the following command:$ oc logs linuxptp-daemon-4xkbb -n openshift-ptp -c linuxptp-daemon-containerExample output
I1115 09:41:17.117596 4143292 daemon.go:107] in applyNodePTPProfile I1115 09:41:17.117604 4143292 daemon.go:109] updating NodePTPProfile to: I1115 09:41:17.117607 4143292 daemon.go:110] ------------------------------------ I1115 09:41:17.117612 4143292 daemon.go:102] Profile Name: profile1 I1115 09:41:17.117616 4143292 daemon.go:102] Interface: I1115 09:41:17.117620 4143292 daemon.go:102] Ptp4lOpts: -2 I1115 09:41:17.117623 4143292 daemon.go:102] Phc2sysOpts: -a -r -n 24 I1115 09:41:17.117626 4143292 daemon.go:116] ------------------------------------
15.2.7.1. Configuring linuxptp services as boundary clocks for dual-NIC hardware
You can configure the linuxptp services (ptp4l, phc2sys) as boundary clocks for dual-NIC hardware by creating a PtpConfig custom resource (CR) object for each NIC.
Dual NIC hardware allows you to connect each NIC to the same upstream leader clock with separate ptp4l instances for each NIC feeding the downstream clocks.
Prerequisites
-
Install the OpenShift CLI (
oc). -
Log in as a user with
cluster-adminprivileges. - Install the PTP Operator.
Procedure
Create two separate
PtpConfigCRs, one for each NIC, using the reference CR in "Configuring linuxptp services as a boundary clock" as the basis for each CR. For example:Create
boundary-clock-ptp-config-nic1.yaml, specifying values forphc2sysOpts:apiVersion: ptp.openshift.io/v1 kind: PtpConfig metadata: name: boundary-clock-ptp-config-nic1 namespace: openshift-ptp spec: profile: - name: "profile1" ptp4lOpts: "-2 --summary_interval -4" ptp4lConf: | [ens5f1] masterOnly 1 [ens5f0] masterOnly 0 ... phc2sysOpts: "-a -r -m -n 24 -N 8 -R 16"where:
ptp4lConf-
Specifies the required interfaces to start
ptp4las a boundary clock. For example,ens5f0synchronizes from a grandmaster clock andens5f1synchronizes connected devices. phc2sysOpts: "-a -r -m -n 24 -N 8 -R 16"-
Sets the required
phc2sysOptsvalues.-mprints messages tostdout. Thelinuxptp-daemonDaemonSetparses the logs and generates Prometheus metrics.
Create
boundary-clock-ptp-config-nic2.yaml, removing thephc2sysOptsfield altogether to disable thephc2sysservice for the second NIC:apiVersion: ptp.openshift.io/v1 kind: PtpConfig metadata: name: boundary-clock-ptp-config-nic2 namespace: openshift-ptp spec: profile: - name: "profile2" ptp4lOpts: "-2 --summary_interval -4" ptp4lConf: | [ens7f1] masterOnly 1 [ens7f0] masterOnly 0 ...Specify the required interfaces to start
ptp4las a boundary clock on the second NIC.NoteYou must completely remove the
phc2sysOptsfield from the secondPtpConfigCR to disable thephc2sysservice on the second NIC.
Create the dual-NIC
PtpConfigCRs by running the following commands:Create the CR that configures PTP for the first NIC:
$ oc create -f boundary-clock-ptp-config-nic1.yamlCreate the CR that configures PTP for the second NIC:
$ oc create -f boundary-clock-ptp-config-nic2.yaml
Verification
Check that the PTP Operator has applied the
PtpConfigCRs for both NICs. Examine the logs for thelinuxptpdaemon corresponding to the node that has the dual-NIC hardware installed. For example, run the following command:$ oc logs linuxptp-daemon-cvgr6 -n openshift-ptp -c linuxptp-daemon-containerExample output
ptp4l[80828.335]: [ptp4l.1.config] master offset 5 s2 freq -5727 path delay 519 ptp4l[80828.343]: [ptp4l.0.config] master offset -5 s2 freq -10607 path delay 533 phc2sys[80828.390]: [ptp4l.0.config] CLOCK_REALTIME phc offset 1 s2 freq -87239 delay 539
15.2.7.2. Configuring linuxptp as a highly available system clock for dual-NIC Intel E810 PTP boundary clocks
You can configure the linuxptp services ptp4l and phc2sys as a highly available (HA) system clock for dual PTP boundary clocks (T-BC).
The highly available system clock uses multiple time sources from dual-NIC Intel E810 Salem channel hardware configured as two boundary clocks. Two boundary clocks instances participate in the HA setup, each with its own configuration profile. You connect each NIC to the same upstream leader clock with separate ptp4l instances for each NIC feeding the downstream clocks.
Create two PtpConfig custom resource (CR) objects that configure the NICs as T-BC and a third PtpConfig CR that configures high availability between the two NICs.
You set phc2SysOpts options once in the PtpConfig CR that configures HA. Set the phc2sysOpts field to an empty string in the PtpConfig CRs that configure the two NICs. This prevents individual phc2sys processes from being set up for the two profiles.
The third PtpConfig CR configures a highly available system clock service. The CR sets the ptp4lOpts field to an empty string to prevent the ptp4l process from running. The CR adds profiles for the ptp4l configurations under the spec.profile.ptpSettings.haProfiles key and passes the kernel socket path of those profiles to the phc2sys service. When a ptp4l failure occurs, the phc2sys service switches to the backup ptp4l configuration. When the primary profile becomes active again, the phc2sys service reverts to the original state.
Ensure that you set spec.recommend.priority to the same value for all three PtpConfig CRs that you use to configure HA.
Prerequisites
-
Install the OpenShift CLI (
oc). -
Log in as a user with
cluster-adminprivileges. - Install the PTP Operator.
- Configure a cluster node with Intel E810 Salem channel dual-NIC.
Procedure
Create two separate
PtpConfigCRs, one for each NIC, using the CRs in "Configuring linuxptp services as boundary clocks for dual-NIC hardware" as a reference for each CR.Create the
ha-ptp-config-nic1.yamlfile, specifying an empty string for thephc2sysOptsfield. For example:apiVersion: ptp.openshift.io/v1 kind: PtpConfig metadata: name: ha-ptp-config-nic1 namespace: openshift-ptp spec: profile: - name: "ha-ptp-config-profile1" ptp4lOpts: "-2 --summary_interval -4" ptp4lConf: | [ens5f1] masterOnly 1 [ens5f0] masterOnly 0 #... phc2sysOpts: ""where:
ptp4lConf-
Specifies the required interfaces to start
ptp4las a boundary clock. For example,ens5f0synchronizes from a grandmaster clock andens5f1synchronizes connected devices. phc2sysOpts: ""-
Sets
phc2sysOptswith an empty string. These values are populated from thespec.profile.ptpSettings.haProfilesfield of thePtpConfigCR that configures high availability.
Apply the
PtpConfigCR for NIC 1 by running the following command:$ oc create -f ha-ptp-config-nic1.yamlCreate the
ha-ptp-config-nic2.yamlfile, specifying an empty string for thephc2sysOptsfield. For example:apiVersion: ptp.openshift.io/v1 kind: PtpConfig metadata: name: ha-ptp-config-nic2 namespace: openshift-ptp spec: profile: - name: "ha-ptp-config-profile2" ptp4lOpts: "-2 --summary_interval -4" ptp4lConf: | [ens7f1] masterOnly 1 [ens7f0] masterOnly 0 #... phc2sysOpts: ""Apply the
PtpConfigCR for NIC 2 by running the following command:$ oc create -f ha-ptp-config-nic2.yaml
Create the
PtpConfigCR that configures the HA system clock. For example:Create the
ptp-config-for-ha.yamlfile. SethaProfilesto match themetadata.namefields that are set in thePtpConfigCRs that configure the two NICs. For example:haProfiles: ha-ptp-config-nic1,ha-ptp-config-nic2apiVersion: ptp.openshift.io/v1 kind: PtpConfig metadata: name: boundary-ha namespace: openshift-ptp annotations: {} spec: profile: - name: "boundary-ha" ptp4lOpts: "" phc2sysOpts: "-a -r -n 24" ptpSchedulingPolicy: SCHED_FIFO ptpSchedulingPriority: 10 ptpSettings: logReduce: "true" haProfiles: "$profile1,$profile2" recommend: - profile: "boundary-ha" priority: 4 match: - nodeLabel: "node-role.kubernetes.io/$mcp"Set the
ptp4lOptsfield to an empty string. If it is not empty, thep4ptlprocess starts with a critical error.ImportantDo not apply the high availability
PtpConfigCR before thePtpConfigCRs that configure the individual NICs.Apply the HA
PtpConfigCR by running the following command:$ oc create -f ptp-config-for-ha.yaml
Verification
Verify that the PTP Operator has applied the
PtpConfigCRs correctly. Perform the following steps:Get the list of pods in the
openshift-ptpnamespace by running the following command:$ oc get pods -n openshift-ptp -o wideExample output
NAME READY STATUS RESTARTS AGE IP NODE linuxptp-daemon-4xkrb 1/1 Running 0 43m 10.1.196.24 compute-0.example.com ptp-operator-657bbq64c8-2f8sj 1/1 Running 0 43m 10.129.0.61 control-plane-1.example.comNoteThere should be only one
linuxptp-daemonpod.Check that the profile is correct by running the following command. Examine the logs of the
linuxptpdaemon that corresponds to the node you specified in thePtpConfigprofile.$ oc logs linuxptp-daemon-4xkrb -n openshift-ptp -c linuxptp-daemon-containerExample output
I1115 09:41:17.117596 4143292 daemon.go:107] in applyNodePTPProfile I1115 09:41:17.117604 4143292 daemon.go:109] updating NodePTPProfile to: I1115 09:41:17.117607 4143292 daemon.go:110] ------------------------------------ I1115 09:41:17.117612 4143292 daemon.go:102] Profile Name: ha-ptp-config-profile1 I1115 09:41:17.117616 4143292 daemon.go:102] Interface: I1115 09:41:17.117620 4143292 daemon.go:102] Ptp4lOpts: -2 I1115 09:41:17.117623 4143292 daemon.go:102] Phc2sysOpts: -a -r -n 24 I1115 09:41:17.117626 4143292 daemon.go:116] ------------------------------------
15.2.8. Configuring linuxptp services as an ordinary clock
You can configure linuxptp services (ptp4l, phc2sys) as ordinary clock by creating a PtpConfig custom resource (CR) object.
Use the following example PtpConfig CR as the basis to configure linuxptp services as an ordinary clock for your particular hardware and environment. This example CR does not configure PTP fast events. To configure PTP fast events, set appropriate values for ptp4lOpts, ptp4lConf, and ptpClockThreshold. ptpClockThreshold is required only when events are enabled. See "Configuring the PTP fast event notifications publisher" for more information.
Prerequisites
-
Install the OpenShift CLI (
oc). -
Log in as a user with
cluster-adminprivileges. - Install the PTP Operator.
Procedure
Create the following
PtpConfigCR, and then save the YAML in theordinary-clock-ptp-config.yamlfile.Example PTP ordinary clock configuration
apiVersion: ptp.openshift.io/v1 kind: PtpConfig metadata: name: ordinary-clock namespace: openshift-ptp annotations: {} spec: profile: - name: ordinary-clock # The interface name is hardware-specific interface: $interface ptp4lOpts: "-2 -s" phc2sysOpts: "-a -r -n 24" ptpSchedulingPolicy: SCHED_FIFO ptpSchedulingPriority: 10 ptpSettings: logReduce: "true" ptp4lConf: | [global] # # Default Data Set # twoStepFlag 1 slaveOnly 1 priority1 128 priority2 128 domainNumber 24 #utc_offset 37 clockClass 255 clockAccuracy 0xFE offsetScaledLogVariance 0xFFFF free_running 0 freq_est_interval 1 dscp_event 0 dscp_general 0 dataset_comparison G.8275.x G.8275.defaultDS.localPriority 128 # # Port Data Set # logAnnounceInterval -3 logSyncInterval -4 logMinDelayReqInterval -4 logMinPdelayReqInterval -4 announceReceiptTimeout 3 syncReceiptTimeout 0 delayAsymmetry 0 fault_reset_interval -4 neighborPropDelayThresh 20000000 masterOnly 0 G.8275.portDS.localPriority 128 # # Run time options # assume_two_step 0 logging_level 6 path_trace_enabled 0 follow_up_info 0 hybrid_e2e 0 inhibit_multicast_service 0 net_sync_monitor 0 tc_spanning_tree 0 tx_timestamp_timeout 50 unicast_listen 0 unicast_master_table 0 unicast_req_duration 3600 use_syslog 1 verbose 0 summary_interval 0 kernel_leap 1 check_fup_sync 0 clock_class_threshold 7 # # Servo Options # pi_proportional_const 0.0 pi_integral_const 0.0 pi_proportional_scale 0.0 pi_proportional_exponent -0.3 pi_proportional_norm_max 0.7 pi_integral_scale 0.0 pi_integral_exponent 0.4 pi_integral_norm_max 0.3 step_threshold 2.0 first_step_threshold 0.00002 max_frequency 900000000 clock_servo pi sanity_freq_limit 200000000 ntpshm_segment 0 # # Transport options # transportSpecific 0x0 ptp_dst_mac 01:1B:19:00:00:00 p2p_dst_mac 01:80:C2:00:00:0E udp_ttl 1 udp6_scope 0x0E uds_address /var/run/ptp4l # # Default interface options # clock_type OC network_transport L2 delay_mechanism E2E time_stamping hardware tsproc_mode filter delay_filter moving_median delay_filter_length 10 egressLatency 0 ingressLatency 0 boundary_clock_jbod 0 # # Clock description # productDescription ;; revisionData ;; manufacturerIdentity 00:00:00 userDescription ; timeSource 0xA0 recommend: - profile: ordinary-clock priority: 4 match: - nodeLabel: "node-role.kubernetes.io/$mcp"Expand Table 15.8. PTP ordinary clock CR configuration options CR field Description nameThe name of the
PtpConfigCR.profileSpecify an array of one or more
profileobjects. Each profile must be uniquely named.interfaceSpecify the network interface to be used by the
ptp4lservice, for exampleens787f1.ptp4lOptsSpecify system config options for the
ptp4lservice, for example-2to select the IEEE 802.3 network transport. The options should not include the network interface name-i <interface>and service config file-f /etc/ptp4l.confbecause the network interface name and the service config file are automatically appended. Append--summary_interval -4to use PTP fast events with this interface.phc2sysOptsSpecify system config options for the
phc2sysservice. If this field is empty, the PTP Operator does not start thephc2sysservice. For Intel Columbiaville 800 Series NICs, setphc2sysOptsoptions to-a -r -m -n 24 -N 8 -R 16.-mprints messages tostdout. Thelinuxptp-daemonDaemonSetparses the logs and generates Prometheus metrics.ptp4lConfSpecify a string that contains the configuration to replace the default
/etc/ptp4l.conffile. To use the default configuration, leave the field empty.tx_timestamp_timeoutFor Intel Columbiaville 800 Series NICs, set
tx_timestamp_timeoutto50.boundary_clock_jbodFor Intel Columbiaville 800 Series NICs, set
boundary_clock_jbodto0.ptpSchedulingPolicyScheduling policy for
ptp4landphc2sysprocesses. Default value isSCHED_OTHER. UseSCHED_FIFOon systems that support FIFO scheduling.ptpSchedulingPriorityInteger value from 1-65 used to set FIFO priority for
ptp4landphc2sysprocesses whenptpSchedulingPolicyis set toSCHED_FIFO. TheptpSchedulingPriorityfield is not used whenptpSchedulingPolicyis set toSCHED_OTHER.ptpClockThresholdOptional. If
ptpClockThresholdis not present, default values are used for theptpClockThresholdfields.ptpClockThresholdconfigures how long after the PTP master clock is disconnected before PTP events are triggered.holdOverTimeoutis the time value in seconds before the PTP clock event state changes toFREERUNwhen the PTP master clock is disconnected. ThemaxOffsetThresholdandminOffsetThresholdsettings configure offset values in nanoseconds that compare against the values forCLOCK_REALTIME(phc2sys) or master offset (ptp4l). When theptp4lorphc2sysoffset value is outside this range, the PTP clock state is set toFREERUN. When the offset value is within this range, the PTP clock state is set toLOCKED.recommendSpecify an array of one or more
recommendobjects that define rules on how theprofileshould be applied to nodes..recommend.profileSpecify the
.recommend.profileobject name defined in theprofilesection..recommend.prioritySet
.recommend.priorityto0for ordinary clock..recommend.matchSpecify
.recommend.matchrules withnodeLabelornodeNamevalues..recommend.match.nodeLabelSet
nodeLabelwith thekeyof thenode.Labelsfield from the node object by using theoc get nodes --show-labelscommand. For example,node-role.kubernetes.io/worker..recommend.match.nodeNameSet
nodeNamewith the value of thenode.Namefield from the node object by using theoc get nodescommand. For example,compute-1.example.com.Create the
PtpConfigCR by running the following command:$ oc create -f ordinary-clock-ptp-config.yaml
Verification
Check that the
PtpConfigprofile is applied to the node.Get the list of pods in the
openshift-ptpnamespace by running the following command:$ oc get pods -n openshift-ptp -o wideExample output
NAME READY STATUS RESTARTS AGE IP NODE linuxptp-daemon-4xkbb 1/1 Running 0 43m 10.1.196.24 compute-0.example.com linuxptp-daemon-tdspf 1/1 Running 0 43m 10.1.196.25 compute-1.example.com ptp-operator-657bbb64c8-2f8sj 1/1 Running 0 43m 10.129.0.61 control-plane-1.example.comCheck that the profile is correct. Examine the logs of the
linuxptpdaemon that corresponds to the node you specified in thePtpConfigprofile. Run the following command:$ oc logs linuxptp-daemon-4xkbb -n openshift-ptp -c linuxptp-daemon-containerExample output
I1115 09:41:17.117596 4143292 daemon.go:107] in applyNodePTPProfile I1115 09:41:17.117604 4143292 daemon.go:109] updating NodePTPProfile to: I1115 09:41:17.117607 4143292 daemon.go:110] ------------------------------------ I1115 09:41:17.117612 4143292 daemon.go:102] Profile Name: profile1 I1115 09:41:17.117616 4143292 daemon.go:102] Interface: ens787f1 I1115 09:41:17.117620 4143292 daemon.go:102] Ptp4lOpts: -2 -s I1115 09:41:17.117623 4143292 daemon.go:102] Phc2sysOpts: -a -r -n 24 I1115 09:41:17.117626 4143292 daemon.go:116] ------------------------------------
15.2.8.1. Intel Columbiaville E800 series NIC as PTP ordinary clock reference
The following table describes the changes that you must make to the reference PTP configuration to use Intel Columbiaville E800 series NICs as ordinary clocks. Make the changes in a PtpConfig custom resource (CR) that you apply to the cluster.
| PTP configuration | Recommended setting |
|---|---|
|
|
|
|
|
|
|
|
|
For phc2sysOpts, -m prints messages to stdout. The linuxptp-daemon DaemonSet parses the logs and generates Prometheus metrics.
15.2.9. Configuring FIFO priority scheduling for PTP hardware
In telco or other deployment types that require low latency performance, PTP daemon threads run in a constrained CPU footprint alongside the rest of the infrastructure components. By default, PTP threads run with the SCHED_OTHER policy. Under high load, these threads might not get the scheduling latency they require for error-free operation.
To mitigate against potential scheduling latency errors, you can configure the PTP Operator linuxptp services to allow threads to run with a SCHED_FIFO policy. If SCHED_FIFO is set for a PtpConfig CR, then ptp4l and phc2sys will run in the parent container under chrt with a priority set by the ptpSchedulingPriority field of the PtpConfig CR.
Setting ptpSchedulingPolicy is optional, and is only required if you are experiencing latency errors.
Procedure
Edit the
PtpConfigCR profile:$ oc edit PtpConfig -n openshift-ptpChange the
ptpSchedulingPolicyandptpSchedulingPriorityfields:apiVersion: ptp.openshift.io/v1 kind: PtpConfig metadata: name: <ptp_config_name> namespace: openshift-ptp ... spec: profile: - name: "profile1" ... ptpSchedulingPolicy: SCHED_FIFO ptpSchedulingPriority: 10where:
ptpSchedulingPolicy: SCHED_FIFO-
Sets the scheduling policy for
ptp4landphc2sysprocesses. UseSCHED_FIFOon systems that support FIFO scheduling. ptpSchedulingPriority: 10-
Sets the integer value 1-65 used to configure FIFO priority for
ptp4landphc2sysprocesses.
-
Save and exit to apply the changes to the
PtpConfigCR.
Verification
Get the name of the
linuxptp-daemonpod and corresponding node where thePtpConfigCR has been applied:$ oc get pods -n openshift-ptp -o wideExample output
NAME READY STATUS RESTARTS AGE IP NODE linuxptp-daemon-gmv2n 3/3 Running 0 1d17h 10.1.196.24 compute-0.example.com linuxptp-daemon-lgm55 3/3 Running 0 1d17h 10.1.196.25 compute-1.example.com ptp-operator-3r4dcvf7f4-zndk7 1/1 Running 0 1d7h 10.129.0.61 control-plane-1.example.comCheck that the
ptp4lprocess is running with the updatedchrtFIFO priority:$ oc -n openshift-ptp logs linuxptp-daemon-lgm55 -c linuxptp-daemon-container|grep chrtExample output
I1216 19:24:57.091872 1600715 daemon.go:285] /bin/chrt -f 65 /usr/sbin/ptp4l -f /var/run/ptp4l.0.config -2 --summary_interval -4 -m
15.2.10. Configuring log filtering for linuxptp services
Modify the PtpConfig custom resource (CR) to configure basic log filtering and exclude log messages that report the master offset value.
Prerequisites
-
Install the OpenShift CLI (
oc). -
Log in as a user with
cluster-adminprivileges. - Install the PTP Operator.
Procedure
Edit the
PtpConfigCR:$ oc edit PtpConfig -n openshift-ptpIn
spec.profile, add theptpSettings.logReducespecification and set the value totrue:apiVersion: ptp.openshift.io/v1 kind: PtpConfig metadata: name: <ptp_config_name> namespace: openshift-ptp ... spec: profile: - name: "profile1" ... ptpSettings: logReduce: "true"NoteFor debugging purposes, you can revert this specification to
Falseto include the master offset messages.-
Save and exit to apply the changes to the
PtpConfigCR.
Verification
Get the name of the
linuxptp-daemonpod and corresponding node where thePtpConfigCR has been applied:$ oc get pods -n openshift-ptp -o wideExample output
NAME READY STATUS RESTARTS AGE IP NODE linuxptp-daemon-gmv2n 3/3 Running 0 1d17h 10.1.196.24 compute-0.example.com linuxptp-daemon-lgm55 3/3 Running 0 1d17h 10.1.196.25 compute-1.example.com ptp-operator-3r4dcvf7f4-zndk7 1/1 Running 0 1d7h 10.129.0.61 control-plane-1.example.comVerify that master offset messages are excluded from the logs by running the following command:
$ oc -n openshift-ptp logs <linux_daemon_container> -c linuxptp-daemon-container | grep "master offset"<linux_daemon_container>is the name of thelinuxptp-daemonpod, for examplelinuxptp-daemon-gmv2n.When you configure the
logReducespecification, this command does not report any instances ofmaster offsetin the logs of thelinuxptpdaemon.
15.2.11. Troubleshooting common PTP Operator issues
Troubleshoot common problems with the PTP Operator by performing the following steps.
Prerequisites
-
Install the OpenShift Container Platform CLI (
oc). -
Log in as a user with
cluster-adminprivileges. - Install the PTP Operator on a bare-metal cluster with hosts that support PTP.
Procedure
Check the Operator and operands are successfully deployed in the cluster for the configured nodes.
$ oc get pods -n openshift-ptp -o wideExample output
NAME READY STATUS RESTARTS AGE IP NODE linuxptp-daemon-lmvgn 3/3 Running 0 4d17h 10.1.196.24 compute-0.example.com linuxptp-daemon-qhfg7 3/3 Running 0 4d17h 10.1.196.25 compute-1.example.com ptp-operator-6b8dcbf7f4-zndk7 1/1 Running 0 5d7h 10.129.0.61 control-plane-1.example.comNoteWhen the PTP fast event bus is enabled, the number of ready
linuxptp-daemonpods is3/3. If the PTP fast event bus is not enabled,2/2is displayed.Check that supported hardware is found in the cluster.
$ oc -n openshift-ptp get nodeptpdevices.ptp.openshift.ioExample output
NAME AGE control-plane-0.example.com 10d control-plane-1.example.com 10d compute-0.example.com 10d compute-1.example.com 10d compute-2.example.com 10dCheck the available PTP network interfaces for a node:
$ oc -n openshift-ptp get nodeptpdevices.ptp.openshift.io <node_name> -o yamlwhere:
- <node_name>
Specifies the node you want to query, for example,
compute-0.example.com.Example output
apiVersion: ptp.openshift.io/v1 kind: NodePtpDevice metadata: creationTimestamp: "2021-09-14T16:52:33Z" generation: 1 name: compute-0.example.com namespace: openshift-ptp resourceVersion: "177400" uid: 30413db0-4d8d-46da-9bef-737bacd548fd spec: {} status: devices: - name: eno1 - name: eno2 - name: eno3 - name: eno4 - name: enp5s0f0 - name: enp5s0f1
Check that the PTP interface is successfully synchronized to the primary clock by accessing the
linuxptp-daemonpod for the corresponding node.Get the name of the
linuxptp-daemonpod and corresponding node you want to troubleshoot by running the following command:$ oc get pods -n openshift-ptp -o wideExample output
NAME READY STATUS RESTARTS AGE IP NODE linuxptp-daemon-lmvgn 3/3 Running 0 4d17h 10.1.196.24 compute-0.example.com linuxptp-daemon-qhfg7 3/3 Running 0 4d17h 10.1.196.25 compute-1.example.com ptp-operator-6b8dcbf7f4-zndk7 1/1 Running 0 5d7h 10.129.0.61 control-plane-1.example.comRemote shell into the required
linuxptp-daemoncontainer:$ oc rsh -n openshift-ptp -c linuxptp-daemon-container <linux_daemon_container>where:
- <linux_daemon_container>
-
is the container you want to diagnose, for example
linuxptp-daemon-lmvgn.
In the remote shell connection to the
linuxptp-daemoncontainer, use the PTP Management Client (pmc) tool to diagnose the network interface. Run the followingpmccommand to check the sync status of the PTP device, for exampleptp4l.# pmc -u -f /var/run/ptp4l.0.config -b 0 'GET PORT_DATA_SET'Example output when the node is successfully synced to the primary clock
sending: GET PORT_DATA_SET 40a6b7.fffe.166ef0-1 seq 0 RESPONSE MANAGEMENT PORT_DATA_SET portIdentity 40a6b7.fffe.166ef0-1 portState SLAVE logMinDelayReqInterval -4 peerMeanPathDelay 0 logAnnounceInterval -3 announceReceiptTimeout 3 logSyncInterval -4 delayMechanism 1 logMinPdelayReqInterval -4 versionNumber 2
For GNSS-sourced grandmaster clocks, verify that the in-tree NIC ice driver is correct by running the following command, for example:
$ oc rsh -n openshift-ptp -c linuxptp-daemon-container linuxptp-daemon-74m2g ethtool -i ens7f0Example output
driver: ice version: 5.14.0-356.bz2232515.el9.x86_64 firmware-version: 4.20 0x8001778b 1.3346.0For GNSS-sourced grandmaster clocks, verify that the
linuxptp-daemoncontainer is receiving signal from the GNSS antenna. If the container is not receiving the GNSS signal, the/dev/gnss0file is not populated. To verify, run the following command:$ oc rsh -n openshift-ptp -c linuxptp-daemon-container linuxptp-daemon-jnz6r cat /dev/gnss0Example output
$GNRMC,125223.00,A,4233.24463,N,07126.64561,W,0.000,,300823,,,A,V*0A $GNVTG,,T,,M,0.000,N,0.000,K,A*3D $GNGGA,125223.00,4233.24463,N,07126.64561,W,1,12,99.99,98.6,M,-33.1,M,,*7E $GNGSA,A,3,25,17,19,11,12,06,05,04,09,20,,,99.99,99.99,99.99,1*37 $GPGSV,3,1,10,04,12,039,41,05,31,222,46,06,50,064,48,09,28,064,42,1*62
15.2.12. Getting the DPLL firmware version for the CGU in an Intel 800 series NIC
You can get the digital phase-locked loop (DPLL) firmware version for the Clock Generation Unit (CGU) in an Intel 800 series NIC by opening a debug shell to the cluster node and querying the NIC hardware.
Prerequisites
-
You have installed the OpenShift CLI (
oc). -
You have logged in as a user with
cluster-adminprivileges. - You have installed an Intel 800 series NIC in the cluster host.
- You have installed the PTP Operator on a bare-metal cluster with hosts that support PTP.
Procedure
Start a debug pod by running the following command:
$ oc debug node/<node_name>where:
- <node_name>
- Is the node where you have installed the Intel 800 series NIC.
Check the CGU firmware version in the NIC by using the
devlinktool and the bus and device name where the NIC is installed. For example, run the following command:sh-4.4# devlink dev info <bus_name>/<device_name> | grep cguwhere:
- <bus_name>
-
Is the bus where the NIC is installed. For example,
pci. - <device_name>
-
Is the NIC device name. For example,
0000:51:00.0.
Example output
cgu.id 36 fw.cgu 8032.16973825.6021where:
cgu.id 36- CGU hardware revision number.
fw.cgu 8032.16973825.6021-
DPLL firmware version running in the CGU, where the DPLL firmware version is
6201, and the DPLL model is8032. The string16973825is a shorthand representation of the binary version of the DPLL firmware version (1.3.0.1).
NoteThe firmware version has a leading nibble and 3 octets for each part of the version number. The number
16973825in binary is0001 0000 0011 0000 0000 0000 0001. Use the binary value to decode the firmware version. For example:Expand Table 15.10. DPLL firmware version Binary part Decimal value 00011
0000 00113
0000 00000
0000 00011
15.2.13. Collecting PTP Operator data
You can use the oc adm must-gather command to collect information about your cluster, including features and objects associated with PTP Operator.
Prerequisites
-
You have access to the cluster as a user with the
cluster-adminrole. -
You have installed the OpenShift CLI (
oc). - You have installed the PTP Operator.
Procedure
To collect PTP Operator data with
must-gather, you must specify the PTP Operatormust-gatherimage.$ oc adm must-gather --image=registry.redhat.io/openshift4/ptp-must-gather-rhel9:v4.16
15.3. Developing PTP events consumer applications with the REST API v2
When developing consumer applications that make use of Precision Time Protocol (PTP) events on a bare-metal cluster node, you deploy your consumer application in a separate application pod. The consumer application subscribes to PTP events by using the PTP events REST API v2.
The following information provides general guidance for developing consumer applications that use PTP events. A complete events consumer application example is outside the scope of this information.
15.3.1. About the PTP fast event notifications framework
Use the Precision Time Protocol (PTP) fast event REST API v2 to subscribe cluster applications to PTP events that the bare-metal cluster node generates.
The fast events notifications framework uses a REST API for communication. The PTP events REST API v1 and v2 are based on the O-RAN O-Cloud Notification API Specification for Event Consumers 4.0 that is available from O-RAN ALLIANCE Specifications.
Only the PTP events REST API v2 is O-RAN v4 compliant.
15.3.2. Retrieving PTP events with the PTP events REST API v2
Applications subscribe to PTP events by using an O-RAN v4 compatible REST API in the producer-side cloud event proxy sidecar. The cloud-event-proxy sidecar container can access the same resources as the primary application container without using any of the resources of the primary application and with no significant latency.
Figure 15.5. Overview of consuming PTP fast events from the PTP event producer REST API v2

-
 Event is generated on the cluster host
 -
The
linuxptp-daemonprocess in the PTP Operator-managed pod runs as a KubernetesDaemonSetand manages the variouslinuxptpprocesses (ptp4l,phc2sys, and optionally for grandmaster clocks,ts2phc). Thelinuxptp-daemonpasses the event to the UNIX domain socket. -
 Event is passed to the cloud-event-proxy sidecar
 -
The PTP plugin reads the event from the UNIX domain socket and passes it to the
cloud-event-proxysidecar in the PTP Operator-managed pod.cloud-event-proxydelivers the event from the Kubernetes infrastructure to Cloud-Native Network Functions (CNFs) with low latency. -
 Event is published
 -
The
cloud-event-proxysidecar in the PTP Operator-managed pod processes the event and publishes the event by using the PTP events REST API v2. -
 Consumer application requests a subscription and receives the subscribed event
 -
The consumer application sends an API request to the producer
cloud-event-proxysidecar to create a PTP events subscription. Once subscribed, the consumer application listens to the address specified in the resource qualifier and receives and processes the PTP events.
15.3.3. Configuring the PTP fast event notifications publisher
To start using PTP fast event notifications for a network interface in your cluster, you must enable the fast event publisher in the PTP Operator PtpOperatorConfig custom resource (CR) and configure ptpClockThreshold values in a PtpConfig CR that you create.
Prerequisites
-
You have installed the OpenShift Container Platform CLI (
oc). -
You have logged in as a user with
cluster-adminprivileges. - You have installed the PTP Operator.
Procedure
Modify the default PTP Operator config to enable PTP fast events.
Save the following YAML in the
ptp-operatorconfig.yamlfile:apiVersion: ptp.openshift.io/v1 kind: PtpOperatorConfig metadata: name: default namespace: openshift-ptp spec: daemonNodeSelector: node-role.kubernetes.io/worker: "" ptpEventConfig: apiVersion: "2.0"1 enableEventPublisher: true2 NoteIn OpenShift Container Platform 4.13 or later, you do not need to set the
spec.ptpEventConfig.transportHostfield in thePtpOperatorConfigresource when you use HTTP transport for PTP events.Update the
PtpOperatorConfigCR:$ oc apply -f ptp-operatorconfig.yaml
Create a
PtpConfigcustom resource (CR) for the PTP enabled interface, and set the required values forptpClockThresholdandptp4lOpts. The following YAML illustrates the required values that you must set in thePtpConfigCR:spec: profile: - name: "profile1" interface: "enp5s0f0" ptp4lOpts: "-2 -s --summary_interval -4"1 phc2sysOpts: "-a -r -m -n 24 -N 8 -R 16"2 ptp4lConf: ""3 ptpClockThreshold:4 holdOverTimeout: 5 maxOffsetThreshold: 100 minOffsetThreshold: -100- 1
- Append
--summary_interval -4to use PTP fast events. - 2
- Required
phc2sysOptsvalues.-mprints messages tostdout. Thelinuxptp-daemonDaemonSetparses the logs and generates Prometheus metrics. - 3
- Specify a string that contains the configuration to replace the default
/etc/ptp4l.conffile. To use the default configuration, leave the field empty. - 4
- Optional. If the
ptpClockThresholdstanza is not present, default values are used for theptpClockThresholdfields. The stanza shows defaultptpClockThresholdvalues. TheptpClockThresholdvalues configure how long after the PTP master clock is disconnected before PTP events are triggered.holdOverTimeoutis the time value in seconds before the PTP clock event state changes toFREERUNwhen the PTP master clock is disconnected. ThemaxOffsetThresholdandminOffsetThresholdsettings configure offset values in nanoseconds that compare against the values forCLOCK_REALTIME(phc2sys) or master offset (ptp4l). When theptp4lorphc2sysoffset value is outside this range, the PTP clock state is set toFREERUN. When the offset value is within this range, the PTP clock state is set toLOCKED.
15.3.4. PTP events REST API v2 consumer application reference
PTP event consumer applications require the following features:
-
A web service running with a
POSThandler to receive the cloud native PTP events JSON payload -
A
createSubscriptionfunction to subscribe to the PTP events producer -
A
getCurrentStatefunction to poll the current state of the PTP events producer
The following example Go snippets illustrate these requirements:
Example PTP events consumer server function in Go
func server() {
http.HandleFunc("/event", getEvent)
http.ListenAndServe(":9043", nil)
}
func getEvent(w http.ResponseWriter, req *http.Request) {
defer req.Body.Close()
bodyBytes, err := io.ReadAll(req.Body)
if err != nil {
log.Errorf("error reading event %v", err)
}
e := string(bodyBytes)
if e != "" {
processEvent(bodyBytes)
log.Infof("received event %s", string(bodyBytes))
}
w.WriteHeader(http.StatusNoContent)
}Example PTP events createSubscription function in Go
import (
"github.com/redhat-cne/sdk-go/pkg/pubsub"
"github.com/redhat-cne/sdk-go/pkg/types"
v1pubsub "github.com/redhat-cne/sdk-go/v1/pubsub"
)
// Subscribe to PTP events using v2 REST API
s1,_:=createsubscription("/cluster/node/<node_name>/sync/sync-status/sync-state")
s2,_:=createsubscription("/cluster/node/<node_name>/sync/ptp-status/lock-state")
s3,_:=createsubscription("/cluster/node/<node_name>/sync/gnss-status/gnss-sync-status")
s4,_:=createsubscription("/cluster/node/<node_name>/sync/sync-status/os-clock-sync-state")
s5,_:=createsubscription("/cluster/node/<node_name>/sync/ptp-status/clock-class")
// Create PTP event subscriptions POST
func createSubscription(resourceAddress string) (sub pubsub.PubSub, err error) {
var status int
apiPath := "/api/ocloudNotifications/v2/"
localAPIAddr := "consumer-events-subscription-service.cloud-events.svc.cluster.local:9043" // vDU service API address
apiAddr := "ptp-event-publisher-service-<node_name>.openshift-ptp.svc.cluster.local:9043"
apiVersion := "2.0"
subURL := &types.URI{URL: url.URL{Scheme: "http",
Host: apiAddr
Path: fmt.Sprintf("%s%s", apiPath, "subscriptions")}}
endpointURL := &types.URI{URL: url.URL{Scheme: "http",
Host: localAPIAddr,
Path: "event"}}
sub = v1pubsub.NewPubSub(endpointURL, resourceAddress, apiVersion)
var subB []byte
if subB, err = json.Marshal(&sub); err == nil {
rc := restclient.New()
if status, subB = rc.PostWithReturn(subURL, subB); status != http.StatusCreated {
err = fmt.Errorf("error in subscription creation api at %s, returned status %d", subURL, status)
} else {
err = json.Unmarshal(subB, &sub)
}
} else {
err = fmt.Errorf("failed to marshal subscription for %s", resourceAddress)
}
return
}- 1
- Replace
<node_name>with the FQDN of the node that is generating the PTP events. For example,compute-1.example.com.
Example PTP events consumer getCurrentState function in Go
//Get PTP event state for the resource
func getCurrentState(resource string) {
//Create publisher
url := &types.URI{URL: url.URL{Scheme: "http",
Host: "ptp-event-publisher-service-<node_name>.openshift-ptp.svc.cluster.local:9043",
Path: fmt.SPrintf("/api/ocloudNotifications/v2/%s/CurrentState",resource}}
rc := restclient.New()
status, event := rc.Get(url)
if status != http.StatusOK {
log.Errorf("CurrentState:error %d from url %s, %s", status, url.String(), event)
} else {
log.Debugf("Got CurrentState: %s ", event)
}
}- 1
- Replace
<node_name>with the FQDN of the node that is generating the PTP events. For example,compute-1.example.com.
15.3.5. Reference event consumer deployment and service CRs using PTP events REST API v2
Use the following example PTP event consumer custom resources (CRs) as a reference when deploying your PTP events consumer application for use with the PTP events REST API v2.
Reference cloud event consumer namespace
apiVersion: v1
kind: Namespace
metadata:
name: cloud-events
labels:
security.openshift.io/scc.podSecurityLabelSync: "false"
pod-security.kubernetes.io/audit: "privileged"
pod-security.kubernetes.io/enforce: "privileged"
pod-security.kubernetes.io/warn: "privileged"
name: cloud-events
openshift.io/cluster-monitoring: "true"
annotations:
workload.openshift.io/allowed: managementReference cloud event consumer deployment
apiVersion: apps/v1
kind: Deployment
metadata:
name: cloud-consumer-deployment
namespace: cloud-events
labels:
app: consumer
spec:
replicas: 1
selector:
matchLabels:
app: consumer
template:
metadata:
annotations:
target.workload.openshift.io/management: '{"effect": "PreferredDuringScheduling"}'
labels:
app: consumer
spec:
nodeSelector:
node-role.kubernetes.io/worker: ""
serviceAccountName: consumer-sa
containers:
- name: cloud-event-consumer
image: cloud-event-consumer
imagePullPolicy: Always
args:
- "--local-api-addr=consumer-events-subscription-service.cloud-events.svc.cluster.local:9043"
- "--api-path=/api/ocloudNotifications/v2/"
- "--api-addr=127.0.0.1:8089"
- "--api-version=2.0"
- "--http-event-publishers=ptp-event-publisher-service-NODE_NAME.openshift-ptp.svc.cluster.local:9043"
env:
- name: NODE_NAME
valueFrom:
fieldRef:
fieldPath: spec.nodeName
- name: CONSUMER_TYPE
value: "PTP"
- name: ENABLE_STATUS_CHECK
value: "true"
volumes:
- name: pubsubstore
emptyDir: {}Reference cloud event consumer service account
apiVersion: v1
kind: ServiceAccount
metadata:
name: consumer-sa
namespace: cloud-eventsReference cloud event consumer service
apiVersion: v1
kind: Service
metadata:
annotations:
prometheus.io/scrape: "true"
name: consumer-events-subscription-service
namespace: cloud-events
labels:
app: consumer-service
spec:
ports:
- name: sub-port
port: 9043
selector:
app: consumer
sessionAffinity: None
type: ClusterIP15.3.6. Subscribing to PTP events with the REST API v2
Deploy your cloud-event-consumer application container and subscribe the cloud-event-consumer application to PTP events posted by the cloud-event-proxy container in the pod managed by the PTP Operator.
Subscribe consumer applications to PTP events by sending a POST request to http://ptp-event-publisher-service-NODE_NAME.openshift-ptp.svc.cluster.local:9043/api/ocloudNotifications/v2/subscriptions passing the appropriate subscription request payload.
9043 is the default port for the cloud-event-proxy container deployed in the PTP event producer pod. You can configure a different port for your application as required.
15.3.7. Verifying that the PTP events REST API v2 consumer application is receiving events
Verify that the cloud-event-consumer container in the application pod is receiving Precision Time Protocol (PTP) events.
Prerequisites
-
You have installed the OpenShift CLI (
oc). -
You have logged in as a user with
cluster-adminprivileges. - You have installed and configured the PTP Operator.
- You have deployed a cloud events application pod and PTP events consumer application.
Procedure
Check the logs for the deployed events consumer application. For example, run the following command:
$ oc -n cloud-events logs -f deployment/cloud-consumer-deploymentExample output
time = "2024-09-02T13:49:01Z" level = info msg = "transport host path is set to ptp-event-publisher-service-compute-1.openshift-ptp.svc.cluster.local:9043" time = "2024-09-02T13:49:01Z" level = info msg = "apiVersion=2.0, updated apiAddr=ptp-event-publisher-service-compute-1.openshift-ptp.svc.cluster.local:9043, apiPath=/api/ocloudNotifications/v2/" time = "2024-09-02T13:49:01Z" level = info msg = "Starting local API listening to :9043" time = "2024-09-02T13:49:06Z" level = info msg = "transport host path is set to ptp-event-publisher-service-compute-1.openshift-ptp.svc.cluster.local:9043" time = "2024-09-02T13:49:06Z" level = info msg = "checking for rest service health" time = "2024-09-02T13:49:06Z" level = info msg = "health check http://ptp-event-publisher-service-compute-1.openshift-ptp.svc.cluster.local:9043/api/ocloudNotifications/v2/health" time = "2024-09-02T13:49:07Z" level = info msg = "rest service returned healthy status" time = "2024-09-02T13:49:07Z" level = info msg = "healthy publisher; subscribing to events" time = "2024-09-02T13:49:07Z" level = info msg = "received event {\"specversion\":\"1.0\",\"id\":\"ab423275-f65d-4760-97af-5b0b846605e4\",\"source\":\"/sync/ptp-status/clock-class\",\"type\":\"event.sync.ptp-status.ptp-clock-class-change\",\"time\":\"2024-09-02T13:49:07.226494483Z\",\"data\":{\"version\":\"1.0\",\"values\":[{\"ResourceAddress\":\"/cluster/node/compute-1.example.com/ptp-not-set\",\"data_type\":\"metric\",\"value_type\":\"decimal64.3\",\"value\":\"0\"}]}}"Optional. Test the REST API by using
ocand port-forwarding port9043from thelinuxptp-daemondeployment. For example, run the following command:$ oc port-forward -n openshift-ptp ds/linuxptp-daemon 9043:9043Example output
Forwarding from 127.0.0.1:9043 -> 9043 Forwarding from [::1]:9043 -> 9043 Handling connection for 9043Open a new shell prompt and test the REST API v2 endpoints:
$ curl -X GET http://localhost:9043/api/ocloudNotifications/v2/healthExample output
OK
15.3.8. Monitoring PTP fast event metrics
You can monitor PTP fast events metrics from cluster nodes where the linuxptp-daemon is running. You can also monitor PTP fast event metrics in the OpenShift Container Platform web console by using the preconfigured and self-updating Prometheus monitoring stack.
Prerequisites
-
Install the OpenShift Container Platform CLI
oc. -
Log in as a user with
cluster-adminprivileges. - Install and configure the PTP Operator on a node with PTP-capable hardware.
Procedure
Start a debug pod for the node by running the following command:
$ oc debug node/<node_name>Check for PTP metrics exposed by the
linuxptp-daemoncontainer. For example, run the following command:sh-4.4# curl http://localhost:9091/metricsExample output
# HELP cne_api_events_published Metric to get number of events published by the rest api # TYPE cne_api_events_published gauge cne_api_events_published{address="/cluster/node/compute-1.example.com/sync/gnss-status/gnss-sync-status",status="success"} 1 cne_api_events_published{address="/cluster/node/compute-1.example.com/sync/ptp-status/lock-state",status="success"} 94 cne_api_events_published{address="/cluster/node/compute-1.example.com/sync/ptp-status/class-change",status="success"} 18 cne_api_events_published{address="/cluster/node/compute-1.example.com/sync/sync-status/os-clock-sync-state",status="success"} 27Optional. You can also find PTP events in the logs for the
cloud-event-proxycontainer. For example, run the following command:$ oc logs -f linuxptp-daemon-cvgr6 -n openshift-ptp -c cloud-event-proxy-
To view the PTP event in the OpenShift Container Platform web console, copy the name of the PTP metric you want to query, for example,
openshift_ptp_offset_ns. - In the OpenShift Container Platform web console, click Observe → Metrics.
- Paste the PTP metric name into the Expression field, and click Run queries.
15.3.9. PTP fast event metrics reference
The following table describes the PTP fast events metrics that are available from cluster nodes where the linuxptp-daemon service is running.
| Metric | Description | Example |
|---|---|---|
|
|
Returns the PTP clock class for the interface. Possible values for PTP clock class are 6 ( |
|
|
|
Returns the current PTP clock state for the interface. Possible values for PTP clock state are |
|
|
| Returns the delay in nanoseconds between the primary clock sending the timing packet and the secondary clock receiving the timing packet. |
|
|
|
Returns the current status of the highly available system clock when there are multiple time sources on different NICs. Possible values are 0 ( |
|
|
|
Returns the frequency adjustment in nanoseconds between 2 PTP clocks. For example, between the upstream clock and the NIC, between the system clock and the NIC, or between the PTP hardware clock ( |
|
|
|
Returns the configured PTP clock role for the interface. Possible values are 0 ( |
|
|
|
Returns the maximum offset in nanoseconds between 2 clocks or interfaces. For example, between the upstream GNSS clock and the NIC ( |
|
|
| Returns the offset in nanoseconds between the DPLL clock or the GNSS clock source and the NIC hardware clock. |
|
|
|
Returns a count of the number of times the |
|
|
| Returns a status code that shows whether the PTP processes are running or not. |
|
|
|
Returns values for
|
|
15.3.9.1. PTP fast event metrics only when T-GM is enabled
The following table describes the PTP fast event metrics that are available only when PTP grandmaster clock (T-GM) is enabled.
| Metric | Description | Example |
|---|---|---|
|
|
Returns the current status of the digital phase-locked loop (DPLL) frequency for the NIC. Possible values are -1 ( |
|
|
|
Returns the current status of the NMEA connection. NMEA is the protocol that is used for 1PPS NIC connections. Possible values are 0 ( |
|
|
|
Returns the status of the DPLL phase for the NIC. Possible values are -1 ( |
|
|
|
Returns the current status of the NIC 1PPS connection. You use the 1PPS connection to synchronize timing between connected NICs. Possible values are 0 ( |
|
|
|
Returns the current status of the global navigation satellite system (GNSS) connection. GNSS provides satellite-based positioning, navigation, and timing services globally. Possible values are 0 ( |
|
15.4. PTP events REST API v2 reference
Use the following REST API v2 endpoints to subscribe the cloud-event-consumer application to Precision Time Protocol (PTP) events posted at http://localhost:9043/api/ocloudNotifications/v2 in the PTP events producer pod.
api/ocloudNotifications/v2/subscriptions-
POST: Creates a new subscription -
GET: Retrieves a list of subscriptions -
DELETE: Deletes all subscriptions
-
api/ocloudNotifications/v2/subscriptions/{subscription_id}-
GET: Returns details for the specified subscription ID -
DELETE: Deletes the subscription associated with the specified subscription ID
-
api/ocloudNotifications/v2/health-
GET: Returns the health status ofocloudNotificationsAPI
-
api/ocloudNotifications/v2/publishers-
GET: Returns a list of PTP event publishers for the cluster node
-
api/ocloudnotifications/v2/{resource_address}/CurrentState-
GET: Returns the current state of the event type specified by the{resouce_address}.
-
15.4.1. PTP events REST API v2 endpoints
15.4.1.1. api/ocloudNotifications/v2/subscriptions
HTTP method
GET api/ocloudNotifications/v2/subscriptions
Description
Returns a list of subscriptions. If subscriptions exist, a 200 OK status code is returned along with the list of subscriptions.
Example API response
[
{
"ResourceAddress": "/cluster/node/compute-1.example.com/sync/sync-status/os-clock-sync-state",
"EndpointUri": "http://consumer-events-subscription-service.cloud-events.svc.cluster.local:9043/event",
"SubscriptionId": "ccedbf08-3f96-4839-a0b6-2eb0401855ed",
"UriLocation": "http://ptp-event-publisher-service-compute-1.openshift-ptp.svc.cluster.local:9043/api/ocloudNotifications/v2/subscriptions/ccedbf08-3f96-4839-a0b6-2eb0401855ed"
},
{
"ResourceAddress": "/cluster/node/compute-1.example.com/sync/ptp-status/clock-class",
"EndpointUri": "http://consumer-events-subscription-service.cloud-events.svc.cluster.local:9043/event",
"SubscriptionId": "a939a656-1b7d-4071-8cf1-f99af6e931f2",
"UriLocation": "http://ptp-event-publisher-service-compute-1.openshift-ptp.svc.cluster.local:9043/api/ocloudNotifications/v2/subscriptions/a939a656-1b7d-4071-8cf1-f99af6e931f2"
},
{
"ResourceAddress": "/cluster/node/compute-1.example.com/sync/ptp-status/lock-state",
"EndpointUri": "http://consumer-events-subscription-service.cloud-events.svc.cluster.local:9043/event",
"SubscriptionId": "ba4564a3-4d9e-46c5-b118-591d3105473c",
"UriLocation": "http://ptp-event-publisher-service-compute-1.openshift-ptp.svc.cluster.local:9043/api/ocloudNotifications/v2/subscriptions/ba4564a3-4d9e-46c5-b118-591d3105473c"
},
{
"ResourceAddress": "/cluster/node/compute-1.example.com/sync/gnss-status/gnss-sync-status",
"EndpointUri": "http://consumer-events-subscription-service.cloud-events.svc.cluster.local:9043/event",
"SubscriptionId": "ea0d772e-f00a-4889-98be-51635559b4fb",
"UriLocation": "http://ptp-event-publisher-service-compute-1.openshift-ptp.svc.cluster.local:9043/api/ocloudNotifications/v2/subscriptions/ea0d772e-f00a-4889-98be-51635559b4fb"
},
{
"ResourceAddress": "/cluster/node/compute-1.example.com/sync/sync-status/sync-state",
"EndpointUri": "http://consumer-events-subscription-service.cloud-events.svc.cluster.local:9043/event",
"SubscriptionId": "762999bf-b4a0-4bad-abe8-66e646b65754",
"UriLocation": "http://ptp-event-publisher-service-compute-1.openshift-ptp.svc.cluster.local:9043/api/ocloudNotifications/v2/subscriptions/762999bf-b4a0-4bad-abe8-66e646b65754"
}
]HTTP method
POST api/ocloudNotifications/v2/subscriptions
Description
Creates a new subscription for the required event by passing the appropriate payload.
You can subscribe to the following PTP events:
-
sync-stateevents -
lock-stateevents -
gnss-sync-status eventsevents -
os-clock-sync-stateevents -
clock-classevents
| Parameter | Type |
|---|---|
| subscription | data |
Example sync-state subscription payload
{
"EndpointUri": "http://consumer-events-subscription-service.cloud-events.svc.cluster.local:9043/event",
"ResourceAddress": "/cluster/node/{node_name}/sync/sync-status/sync-state"
}Example PTP lock-state events subscription payload
{
"EndpointUri": "http://consumer-events-subscription-service.cloud-events.svc.cluster.local:9043/event",
"ResourceAddress": "/cluster/node/{node_name}/sync/ptp-status/lock-state"
}Example PTP gnss-sync-status events subscription payload
{
"EndpointUri": "http://consumer-events-subscription-service.cloud-events.svc.cluster.local:9043/event",
"ResourceAddress": "/cluster/node/{node_name}/sync/gnss-status/gnss-sync-status"
}Example PTP os-clock-sync-state events subscription payload
{
"EndpointUri": "http://consumer-events-subscription-service.cloud-events.svc.cluster.local:9043/event",
"ResourceAddress": "/cluster/node/{node_name}/sync/sync-status/os-clock-sync-state"
}Example PTP clock-class events subscription payload
{
"EndpointUri": "http://consumer-events-subscription-service.cloud-events.svc.cluster.local:9043/event",
"ResourceAddress": "/cluster/node/{node_name}/sync/ptp-status/clock-class"
}Example API response
{
"ResourceAddress": "/cluster/node/compute-1.example.com/sync/ptp-status/lock-state",
"EndpointUri": "http://consumer-events-subscription-service.cloud-events.svc.cluster.local:9043/event",
"SubscriptionId": "620283f3-26cd-4a6d-b80a-bdc4b614a96a",
"UriLocation": "http://ptp-event-publisher-service-compute-1.openshift-ptp.svc.cluster.local:9043/api/ocloudNotifications/v2/subscriptions/620283f3-26cd-4a6d-b80a-bdc4b614a96a"
}The following subscription status events are possible:
| Status code | Description |
|---|---|
|
| Indicates that the subscription is created |
|
| Indicates that the server could not process the request because it was malformed or invalid |
|
| Indicates that the subscription resource is not available |
|
| Indicates that the subscription already exists |
HTTP method
DELETE api/ocloudNotifications/v2/subscriptions
Description
Deletes all subscriptions.
Example API response
{
"status": "deleted all subscriptions"
}15.4.1.2. api/ocloudNotifications/v2/subscriptions/{subscription_id}
HTTP method
GET api/ocloudNotifications/v2/subscriptions/{subscription_id}
Description
Returns details for the subscription with ID subscription_id.
| Parameter | Type |
|---|---|
|
| string |
Example API response
{
"ResourceAddress": "/cluster/node/compute-1.example.com/sync/ptp-status/lock-state",
"EndpointUri": "http://consumer-events-subscription-service.cloud-events.svc.cluster.local:9043/event",
"SubscriptionId": "620283f3-26cd-4a6d-b80a-bdc4b614a96a",
"UriLocation": "http://ptp-event-publisher-service-compute-1.openshift-ptp.svc.cluster.local:9043/api/ocloudNotifications/v2/subscriptions/620283f3-26cd-4a6d-b80a-bdc4b614a96a"
}HTTP method
DELETE api/ocloudNotifications/v2/subscriptions/{subscription_id}
Description
Deletes the subscription with ID subscription_id.
| Parameter | Type |
|---|---|
|
| string |
| HTTP response | Description |
|---|---|
| 204 No Content | Success |
15.4.1.3. api/ocloudNotifications/v2/health
HTTP method
GET api/ocloudNotifications/v2/health/
Description
Returns the health status for the ocloudNotifications REST API.
| HTTP response | Description |
|---|---|
| 200 OK | Success |
15.4.1.4. api/ocloudNotifications/v2/publishers
HTTP method
GET api/ocloudNotifications/v2/publishers
Description
Returns a list of publisher details for the cluster node. The system generates notifications when the relevant equipment state changes.
You can use equipment synchronization status subscriptions together to deliver a detailed view of the overall synchronization health of the system.
Example API response
[
{
"ResourceAddress": "/cluster/node/compute-1.example.com/sync/sync-status/sync-state",
"EndpointUri": "http://localhost:9043/api/ocloudNotifications/v2/dummy",
"SubscriptionId": "4ea72bfa-185c-4703-9694-cdd0434cd570",
"UriLocation": "http://localhost:9043/api/ocloudNotifications/v2/publishers/4ea72bfa-185c-4703-9694-cdd0434cd570"
},
{
"ResourceAddress": "/cluster/node/compute-1.example.com/sync/sync-status/os-clock-sync-state",
"EndpointUri": "http://localhost:9043/api/ocloudNotifications/v2/dummy",
"SubscriptionId": "71fbb38e-a65d-41fc-823b-d76407901087",
"UriLocation": "http://localhost:9043/api/ocloudNotifications/v2/publishers/71fbb38e-a65d-41fc-823b-d76407901087"
},
{
"ResourceAddress": "/cluster/node/compute-1.example.com/sync/ptp-status/clock-class",
"EndpointUri": "http://localhost:9043/api/ocloudNotifications/v2/dummy",
"SubscriptionId": "7bc27cad-03f4-44a9-8060-a029566e7926",
"UriLocation": "http://localhost:9043/api/ocloudNotifications/v2/publishers/7bc27cad-03f4-44a9-8060-a029566e7926"
},
{
"ResourceAddress": "/cluster/node/compute-1.example.com/sync/ptp-status/lock-state",
"EndpointUri": "http://localhost:9043/api/ocloudNotifications/v2/dummy",
"SubscriptionId": "6e7b6736-f359-46b9-991c-fbaed25eb554",
"UriLocation": "http://localhost:9043/api/ocloudNotifications/v2/publishers/6e7b6736-f359-46b9-991c-fbaed25eb554"
},
{
"ResourceAddress": "/cluster/node/compute-1.example.com/sync/gnss-status/gnss-sync-status",
"EndpointUri": "http://localhost:9043/api/ocloudNotifications/v2/dummy",
"SubscriptionId": "31bb0a45-7892-45d4-91dd-13035b13ed18",
"UriLocation": "http://localhost:9043/api/ocloudNotifications/v2/publishers/31bb0a45-7892-45d4-91dd-13035b13ed18"
}
]| HTTP response | Description |
|---|---|
| 200 OK | Success |
15.4.1.5. api/ocloudNotifications/v2/{resource_address}/CurrentState
HTTP method
GET api/ocloudNotifications/v2/cluster/node/{node_name}/sync/ptp-status/lock-state/CurrentState
GET api/ocloudNotifications/v2/cluster/node/{node_name}/sync/sync-status/os-clock-sync-state/CurrentState
GET api/ocloudNotifications/v2/cluster/node/{node_name}/sync/ptp-status/clock-class/CurrentState
GET api/ocloudNotifications/v2/cluster/node/{node_name}/sync/sync-status/sync-state/CurrentState
GET api/ocloudNotifications/v2/cluster/node/{node_name}/sync/gnss-status/gnss-sync-state/CurrentState
Description
Returns the current state of the os-clock-sync-state, clock-class, lock-state, gnss-sync-status, or sync-state events for the cluster node.
-
os-clock-sync-statenotifications describe the host operating system clock synchronization state. Can be inLOCKEDorFREERUNstate. -
clock-classnotifications describe the current state of the PTP clock class. -
lock-statenotifications describe the current status of the PTP equipment lock state. Can be inLOCKED,HOLDOVERorFREERUNstate. -
sync-statenotifications describe the current status of the least synchronized of the PTP clocklock-stateandos-clock-sync-statestates. -
gnss-sync-statusnotifications describe the GNSS clock synchronization state.
| Parameter | Type |
|---|---|
|
| string |
Example lock-state API response
{
"id": "c1ac3aa5-1195-4786-84f8-da0ea4462921",
"type": "event.sync.ptp-status.ptp-state-change",
"source": "/cluster/node/compute-1.example.com/sync/ptp-status/lock-state",
"dataContentType": "application/json",
"time": "2023-01-10T02:41:57.094981478Z",
"data": {
"version": "1.0",
"values": [
{
"ResourceAddress": "/cluster/node/compute-1.example.com/ens5fx/master",
"data_type": "notification",
"value_type": "enumeration",
"value": "LOCKED"
},
{
"ResourceAddress": "/cluster/node/compute-1.example.com/ens5fx/master",
"data_type": "metric",
"value_type": "decimal64.3",
"value": "29"
}
]
}
}Example os-clock-sync-state API response
{
"specversion": "0.3",
"id": "4f51fe99-feaa-4e66-9112-66c5c9b9afcb",
"source": "/cluster/node/compute-1.example.com/sync/sync-status/os-clock-sync-state",
"type": "event.sync.sync-status.os-clock-sync-state-change",
"subject": "/cluster/node/compute-1.example.com/sync/sync-status/os-clock-sync-state",
"datacontenttype": "application/json",
"time": "2022-11-29T17:44:22.202Z",
"data": {
"version": "1.0",
"values": [
{
"ResourceAddress": "/cluster/node/compute-1.example.com/CLOCK_REALTIME",
"data_type": "notification",
"value_type": "enumeration",
"value": "LOCKED"
},
{
"ResourceAddress": "/cluster/node/compute-1.example.com/CLOCK_REALTIME",
"data_type": "metric",
"value_type": "decimal64.3",
"value": "27"
}
]
}
}Example clock-class API response
{
"id": "064c9e67-5ad4-4afb-98ff-189c6aa9c205",
"type": "event.sync.ptp-status.ptp-clock-class-change",
"source": "/cluster/node/compute-1.example.com/sync/ptp-status/clock-class",
"dataContentType": "application/json",
"time": "2023-01-10T02:41:56.785673989Z",
"data": {
"version": "1.0",
"values": [
{
"ResourceAddress": "/cluster/node/compute-1.example.com/ens5fx/master",
"data_type": "metric",
"value_type": "decimal64.3",
"value": "165"
}
]
}
}Example sync-state API response
{
"specversion": "0.3",
"id": "8c9d6ecb-ae9f-4106-82c4-0a778a79838d",
"source": "/sync/sync-status/sync-state",
"type": "event.sync.sync-status.synchronization-state-change",
"subject": "/cluster/node/compute-1.example.com/sync/sync-status/sync-state",
"datacontenttype": "application/json",
"time": "2024-08-28T14:50:57.327585316Z",
"data":
{
"version": "1.0",
"values": [
{
"ResourceAddress": "/cluster/node/compute-1.example.com/sync/sync-status/sync-state",
"data_type": "notification",
"value_type": "enumeration",
"value": "LOCKED"
}]
}
}Example gnss-sync-state API response
{
"id": "435e1f2a-6854-4555-8520-767325c087d7",
"type": "event.sync.gnss-status.gnss-state-change",
"source": "/cluster/node/compute-1.example.com/sync/gnss-status/gnss-sync-status",
"dataContentType": "application/json",
"time": "2023-09-27T19:35:33.42347206Z",
"data": {
"version": "1.0",
"values": [
{
"ResourceAddress": "/cluster/node/compute-1.example.com/ens2fx/master",
"data_type": "notification",
"value_type": "enumeration",
"value": "SYNCHRONIZED"
},
{
"ResourceAddress": "/cluster/node/compute-1.example.com/ens2fx/master",
"data_type": "metric",
"value_type": "decimal64.3",
"value": "5"
}
]
}
}15.5. Developing PTP events consumer applications with the REST API v1
When developing consumer applications that make use of Precision Time Protocol (PTP) events on a bare-metal cluster node, you deploy your consumer application in a separate application pod. The consumer application subscribes to PTP events by using the PTP events REST API v1.
The following information provides general guidance for developing consumer applications that use PTP events. A complete events consumer application example is outside the scope of this information.
The PTP events REST API v1 will be deprecated in a future release. When developing applications that use PTP events, use the PTP events REST API v2.
15.5.1. About the PTP fast event notifications framework
Use the Precision Time Protocol (PTP) fast event REST API v2 to subscribe cluster applications to PTP events that the bare-metal cluster node generates.
The fast events notifications framework uses a REST API for communication. The PTP events REST API v1 and v2 are based on the O-RAN O-Cloud Notification API Specification for Event Consumers 4.0 that is available from O-RAN ALLIANCE Specifications.
Only the PTP events REST API v2 is O-RAN v4 compliant.
15.5.2. Retrieving PTP events with the PTP events REST API v1
Applications run the cloud-event-proxy container in a sidecar pattern to subscribe to PTP events. The cloud-event-proxy sidecar container can access the same resources as the primary application container without using any of the resources of the primary application and with no significant latency.
Figure 15.6. Overview of PTP fast events with consumer sidecar and HTTP message transport
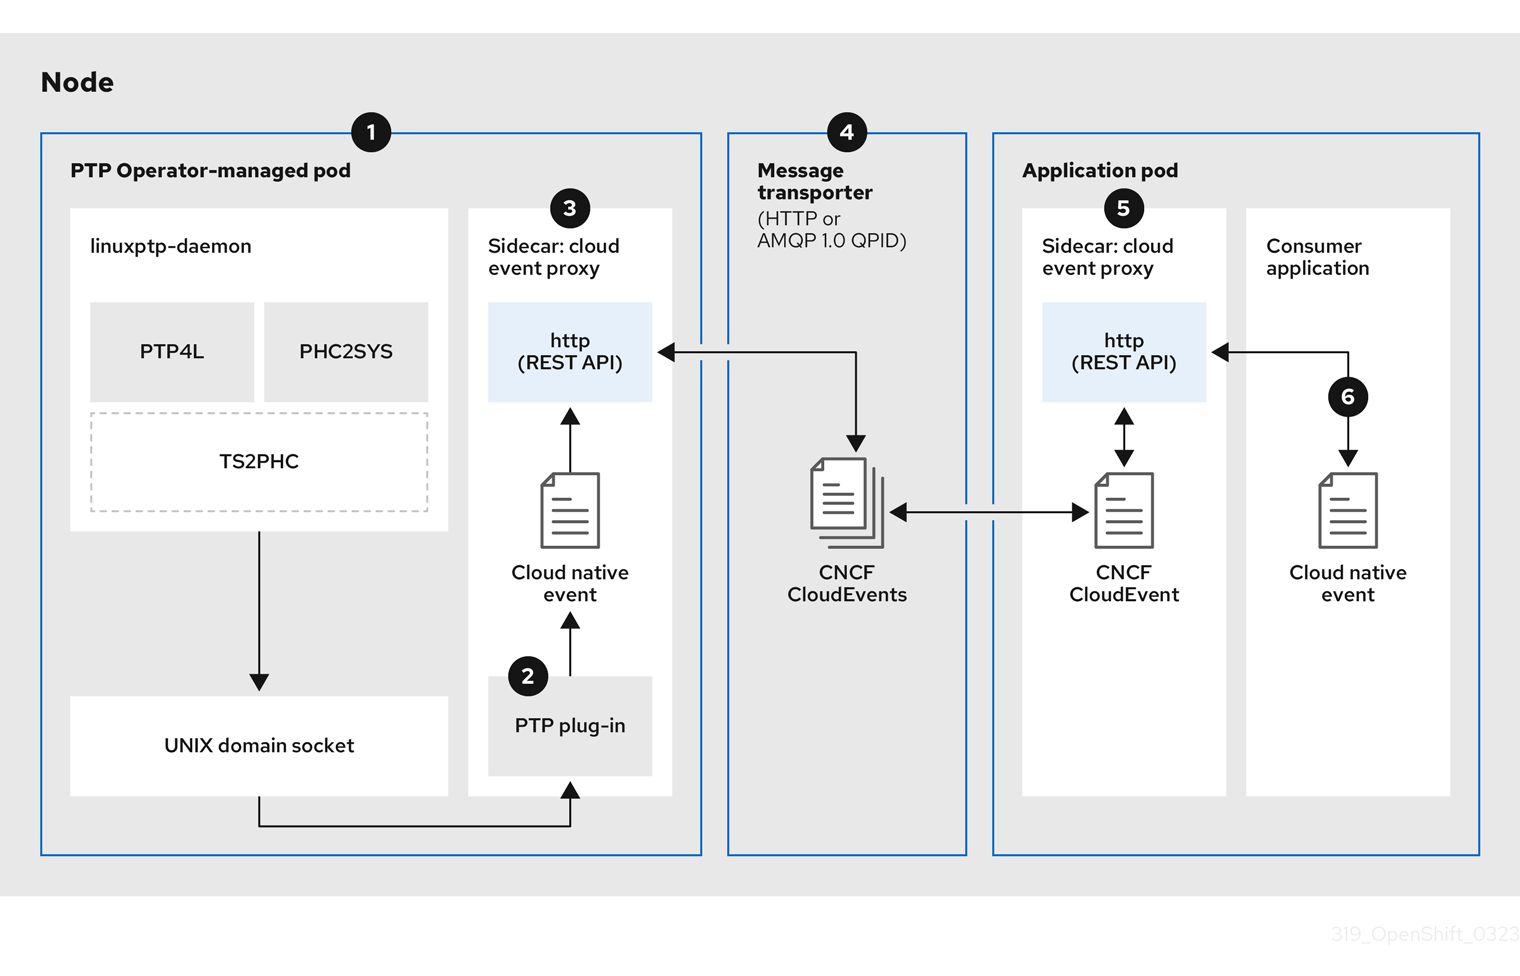
-
Event is generated on the cluster host
-
linuxptp-daemonin the PTP Operator-managed pod runs as a KubernetesDaemonSetand manages the variouslinuxptpprocesses (ptp4l,phc2sys, and optionally for grandmaster clocks,ts2phc). Thelinuxptp-daemonpasses the event to the UNIX domain socket. -
Event is passed to the cloud-event-proxy sidecar
-
The PTP plugin reads the event from the UNIX domain socket and passes it to the
cloud-event-proxysidecar in the PTP Operator-managed pod.cloud-event-proxydelivers the event from the Kubernetes infrastructure to Cloud-Native Network Functions (CNFs) with low latency. -
Event is persisted
-
The
cloud-event-proxysidecar in the PTP Operator-managed pod processes the event and publishes the cloud-native event by using a REST API. -
Message is transported
-
The message transporter transports the event to the
cloud-event-proxysidecar in the application pod over HTTP. -
 Event is available from the REST API
 -
The
cloud-event-proxysidecar in the Application pod processes the event and makes it available by using the REST API. -
 Consumer application requests a subscription and receives the subscribed event
 -
The consumer application sends an API request to the
cloud-event-proxysidecar in the application pod to create a PTP events subscription. Thecloud-event-proxysidecar creates an HTTP messaging listener protocol for the resource specified in the subscription.
The cloud-event-proxy sidecar in the application pod receives the event from the PTP Operator-managed pod, unwraps the cloud events object to retrieve the data, and posts the event to the consumer application. The consumer application listens to the address specified in the resource qualifier and receives and processes the PTP event.
15.5.3. Configuring the PTP fast event notifications publisher
To start using PTP fast event notifications for a network interface in your cluster, you must enable the fast event publisher in the PTP Operator PtpOperatorConfig custom resource (CR) and configure ptpClockThreshold values in a PtpConfig CR that you create.
Prerequisites
-
You have installed the OpenShift Container Platform CLI (
oc). -
You have logged in as a user with
cluster-adminprivileges. - You have installed the PTP Operator.
Procedure
Modify the default PTP Operator config to enable PTP fast events.
Save the following YAML in the
ptp-operatorconfig.yamlfile:apiVersion: ptp.openshift.io/v1 kind: PtpOperatorConfig metadata: name: default namespace: openshift-ptp spec: daemonNodeSelector: node-role.kubernetes.io/worker: "" ptpEventConfig: enableEventPublisher: true1 - 1
- Enable PTP fast event notifications by setting
enableEventPublishertotrue.
NoteIn OpenShift Container Platform 4.13 or later, you do not need to set the
spec.ptpEventConfig.transportHostfield in thePtpOperatorConfigresource when you use HTTP transport for PTP events.Update the
PtpOperatorConfigCR:$ oc apply -f ptp-operatorconfig.yaml
Create a
PtpConfigcustom resource (CR) for the PTP enabled interface, and set the required values forptpClockThresholdandptp4lOpts. The following YAML illustrates the required values that you must set in thePtpConfigCR:spec: profile: - name: "profile1" interface: "enp5s0f0" ptp4lOpts: "-2 -s --summary_interval -4"1 phc2sysOpts: "-a -r -m -n 24 -N 8 -R 16"2 ptp4lConf: ""3 ptpClockThreshold:4 holdOverTimeout: 5 maxOffsetThreshold: 100 minOffsetThreshold: -100- 1
- Append
--summary_interval -4to use PTP fast events. - 2
- Required
phc2sysOptsvalues.-mprints messages tostdout. Thelinuxptp-daemonDaemonSetparses the logs and generates Prometheus metrics. - 3
- Specify a string that contains the configuration to replace the default
/etc/ptp4l.conffile. To use the default configuration, leave the field empty. - 4
- Optional. If the
ptpClockThresholdstanza is not present, default values are used for theptpClockThresholdfields. The stanza shows defaultptpClockThresholdvalues. TheptpClockThresholdvalues configure how long after the PTP master clock is disconnected before PTP events are triggered.holdOverTimeoutis the time value in seconds before the PTP clock event state changes toFREERUNwhen the PTP master clock is disconnected. ThemaxOffsetThresholdandminOffsetThresholdsettings configure offset values in nanoseconds that compare against the values forCLOCK_REALTIME(phc2sys) or master offset (ptp4l). When theptp4lorphc2sysoffset value is outside this range, the PTP clock state is set toFREERUN. When the offset value is within this range, the PTP clock state is set toLOCKED.
15.5.4. PTP events consumer application reference
PTP event consumer applications require the following features:
-
A web service running with a
POSThandler to receive the cloud native PTP events JSON payload -
A
createSubscriptionfunction to subscribe to the PTP events producer -
A
getCurrentStatefunction to poll the current state of the PTP events producer
The following example Go snippets illustrate these requirements:
Example PTP events consumer server function in Go
func server() {
http.HandleFunc("/event", getEvent)
http.ListenAndServe("localhost:8989", nil)
}
func getEvent(w http.ResponseWriter, req *http.Request) {
defer req.Body.Close()
bodyBytes, err := io.ReadAll(req.Body)
if err != nil {
log.Errorf("error reading event %v", err)
}
e := string(bodyBytes)
if e != "" {
processEvent(bodyBytes)
log.Infof("received event %s", string(bodyBytes))
} else {
w.WriteHeader(http.StatusNoContent)
}
}Example PTP events createSubscription function in Go
import (
"github.com/redhat-cne/sdk-go/pkg/pubsub"
"github.com/redhat-cne/sdk-go/pkg/types"
v1pubsub "github.com/redhat-cne/sdk-go/v1/pubsub"
)
// Subscribe to PTP events using REST API
s1,_:=createsubscription("/cluster/node/<node_name>/sync/sync-status/os-clock-sync-state")
s2,_:=createsubscription("/cluster/node/<node_name>/sync/ptp-status/class-change")
s3,_:=createsubscription("/cluster/node/<node_name>/sync/ptp-status/lock-state")
// Create PTP event subscriptions POST
func createSubscription(resourceAddress string) (sub pubsub.PubSub, err error) {
var status int
apiPath:= "/api/ocloudNotifications/v1/"
localAPIAddr:=localhost:8989 // vDU service API address
apiAddr:= "localhost:8089" // event framework API address
subURL := &types.URI{URL: url.URL{Scheme: "http",
Host: apiAddr
Path: fmt.Sprintf("%s%s", apiPath, "subscriptions")}}
endpointURL := &types.URI{URL: url.URL{Scheme: "http",
Host: localAPIAddr,
Path: "event"}}
sub = v1pubsub.NewPubSub(endpointURL, resourceAddress)
var subB []byte
if subB, err = json.Marshal(&sub); err == nil {
rc := restclient.New()
if status, subB = rc.PostWithReturn(subURL, subB); status != http.StatusCreated {
err = fmt.Errorf("error in subscription creation api at %s, returned status %d", subURL, status)
} else {
err = json.Unmarshal(subB, &sub)
}
} else {
err = fmt.Errorf("failed to marshal subscription for %s", resourceAddress)
}
return
}- 1
- Replace
<node_name>with the FQDN of the node that is generating the PTP events. For example,compute-1.example.com.
Example PTP events consumer getCurrentState function in Go
//Get PTP event state for the resource
func getCurrentState(resource string) {
//Create publisher
url := &types.URI{URL: url.URL{Scheme: "http",
Host: localhost:8989,
Path: fmt.SPrintf("/api/ocloudNotifications/v1/%s/CurrentState",resource}}
rc := restclient.New()
status, event := rc.Get(url)
if status != http.StatusOK {
log.Errorf("CurrentState:error %d from url %s, %s", status, url.String(), event)
} else {
log.Debugf("Got CurrentState: %s ", event)
}
}15.5.5. Reference cloud-event-proxy deployment and service CRs
Use the following example cloud-event-proxy deployment and subscriber service CRs as a reference when deploying your PTP events consumer application.
Reference cloud-event-proxy deployment with HTTP transport
apiVersion: apps/v1
kind: Deployment
metadata:
name: event-consumer-deployment
namespace: <namespace>
labels:
app: consumer
spec:
replicas: 1
selector:
matchLabels:
app: consumer
template:
metadata:
labels:
app: consumer
spec:
serviceAccountName: sidecar-consumer-sa
containers:
- name: event-subscriber
image: event-subscriber-app
- name: cloud-event-proxy-as-sidecar
image: openshift4/ose-cloud-event-proxy
args:
- "--metrics-addr=127.0.0.1:9091"
- "--store-path=/store"
- "--transport-host=consumer-events-subscription-service.cloud-events.svc.cluster.local:9043"
- "--http-event-publishers=ptp-event-publisher-service-NODE_NAME.openshift-ptp.svc.cluster.local:9043"
- "--api-port=8089"
env:
- name: NODE_NAME
valueFrom:
fieldRef:
fieldPath: spec.nodeName
volumeMounts:
- name: pubsubstore
mountPath: /store
ports:
- name: metrics-port
containerPort: 9091
- name: sub-port
containerPort: 9043
volumes:
- name: pubsubstore
emptyDir: {}Reference cloud-event-proxy subscriber service
apiVersion: v1
kind: Service
metadata:
annotations:
prometheus.io/scrape: "true"
service.alpha.openshift.io/serving-cert-secret-name: sidecar-consumer-secret
name: consumer-events-subscription-service
namespace: cloud-events
labels:
app: consumer-service
spec:
ports:
- name: sub-port
port: 9043
selector:
app: consumer
clusterIP: None
sessionAffinity: None
type: ClusterIP15.5.6. Subscribing to PTP events with the REST API v1
Deploy your cloud-event-consumer application container and cloud-event-proxy sidecar container in a separate application pod.
Subscribe the cloud-event-consumer application to PTP events posted by the cloud-event-proxy container at http://localhost:8089/api/ocloudNotifications/v1/ in the application pod.
9089 is the default port for the cloud-event-consumer container deployed in the application pod. You can configure a different port for your application as required.
15.5.7. Verifying that the PTP events REST API v1 consumer application is receiving events
Verify that the cloud-event-proxy container in the application pod is receiving PTP events.
Prerequisites
-
You have installed the OpenShift CLI (
oc). -
You have logged in as a user with
cluster-adminprivileges. - You have installed and configured the PTP Operator.
Procedure
Get the list of active
linuxptp-daemonpods. Run the following command:$ oc get pods -n openshift-ptpExample output
NAME READY STATUS RESTARTS AGE linuxptp-daemon-2t78p 3/3 Running 0 8h linuxptp-daemon-k8n88 3/3 Running 0 8hAccess the metrics for the required consumer-side
cloud-event-proxycontainer by running the following command:$ oc exec -it <linuxptp-daemon> -n openshift-ptp -c cloud-event-proxy -- curl 127.0.0.1:9091/metricswhere:
- <linuxptp-daemon>
Specifies the pod you want to query, for example,
linuxptp-daemon-2t78p.Example output
# HELP cne_transport_connections_resets Metric to get number of connection resets # TYPE cne_transport_connections_resets gauge cne_transport_connection_reset 1 # HELP cne_transport_receiver Metric to get number of receiver created # TYPE cne_transport_receiver gauge cne_transport_receiver{address="/cluster/node/compute-1.example.com/ptp",status="active"} 2 cne_transport_receiver{address="/cluster/node/compute-1.example.com/redfish/event",status="active"} 2 # HELP cne_transport_sender Metric to get number of sender created # TYPE cne_transport_sender gauge cne_transport_sender{address="/cluster/node/compute-1.example.com/ptp",status="active"} 1 cne_transport_sender{address="/cluster/node/compute-1.example.com/redfish/event",status="active"} 1 # HELP cne_events_ack Metric to get number of events produced # TYPE cne_events_ack gauge cne_events_ack{status="success",type="/cluster/node/compute-1.example.com/ptp"} 18 cne_events_ack{status="success",type="/cluster/node/compute-1.example.com/redfish/event"} 18 # HELP cne_events_transport_published Metric to get number of events published by the transport # TYPE cne_events_transport_published gauge cne_events_transport_published{address="/cluster/node/compute-1.example.com/ptp",status="failed"} 1 cne_events_transport_published{address="/cluster/node/compute-1.example.com/ptp",status="success"} 18 cne_events_transport_published{address="/cluster/node/compute-1.example.com/redfish/event",status="failed"} 1 cne_events_transport_published{address="/cluster/node/compute-1.example.com/redfish/event",status="success"} 18 # HELP cne_events_transport_received Metric to get number of events received by the transport # TYPE cne_events_transport_received gauge cne_events_transport_received{address="/cluster/node/compute-1.example.com/ptp",status="success"} 18 cne_events_transport_received{address="/cluster/node/compute-1.example.com/redfish/event",status="success"} 18 # HELP cne_events_api_published Metric to get number of events published by the rest api # TYPE cne_events_api_published gauge cne_events_api_published{address="/cluster/node/compute-1.example.com/ptp",status="success"} 19 cne_events_api_published{address="/cluster/node/compute-1.example.com/redfish/event",status="success"} 19 # HELP cne_events_received Metric to get number of events received # TYPE cne_events_received gauge cne_events_received{status="success",type="/cluster/node/compute-1.example.com/ptp"} 18 cne_events_received{status="success",type="/cluster/node/compute-1.example.com/redfish/event"} 18 # HELP promhttp_metric_handler_requests_in_flight Current number of scrapes being served. # TYPE promhttp_metric_handler_requests_in_flight gauge promhttp_metric_handler_requests_in_flight 1 # HELP promhttp_metric_handler_requests_total Total number of scrapes by HTTP status code. # TYPE promhttp_metric_handler_requests_total counter promhttp_metric_handler_requests_total{code="200"} 4 promhttp_metric_handler_requests_total{code="500"} 0 promhttp_metric_handler_requests_total{code="503"} 0
15.5.8. Monitoring PTP fast event metrics
You can monitor PTP fast events metrics from cluster nodes where the linuxptp-daemon is running. You can also monitor PTP fast event metrics in the OpenShift Container Platform web console by using the preconfigured and self-updating Prometheus monitoring stack.
Prerequisites
-
Install the OpenShift Container Platform CLI
oc. -
Log in as a user with
cluster-adminprivileges. - Install and configure the PTP Operator on a node with PTP-capable hardware.
Procedure
Start a debug pod for the node by running the following command:
$ oc debug node/<node_name>Check for PTP metrics exposed by the
linuxptp-daemoncontainer. For example, run the following command:sh-4.4# curl http://localhost:9091/metricsExample output
# HELP cne_api_events_published Metric to get number of events published by the rest api # TYPE cne_api_events_published gauge cne_api_events_published{address="/cluster/node/compute-1.example.com/sync/gnss-status/gnss-sync-status",status="success"} 1 cne_api_events_published{address="/cluster/node/compute-1.example.com/sync/ptp-status/lock-state",status="success"} 94 cne_api_events_published{address="/cluster/node/compute-1.example.com/sync/ptp-status/class-change",status="success"} 18 cne_api_events_published{address="/cluster/node/compute-1.example.com/sync/sync-status/os-clock-sync-state",status="success"} 27Optional. You can also find PTP events in the logs for the
cloud-event-proxycontainer. For example, run the following command:$ oc logs -f linuxptp-daemon-cvgr6 -n openshift-ptp -c cloud-event-proxy-
To view the PTP event in the OpenShift Container Platform web console, copy the name of the PTP metric you want to query, for example,
openshift_ptp_offset_ns. - In the OpenShift Container Platform web console, click Observe → Metrics.
- Paste the PTP metric name into the Expression field, and click Run queries.
15.5.9. PTP fast event metrics reference
The following table describes the PTP fast events metrics that are available from cluster nodes where the linuxptp-daemon service is running.
| Metric | Description | Example |
|---|---|---|
|
|
Returns the PTP clock class for the interface. Possible values for PTP clock class are 6 ( |
|
|
|
Returns the current PTP clock state for the interface. Possible values for PTP clock state are |
|
|
| Returns the delay in nanoseconds between the primary clock sending the timing packet and the secondary clock receiving the timing packet. |
|
|
|
Returns the current status of the highly available system clock when there are multiple time sources on different NICs. Possible values are 0 ( |
|
|
|
Returns the frequency adjustment in nanoseconds between 2 PTP clocks. For example, between the upstream clock and the NIC, between the system clock and the NIC, or between the PTP hardware clock ( |
|
|
|
Returns the configured PTP clock role for the interface. Possible values are 0 ( |
|
|
|
Returns the maximum offset in nanoseconds between 2 clocks or interfaces. For example, between the upstream GNSS clock and the NIC ( |
|
|
| Returns the offset in nanoseconds between the DPLL clock or the GNSS clock source and the NIC hardware clock. |
|
|
|
Returns a count of the number of times the |
|
|
| Returns a status code that shows whether the PTP processes are running or not. |
|
|
|
Returns values for
|
|
15.5.9.1. PTP fast event metrics only when T-GM is enabled
The following table describes the PTP fast event metrics that are available only when PTP grandmaster clock (T-GM) is enabled.
| Metric | Description | Example |
|---|---|---|
|
|
Returns the current status of the digital phase-locked loop (DPLL) frequency for the NIC. Possible values are -1 ( |
|
|
|
Returns the current status of the NMEA connection. NMEA is the protocol that is used for 1PPS NIC connections. Possible values are 0 ( |
|
|
|
Returns the status of the DPLL phase for the NIC. Possible values are -1 ( |
|
|
|
Returns the current status of the NIC 1PPS connection. You use the 1PPS connection to synchronize timing between connected NICs. Possible values are 0 ( |
|
|
|
Returns the current status of the global navigation satellite system (GNSS) connection. GNSS provides satellite-based positioning, navigation, and timing services globally. Possible values are 0 ( |
|
15.6. PTP events REST API v1 reference
Use the following Precision Time Protocol (PTP) fast event REST API v1 endpoints to subscribe the cloud-event-consumer application to PTP events posted by the cloud-event-proxy container at http://localhost:8089/api/ocloudNotifications/v1/ in the application pod.
The PTP events REST API v1 will be deprecated in a future release. When developing applications that use PTP events, use the PTP events REST API v2.
The following API endpoints are available:
api/ocloudNotifications/v1/subscriptions-
POST: Creates a new subscription -
GET: Retrieves a list of subscriptions -
DELETE: Deletes all subscriptions
-
api/ocloudNotifications/v1/subscriptions/{subscription_id}-
GET: Returns details for the specified subscription ID -
DELETE: Deletes the subscription associated with the specified subscription ID
-
api/ocloudNotifications/v1/health-
GET: Returns the health status ofocloudNotificationsAPI
-
api/ocloudNotifications/v1/publishers-
GET: Returns a list of PTP event publishers for the cluster node
-
api/ocloudnotifications/v1/{resource_address}/CurrentState-
GET: Returns the current state of one the following event types:sync-state,os-clock-sync-state,clock-class,lock-state, orgnss-sync-statusevents
-
15.6.1. PTP events REST API v1 endpoints
15.6.1.1. api/ocloudNotifications/v1/subscriptions
HTTP method
GET api/ocloudNotifications/v1/subscriptions
Description
Returns a list of subscriptions. If subscriptions exist, a 200 OK status code is returned along with the list of subscriptions.
Example API response
[
{
"id": "75b1ad8f-c807-4c23-acf5-56f4b7ee3826",
"endpointUri": "http://localhost:9089/event",
"uriLocation": "http://localhost:8089/api/ocloudNotifications/v1/subscriptions/75b1ad8f-c807-4c23-acf5-56f4b7ee3826",
"resource": "/cluster/node/compute-1.example.com/ptp"
}
]HTTP method
POST api/ocloudNotifications/v1/subscriptions
Description
Creates a new subscription for the required event by passing the appropriate payload. If a subscription is successfully created, or if it already exists, a 201 Created status code is returned. You can subscribe to the following PTP events:
-
lock-stateevents -
os-clock-sync-stateevents -
clock-classevents -
gnss-sync-statusevents -
sync-stateevents
| Parameter | Type |
|---|---|
| subscription | data |
Example PTP events subscription payload
{
"endpointUri": "http://localhost:8989/event",
"resource": "/cluster/node/compute-1.example.com/ptp"
}Example PTP lock-state events subscription payload
{
"endpointUri": "http://localhost:8989/event",
"resource": "/cluster/node/{node_name}/sync/ptp-status/lock-state"
}Example PTP os-clock-sync-state events subscription payload
{
"endpointUri": "http://localhost:8989/event",
"resource": "/cluster/node/{node_name}/sync/sync-status/os-clock-sync-state"
}Example PTP clock-class events subscription payload
{
"endpointUri": "http://localhost:8989/event",
"resource": "/cluster/node/{node_name}/sync/ptp-status/clock-class"
}Example PTP gnss-sync-status events subscription payload
{
"endpointUri": "http://localhost:8989/event",
"resource": "/cluster/node/{node_name}/sync/gnss-status/gnss-sync-status"
}Example sync-state subscription payload
{
"endpointUri": "http://localhost:8989/event",
"resource": "/cluster/node/{node_name}/sync/sync-status/sync-state"
}HTTP method
DELETE api/ocloudNotifications/v1/subscriptions
Description
Deletes all subscriptions.
Example API response
{
"status": "deleted all subscriptions"
}15.6.1.2. api/ocloudNotifications/v1/subscriptions/{subscription_id}
HTTP method
GET api/ocloudNotifications/v1/subscriptions/{subscription_id}
Description
Returns details for the subscription with ID subscription_id.
| Parameter | Type |
|---|---|
|
| string |
Example API response
{
"id":"48210fb3-45be-4ce0-aa9b-41a0e58730ab",
"endpointUri": "http://localhost:9089/event",
"uriLocation":"http://localhost:8089/api/ocloudNotifications/v1/subscriptions/48210fb3-45be-4ce0-aa9b-41a0e58730ab",
"resource":"/cluster/node/compute-1.example.com/ptp"
}HTTP method
DELETE api/ocloudNotifications/v1/subscriptions/{subscription_id}
Description
Deletes the subscription with ID subscription_id.
| Parameter | Type |
|---|---|
|
| string |
Example API response
{
"status": "OK"
}15.6.1.3. api/ocloudNotifications/v1/health
HTTP method
GET api/ocloudNotifications/v1/health/
Description
Returns the health status for the ocloudNotifications REST API.
Example API response
OK15.6.1.4. api/ocloudNotifications/v1/publishers
The api/ocloudNotifications/v1/publishers endpoint is only available from the cloud-event-proxy container in the PTP Operator managed pod. It is not available for consumer applications in the application pod.
HTTP method
GET api/ocloudNotifications/v1/publishers
Description
Returns a list of publisher details for the cluster node. The system generates notifications when the relevant equipment state changes.
You can use equipment synchronization status subscriptions together to deliver a detailed view of the overall synchronization health of the system.
Example API response
[
{
"id": "0fa415ae-a3cf-4299-876a-589438bacf75",
"endpointUri": "http://localhost:9085/api/ocloudNotifications/v1/dummy",
"uriLocation": "http://localhost:9085/api/ocloudNotifications/v1/publishers/0fa415ae-a3cf-4299-876a-589438bacf75",
"resource": "/cluster/node/compute-1.example.com/sync/sync-status/os-clock-sync-state"
},
{
"id": "28cd82df-8436-4f50-bbd9-7a9742828a71",
"endpointUri": "http://localhost:9085/api/ocloudNotifications/v1/dummy",
"uriLocation": "http://localhost:9085/api/ocloudNotifications/v1/publishers/28cd82df-8436-4f50-bbd9-7a9742828a71",
"resource": "/cluster/node/compute-1.example.com/sync/ptp-status/clock-class"
},
{
"id": "44aa480d-7347-48b0-a5b0-e0af01fa9677",
"endpointUri": "http://localhost:9085/api/ocloudNotifications/v1/dummy",
"uriLocation": "http://localhost:9085/api/ocloudNotifications/v1/publishers/44aa480d-7347-48b0-a5b0-e0af01fa9677",
"resource": "/cluster/node/compute-1.example.com/sync/ptp-status/lock-state"
},
{
"id": "778da345d-4567-67b0-a43f0-rty885a456",
"endpointUri": "http://localhost:9085/api/ocloudNotifications/v1/dummy",
"uriLocation": "http://localhost:9085/api/ocloudNotifications/v1/publishers/778da345d-4567-67b0-a43f0-rty885a456",
"resource": "/cluster/node/compute-1.example.com/sync/gnss-status/gnss-sync-status"
}
]15.6.1.5. api/ocloudNotifications/v1/{resource_address}/CurrentState
HTTP method
GET api/ocloudNotifications/v1/cluster/node/{node_name}/sync/ptp-status/lock-state/CurrentState
GET api/ocloudNotifications/v1/cluster/node/{node_name}/sync/sync-status/os-clock-sync-state/CurrentState
GET api/ocloudNotifications/v1/cluster/node/{node_name}/sync/ptp-status/clock-class/CurrentState
GET api/ocloudNotifications/v1/cluster/node/{node_name}/sync/sync-status/sync-state/CurrentState
GET api/ocloudNotifications/v1/cluster/node/{node_name}/sync/gnss-status/gnss-sync-state/CurrentState
Description
Returns the current state of the os-clock-sync-state, clock-class, lock-state, gnss-sync-status, or sync-state events for the cluster node.
-
os-clock-sync-statenotifications describe the host operating system clock synchronization state. Can be inLOCKEDorFREERUNstate. -
clock-classnotifications describe the current state of the PTP clock class. -
lock-statenotifications describe the current status of the PTP equipment lock state. Can be inLOCKED,HOLDOVERorFREERUNstate. -
sync-statenotifications describe the current status of the least synchronized of theptp-status/lock-stateandsync-status/os-clock-sync-stateendpoints. -
gnss-sync-statusnotifications describe the GNSS clock synchronization state.
| Parameter | Type |
|---|---|
|
| string |
Example lock-state API response
{
"id": "c1ac3aa5-1195-4786-84f8-da0ea4462921",
"type": "event.sync.ptp-status.ptp-state-change",
"source": "/cluster/node/compute-1.example.com/sync/ptp-status/lock-state",
"dataContentType": "application/json",
"time": "2023-01-10T02:41:57.094981478Z",
"data": {
"version": "1.0",
"values": [
{
"ResourceAddress": "/cluster/node/compute-1.example.com/ens5fx/master",
"data_type": "notification",
"value_type": "enumeration",
"value": "LOCKED"
},
{
"ResourceAddress": "/cluster/node/compute-1.example.com/ens5fx/master",
"data_type": "metric",
"value_type": "decimal64.3",
"value": "29"
}
]
}
}Example os-clock-sync-state API response
{
"specversion": "0.3",
"id": "4f51fe99-feaa-4e66-9112-66c5c9b9afcb",
"source": "/cluster/node/compute-1.example.com/sync/sync-status/os-clock-sync-state",
"type": "event.sync.sync-status.os-clock-sync-state-change",
"subject": "/cluster/node/compute-1.example.com/sync/sync-status/os-clock-sync-state",
"datacontenttype": "application/json",
"time": "2022-11-29T17:44:22.202Z",
"data": {
"version": "1.0",
"values": [
{
"ResourceAddress": "/cluster/node/compute-1.example.com/CLOCK_REALTIME",
"data_type": "notification",
"value_type": "enumeration",
"value": "LOCKED"
},
{
"ResourceAddress": "/cluster/node/compute-1.example.com/CLOCK_REALTIME",
"data_type": "metric",
"value_type": "decimal64.3",
"value": "27"
}
]
}
}Example clock-class API response
{
"id": "064c9e67-5ad4-4afb-98ff-189c6aa9c205",
"type": "event.sync.ptp-status.ptp-clock-class-change",
"source": "/cluster/node/compute-1.example.com/sync/ptp-status/clock-class",
"dataContentType": "application/json",
"time": "2023-01-10T02:41:56.785673989Z",
"data": {
"version": "1.0",
"values": [
{
"ResourceAddress": "/cluster/node/compute-1.example.com/ens5fx/master",
"data_type": "metric",
"value_type": "decimal64.3",
"value": "165"
}
]
}
}Example sync-state API response
{
"specversion": "0.3",
"id": "8c9d6ecb-ae9f-4106-82c4-0a778a79838d",
"source": "/sync/sync-status/sync-state",
"type": "event.sync.sync-status.synchronization-state-change",
"subject": "/cluster/node/compute-1.example.com/sync/sync-status/sync-state",
"datacontenttype": "application/json",
"time": "2024-08-28T14:50:57.327585316Z",
"data":
{
"version": "1.0",
"values": [
{
"ResourceAddress": "/cluster/node/compute-1.example.com/sync/sync-status/sync-state",
"data_type": "notification",
"value_type": "enumeration",
"value": "LOCKED"
}]
}
}Example gnss-sync-status API response
{
"id": "435e1f2a-6854-4555-8520-767325c087d7",
"type": "event.sync.gnss-status.gnss-state-change",
"source": "/cluster/node/compute-1.example.com/sync/gnss-status/gnss-sync-status",
"dataContentType": "application/json",
"time": "2023-09-27T19:35:33.42347206Z",
"data": {
"version": "1.0",
"values": [
{
"ResourceAddress": "/cluster/node/compute-1.example.com/ens2fx/master",
"data_type": "notification",
"value_type": "enumeration",
"value": "LOCKED"
},
{
"ResourceAddress": "/cluster/node/compute-1.example.com/ens2fx/master",
"data_type": "metric",
"value_type": "decimal64.3",
"value": "5"
}
]
}
}Chapter 16. CIDR range definitions
If your cluster uses OVN-Kubernetes, you must specify non-overlapping ranges for Classless Inter-Domain Routing (CIDR) subnet ranges.
The following subnet types are mandatory for a cluster that uses OVN-Kubernetes:
- Join: Uses a join switch to connect gateway routers to distributed routers. A join switch reduces the number of IP addresses for a distributed router. For a cluster that uses the OVN-Kubernetes plugin, an IP address from a dedicated subnet is assigned to any logical port that attaches to the join switch.
- Masquerade: Prevents collisions for identical source and destination IP addresses that are sent from a node as hairpin traffic to the same node after a load balancer makes a routing decision.
- Transit: A transit switch is a type of distributed switch that spans across all nodes in the cluster. A transit switch routes traffic between different zones. For a cluster that uses the OVN-Kubernetes plugin, an IP address from a dedicated subnet is assigned to any logical port that attaches to the transit switch.
You can change the join and transit CIDR ranges for your cluster as a post-installation task.
OVN-Kubernetes, the default network provider in OpenShift Container Platform 4.14 and later versions, internally uses the following IP address subnet ranges:
-
V4JoinSubnet:100.64.0.0/16 -
V6JoinSubnet:fd98::/64 -
V4TransitSwitchSubnet:100.88.0.0/16 -
V6TransitSwitchSubnet:fd97::/64 -
defaultV4MasqueradeSubnet:169.254.169.0/29 -
defaultV6MasqueradeSubnet:fd69::/125
The earlier list includes join, transit, and masquerade IPv4 and IPv6 address subnets. If your cluster uses OVN-Kubernetes, do not include any of these IP address subnet ranges in any other CIDR definitions in your cluster or infrastructure.
16.1. Machine CIDR
In the Machine classless inter-domain routing (CIDR) field, you must specify the IP address range for machines or cluster nodes.
You cannot change Machine CIDR ranges after you created your cluster.
The default is 10.0.0.0/16. This range must not conflict with any connected networks.
16.2. Service CIDR
In the Service CIDR field, you must specify the IP address range for services. The range must be large enough to accommodate your workload. The address block must not overlap with any external service accessed from within the cluster. The default is 172.30.0.0/16.
16.3. Pod CIDR
In the pod CIDR field, you must specify the IP address range for pods.
The pod CIDR is the same as the clusterNetwork CIDR and the cluster CIDR. The range must be large enough to accommodate your workload. The address block must not overlap with any external service accessed from within the cluster. The default is 10.128.0.0/14. You can expand the range after cluster installation.
16.4. Host prefix
In the hostPrefix parameter, you must specify the subnet prefix length assigned to pods scheduled to individual machines. The host prefix determines the pod IP address pool for each machine.
For example, if the host prefix is set to /23, each machine is assigned a /23 subnet from the pod CIDR address range. The default is /23, allowing 510 cluster nodes, and 510 pod IP addresses per node.
Consider another example where you set the clusterNetwork.cidr parameter to 10.128.0.0/16, you define the complete address space for the cluster. This assigns a pool of 65536 IP addresses to your cluster. If you then set the hostPrefix parameter to /23, you define a subnet slice to each node in the cluster, where the /23 slice becomes a subnet of the /16 subnet network. This assigns 512 IP addresses to each node, where 2 IP addresses get reserved for networking and broadcasting purposes. The following example calculation uses these IP address figures to determine the maximum number of nodes that you can create for your cluster:
65536 / 512 = 128You can use the Red Hat OpenShift Network Calculator to calculate the maximum number of nodes for your cluster.
Chapter 17. Multiple networks
17.1. Understanding multiple networks
OpenShift Container Platform administrators and users can use NetworkAttachmentDefinition (NADs) to define the networks that handle all of the ordinary network traffic of the cluster.
17.1.1. About using multiple networks with the OVN-K CNI
You can define more than one additional network for your cluster. This gives you flexibility when you configure pods that deliver network functionality, such as switching or routing.
By default, OVN-Kubernetes serves as the Container Network Interface (CNI) of an OpenShift Container Platform cluster. This network interface is what administrators use to create default networks. During cluster installation, you configure your default pod network. The default network handles all ordinary network traffic for the cluster.
OpenShift Container Platform uses the Multus CNI plugin to allow chaining of CNI plugins. You can define an additional network based on the available CNI plugins and attach one or more of these networks to your pods.
17.1.2. Usage scenarios for an additional network
You can use an additional network in situations where you require network isolation, including for data plane and control plane separation.
Isolating network traffic is useful for the following performance and security reasons:
- Performance
- You can send traffic on two different planes to manage how much traffic is along each plane.
- Security
- You can send sensitive traffic onto a network plane that is managed specifically for security considerations, and you can separate private data that must not be shared between tenants or customers.
All of the pods in the cluster still use the cluster-wide default network to maintain connectivity across the cluster. Every pod has an eth0 interface that is attached to the cluster-wide pod network. You can view the interfaces for a pod by using the oc exec -it <pod_name> -- ip a command. If you add additional network interfaces that use Multus CNI, they are named net1, net2, and so on.
To attach additional network interfaces to a pod, you must create configurations that define how the interfaces are attached. You specify each interface by using a NetworkAttachmentDefinition custom resource (CR). A CNI configuration inside each of these CRs defines how that interface is created.
17.2. Additional networks in OpenShift Container Platform
You can use the following Container Network Interface (CNI) plugins for creating additional networks in your OpenShift Container Platform cluster.
- bridge: Configure a bridge-based additional network to allow pods on the same host to communicate with each other and the host.
- bond-cni: Configure a Bond CNI secondary network to provide a method for aggregating multiple network interfaces into a single logical bonded interface.
- host-device: Configure a host-device additional network to allow pods access to a physical Ethernet network device on the host system.
- ipvlan: Configure an ipvlan-based additional network to allow pods on a host to communicate with other hosts and pods on those hosts, similar to a macvlan-based additional network. Unlike a macvlan-based additional network, each pod shares the same MAC address as the parent physical network interface.
- vlan: Configure a vlan-based additional network to allow VLAN-based network isolation and connectivity for pods.
- macvlan: Configure a macvlan-based additional network to allow pods on a host to communicate with other hosts and pods on those hosts by using a physical network interface. Each pod that is attached to a macvlan-based additional network is provided a unique MAC address.
- TAP: Configure a tap-based additional network to create a tap device inside the container namespace. A tap device enables user space programs to send and receive network packets.
- SR-IOV: Configure an SR-IOV based additional network to allow pods to attach to a virtual function (VF) interface on SR-IOV capable hardware on the host system.
-
route-override: Configure a
route-overridebased additional network to allow pods to override and set routes.
17.3. Configuring an additional network
Cluster administrators can configure an additional network based upon their infrastructure doing so provides more granular control of your network deployment.
The following network types are supported:
- Bridge
- Host device
- Bond CNI
- VLAN
- IPVLAN
- MACVLAN
- TAP
- OVN-Kubernetes
- Route-override
17.3.1. Configuration for a bridge additional network
The Bridge CNI plugin JSON configuration object describes the configuration parameters for the Bridge CNI plugin.
The following table details the configuration parameters:
| Field | Type | Description |
|---|---|---|
|
|
|
The CNI specification version. A minimum version of |
|
|
|
The value for the |
|
|
|
The name of the CNI plugin to configure: |
|
|
| The configuration object for the IPAM CNI plugin. The plugin manages IP address assignment for the attachment definition. |
|
|
|
Optional: Specify the name of the virtual bridge to use. If the bridge interface does not exist on the host, the bridge interface gets created. The default value is |
|
|
|
Optional: Set to |
|
|
|
Optional: Controls the container interface ( |
|
|
|
Optional: Set to |
|
|
|
Optional: Set to |
|
|
|
Optional: Set to |
|
|
|
Optional: Set to |
|
|
|
Optional: Set to |
|
|
| Optional: Specify a virtual LAN (VLAN) tag as an integer value. By default, no VLAN tag is assigned. |
|
|
|
Optional: Indicates whether the default vlan must be preserved on the |
|
|
|
Optional: If |
|
|
|
Optional: Assign a VLAN trunk tag. The default value is |
|
|
| Optional: Set the maximum transmission unit (MTU) to the specified value. The default value is automatically set by the kernel. |
|
|
|
Optional: Enables duplicate address detection for the container side |
|
|
|
Optional: Enables mac spoof check, limiting the traffic originating from the container to the mac address of the interface. The default value is |
The VLAN parameter configures the VLAN tag on the host end of the veth and also enables the vlan_filtering feature on the bridge interface.
To configure an uplink for an L2 network, you must allow the VLAN on the uplink interface by using the following command:
$ bridge vlan add vid VLAN_ID dev DEV17.3.1.1. Bridge CNI plugin configuration example
The following example configures an additional network named bridge-net:
{
"cniVersion": "0.3.1",
"name": "bridge-net",
"type": "bridge",
"isGateway": true,
"vlan": 2,
"ipam": {
"type": "dhcp"
}
}17.3.2. Configuration for a host device additional network
The host device CNI plugin JSON configuration object describes the configuration parameters for the host-device CNI plugin.
Specify your network device by setting only one of the following parameters: device,hwaddr, kernelpath, or pciBusID.
The following table details the configuration parameters:
| Field | Type | Description |
|---|---|---|
|
|
|
The CNI specification version. A minimum version of |
|
|
|
The value for the |
|
|
|
The name of the CNI plugin to configure: |
|
|
|
Optional: The name of the device, such as |
|
|
| Optional: The device hardware MAC address. |
|
|
|
Optional: The Linux kernel device path, such as |
|
|
|
Optional: The PCI address of the network device, such as |
17.3.2.1. host-device configuration example
The following example configures an additional network named hostdev-net:
{
"cniVersion": "0.3.1",
"name": "hostdev-net",
"type": "host-device",
"device": "eth1"
}17.3.3. Configuration for a Bond CNI secondary network
The Bond Container Network Interface (Bond CNI) enables the aggregation of multiple network interfaces into a single logical bonded interface within a container, which enhanches network redundancy and fault tolerance. Only SR-IOV Virtual Functions (VFs) are supported for bonding with this plugin.
The following table describes the configuration parameters for the Bond CNI plugin:
| Field | Type | Description |
|---|---|---|
|
|
| Specifies the name given to this CNI network attachment definition. This name is used to identify and reference the interface within the container. |
|
|
|
The CNI specification version. A minimum version of |
|
|
|
Specifies the name of the CNI plugin to configure: |
|
|
| Specifies the address resolution protocol (ARP) link monitoring frequency in milliseconds. This parameter defines how often the bond interface sends ARP requests to check the availability of its aggregated interfaces. |
|
|
|
Optional: Specifies the maximum transmission unit (MTU) of the bond. The default is |
|
|
|
Optional: Specifies the |
|
|
| Specifies the bonding policy. |
|
|
|
Optional: Specifies whether the network interfaces intended for bonding are expected to be created and available directly within the network namespace of the container when the bond starts. If |
|
|
| Specifies the interfaces to be bonded. |
|
|
| The configuration object for the IPAM CNI plugin. The plugin manages IP address assignment for the attachment definition. |
17.3.3.1. Bond CNI plugin configuration example
The following example configures a secondary network named bond-net1:
{
"type": "bond",
"cniVersion": "0.3.1",
"name": "bond-net1",
"mode": "active-backup",
"failOverMac": 1,
"linksInContainer": true,
"miimon": "100",
"mtu": 1500,
"links": [
{"name": "net1"},
{"name": "net2"}
],
"ipam": {
"type": "host-local",
"subnet": "10.56.217.0/24",
"routes": [{
"dst": "0.0.0.0/0"
}],
"gateway": "10.56.217.1"
}
}17.3.3.2. Configuration for a VLAN additional network
The VLAN CNI plugin JSON configuration object describes the configuration parameters for the VLAN, vlan, CNI plugin. The following table details these parameters:
| Field | Type | Description |
|---|---|---|
|
|
|
The CNI specification version. A minimum version of |
|
|
|
The value for the |
|
|
|
The name of the CNI plugin to configure: |
|
|
|
The Ethernet interface to associate with the network attachment. If a |
|
|
|
Set the ID of the |
|
|
| The configuration object for the IPAM CNI plugin. The plugin manages IP address assignment for the attachment definition. |
|
|
| Optional: Set the maximum transmission unit (MTU) to the specified value. The default value is automatically set by the kernel. |
|
|
| Optional: DNS information to return. For example, a priority-ordered list of DNS nameservers. |
|
|
|
Optional: Specifies whether the |
A NetworkAttachmentDefinition custom resource definition (CRD) with a vlan configuration can be used only on a single pod in a node because the CNI plugin cannot create multiple vlan subinterfaces with the same vlanId on the same master interface.
17.3.3.2.1. VLAN configuration example
The following example demonstrates a vlan configuration with an additional network that is named vlan-net:
{
"name": "vlan-net",
"cniVersion": "0.3.1",
"type": "vlan",
"master": "eth0",
"mtu": 1500,
"vlanId": 5,
"linkInContainer": false,
"ipam": {
"type": "host-local",
"subnet": "10.1.1.0/24"
},
"dns": {
"nameservers": [ "10.1.1.1", "8.8.8.8" ]
}
}-
ipam.type.host-local: Allocates IPv4 and IPv6 IP addresses from a specified set of address ranges. IPAM plugin stores the IP addresses locally on the host filesystem so that the addresses remain unique to the host.
17.3.3.3. Configuration for an IPVLAN additional network
The IPVLAN CNI plugin JSON configuration object describes the configuration parameters for the IPVLAN, ipvlan, CNI plugin. The following table details these parameters:
| Field | Type | Description |
|---|---|---|
|
|
|
The CNI specification version. A minimum version of |
|
|
|
The value for the |
|
|
|
The name of the CNI plugin to configure: |
|
|
| The configuration object for the IPAM CNI plugin. The plugin manages IP address assignment for the attachment definition. This is required unless the plugin is chained. |
|
|
|
Optional: The operating mode for the virtual network. The value must be |
|
|
|
Optional: The Ethernet interface to associate with the network attachment. If a |
|
|
| Optional: Set the maximum transmission unit (MTU) to the specified value. The default value is automatically set by the kernel. |
|
|
|
Optional: Specifies whether the |
-
The
ipvlanobject does not allow virtual interfaces to communicate with themasterinterface. Therefore the container is not able to reach the host by using theipvlaninterface. Be sure that the container joins a network that provides connectivity to the host, such as a network supporting the Precision Time Protocol (PTP). -
A single
masterinterface cannot simultaneously be configured to use bothmacvlanandipvlan. -
For IP allocation schemes that cannot be interface agnostic, the
ipvlanplugin can be chained with an earlier plugin that handles this logic. If themasteris omitted, then the previous result must contain a single interface name for theipvlanplugin to enslave. Ifipamis omitted, then the previous result is used to configure theipvlaninterface.
17.3.3.3.1. IPVLAN CNI plugin configuration example
The following example configures an additional network named ipvlan-net:
{
"cniVersion": "0.3.1",
"name": "ipvlan-net",
"type": "ipvlan",
"master": "eth1",
"linkInContainer": false,
"mode": "l3",
"ipam": {
"type": "static",
"addresses": [
{
"address": "192.168.10.10/24"
}
]
}
}17.3.3.4. Configuration for a MACVLAN additional network
The MACVLAN CNI plugin JSON configuration object describes the configuration parameters for the MAC Virtual LAN (MACVLAN) Container Network Interface (CNI) plugin. The following table describes these parameters:
| Field | Type | Description |
|---|---|---|
|
|
|
The CNI specification version. A minimum version of |
|
|
|
The value for the |
|
|
|
The name of the CNI plugin to configure: |
|
|
| The configuration object for the IPAM CNI plugin. The plugin manages IP address assignment for the attachment definition. |
|
|
|
Optional: Configures traffic visibility on the virtual network. Must be either |
|
|
| Optional: The host network interface to associate with the newly created macvlan interface. If a value is not specified, then the default route interface is used. |
|
|
| Optional: The maximum transmission unit (MTU) to the specified value. The default value is automatically set by the kernel. |
|
|
|
Optional: Specifies whether the |
If you specify the master key for the plugin configuration, use a different physical network interface than the one that is associated with your primary network plugin to avoid possible conflicts.
17.3.3.4.1. MACVLAN CNI plugin configuration example
The following example configures an additional network named macvlan-net:
{
"cniVersion": "0.3.1",
"name": "macvlan-net",
"type": "macvlan",
"master": "eth1",
"linkInContainer": false,
"mode": "bridge",
"ipam": {
"type": "dhcp"
}
}17.3.3.5. Configuration for a TAP additional network
The TAP CNI plugin JSON configuration object describes the configuration parameters for the TAP CNI plugin. The following table describes these parameters:
| Field | Type | Description |
|---|---|---|
|
|
|
The CNI specification version. A minimum version of |
|
|
|
The value for the |
|
|
|
The name of the CNI plugin to configure: |
|
|
| Optional: Request the specified MAC address for the interface. |
|
|
| Optional: Set the maximum transmission unit (MTU) to the specified value. The default value is automatically set by the kernel. |
|
|
| Optional: The SELinux context to associate with the tap device. Note
The value |
|
|
|
Optional: Set to |
|
|
| Optional: The user owning the tap device. |
|
|
| Optional: The group owning the tap device. |
|
|
| Optional: Set the tap device as a port of an already existing bridge. |
17.3.3.5.1. Tap configuration example
The following example configures an additional network named mynet:
{
"name": "mynet",
"cniVersion": "0.3.1",
"type": "tap",
"mac": "00:11:22:33:44:55",
"mtu": 1500,
"selinuxcontext": "system_u:system_r:container_t:s0",
"multiQueue": true,
"owner": 0,
"group": 0
"bridge": "br1"
}17.3.3.6. Configuring routes using the route-override plugin on an additional network
The Route override CNI plugin JSON configuration object describes the configuration parameters for the route-override CNI plugin. The following table details these parameters:
| Field | Type | Description |
|---|---|---|
|
|
|
The name of the CNI plugin to configure: |
|
|
|
Optional: Set to |
|
|
|
Optional: Set to |
|
|
| Optional: Specify the list of routes to delete from the container namespace. |
|
|
|
Optional: Specify the list of routes to add to the container namespace. Each route is a dictionary with |
|
|
|
Optional: Set this to |
17.3.3.6.1. Route-override plugin configuration example
The route-override CNI is a type of CNI that is designed to be used when chained with a parent CNI. The CNI type does not operate independently, but relies on the parent CNI to first create the network interface and assign IP addresses before the CNI type can modify the routing rules.
The following example configures a secondary network named mymacvlan. The parent CNI creates a network interface attached to eth1 and assigns an IP address in the 192.168.1.0/24 range by using host-local IPAM. The route-override CNI is then chained to the parent CNI and modifies the routing rules by flushing existing routes, deleting the route to 192.168.0.0/24, and adding a new route for 192.168.0.0/24 with a custom gateway.
{
"cniVersion": "0.3.0",
"name": "mymacvlan",
"plugins": [
{
"type": "macvlan",
"master": "eth1",
"mode": "bridge",
"ipam": {
"type": "host-local",
"subnet": "192.168.1.0/24"
}
},
{
"type": "route-override",
"flushroutes": true,
"delroutes": [
{
"dst": "192.168.0.0/24"
}
],
"addroutes": [
{
"dst": "192.168.0.0/24",
"gw": "10.1.254.254"
}
]
}
]
}where:
"type": "macvlan"-
The parent CNI creates a network interface attached to
eth1. "type": "route-override"-
The chained
route-overrideCNI modifies the routing rules.
17.3.3.7. Configuration for a layer 2 switched topology
The switched (layer 2) topology networks interconnect the workloads through a cluster-wide logical switch. This configuration can be used for IPv6 and dual-stack deployments.
Layer 2 switched topology networks only allow for the transfer of data packets between pods within a cluster.
The following JSON example configures a switched secondary network:
{
"cniVersion": "0.3.1",
"name": "l2-network",
"type": "ovn-k8s-cni-overlay",
"topology":"layer2",
"subnets": "10.100.200.0/24",
"mtu": 1300,
"netAttachDefName": "ns1/l2-network",
"excludeSubnets": "10.100.200.0/29"
}17.3.4. Configuration of IP address assignment for a network attachment
For secondary networks, you can assign IP addresses by using an IP Address Management (IPAM) CNI plugin, which supports various assignment methods, including Dynamic Host Configuration Protocol (DHCP) and static assignment.
You can use the following IP address assignment types:
- Static assignment.
- Dynamic assignment through a DHCP server. The DHCP server you specify must be reachable from the additional network.
- Dynamic assignment through the Whereabouts IPAM CNI plugin.
17.3.4.1. Static IP address assignment configuration
The following table describes the configuration for static IP address assignment:
| Field | Type | Description |
|---|---|---|
|
|
|
The IPAM address type. The value |
|
|
| An array of objects specifying IP addresses to assign to the virtual interface. Both IPv4 and IPv6 IP addresses are supported. |
|
|
| An array of objects specifying routes to configure inside the pod. |
|
|
| Optional: An array of objects specifying the DNS configuration. |
The addresses array requires objects with the following fields:
| Field | Type | Description |
|---|---|---|
|
|
|
An IP address and network prefix that you specify. For example, if you specify |
|
|
| The default gateway to route egress network traffic to. |
| Field | Type | Description |
|---|---|---|
|
|
|
The IP address range in CIDR format, such as |
|
|
| The gateway that routes network traffic. |
| Field | Type | Description |
|---|---|---|
|
|
| An array of one or more IP addresses where DNS queries get sent. |
|
|
|
The default domain to append to a hostname. For example, if the domain is set to |
|
|
|
An array of domain names to append to an unqualified hostname, such as |
Static IP address assignment configuration example
{
"ipam": {
"type": "static",
"addresses": [
{
"address": "191.168.1.7/24"
}
]
}
}17.3.4.2. Dynamic IP address (DHCP) assignment configuration
A pod obtains its original DHCP lease when the pod gets created. The lease must be periodically renewed by a minimal DHCP server deployment running on the cluster.
For an Ethernet network attachment, the SR-IOV Network Operator does not create a DHCP server deployment; the Cluster Network Operator is responsible for creating the minimal DHCP server deployment.
To trigger the deployment of the DHCP server, you must create a shim network attachment by editing the Cluster Network Operator configuration, as in the following example:
Example shim network attachment definition
apiVersion: operator.openshift.io/v1
kind: Network
metadata:
name: cluster
spec:
additionalNetworks:
- name: dhcp-shim
namespace: default
type: Raw
rawCNIConfig: |-
{
"name": "dhcp-shim",
"cniVersion": "0.3.1",
"type": "bridge",
"ipam": {
"type": "dhcp"
}
}
# ...where:
type- Specifies dynamic IP address assignment for the cluster.
The following table describes the configuration parameters for dynamic IP address address assignment with DHCP.
| Field | Type | Description |
|---|---|---|
|
|
|
The IPAM address type. The value |
The following JSON example describes the configuration p for dynamic IP address address assignment with DHCP.
Dynamic IP address (DHCP) assignment configuration example
{
"ipam": {
"type": "dhcp"
}
}17.3.4.3. Dynamic IP address assignment configuration with Whereabouts
The Whereabouts CNI plugin allows the dynamic assignment of an IP address to an additional network without the use of a DHCP server.
The Whereabouts CNI plugin also supports overlapping IP address ranges and configuration of the same CIDR range multiple times within separate NetworkAttachmentDefinition CRDs. This provides greater flexibility and management capabilities in multi-tenant environments.
17.3.4.3.1. Dynamic IP address configuration objects
The following table describes the configuration objects for dynamic IP address assignment with Whereabouts:
| Field | Type | Description |
|---|---|---|
|
|
|
The IPAM address type. The value |
|
|
| An IP address and range in CIDR notation. IP addresses are assigned from within this range of addresses. |
|
|
| Optional: A list of zero or more IP addresses and ranges in CIDR notation. IP addresses within an excluded address range are not assigned. |
|
|
| Optional: Helps ensure that each group or domain of pods gets its own set of IP addresses, even if they share the same range of IP addresses. Setting this field is important for keeping networks separate and organized, notably in multi-tenant environments. |
17.3.4.3.2. Dynamic IP address assignment configuration that uses Whereabouts
The following example shows a dynamic address assignment configuration that uses Whereabouts:
Whereabouts dynamic IP address assignment
{
"ipam": {
"type": "whereabouts",
"range": "192.0.2.192/27",
"exclude": [
"192.0.2.192/30",
"192.0.2.196/32"
]
}
}17.3.4.3.3. Dynamic IP address assignment that uses Whereabouts with overlapping IP address ranges
The following example shows a dynamic IP address assignment that uses overlapping IP address ranges for multi-tenant networks.
NetworkAttachmentDefinition 1
{
"ipam": {
"type": "whereabouts",
"range": "192.0.2.192/29",
"network_name": "example_net_common",
}
}- 1
- Optional. If set, must match the
network_nameofNetworkAttachmentDefinition 2.
NetworkAttachmentDefinition 2
{
"ipam": {
"type": "whereabouts",
"range": "192.0.2.192/24",
"network_name": "example_net_common",
}
}- 1
- Optional. If set, must match the
network_nameofNetworkAttachmentDefinition 1.
17.3.4.4. Creating a whereabouts-reconciler daemon set
The Whereabouts reconciler is responsible for managing dynamic IP address assignments for the pods within a cluster by using the Whereabouts IP Address Management (IPAM) solution. The Whereabouts reconciler ensures that each pod gets a unique IP address from the specified IP address range. The Whereabouts reconciler also handles IP address releases when pods are deleted or scaled down.
You can also use a NetworkAttachmentDefinition custom resource definition (CRD) for dynamic IP address assignment.
The whereabouts-reconciler daemon set is automatically created when you configure a secondary network through the Cluster Network Operator. The whereabouts-reconciler DaemonSet does not get automatically created when you configure a secondary network from a YAML manifest.
To trigger the deployment of the whereabouts-reconciler daemon set, you must manually create a whereabouts-shim network attachment by editing the Cluster Network Operator custom resource (CR) file.
Procedure
Edit the
Network.operator.openshift.ioCR by running the following command:$ oc edit network.operator.openshift.io clusterInclude the
additionalNetworkssection shown in this example YAML extract within thespecdefinition of the CR:apiVersion: operator.openshift.io/v1 kind: Network metadata: name: cluster # ... spec: additionalNetworks: - name: whereabouts-shim namespace: default rawCNIConfig: |- { "name": "whereabouts-shim", "cniVersion": "0.3.1", "type": "bridge", "ipam": { "type": "whereabouts" } } type: Raw # ...- Save the file and exit the text editor.
Verify that the
whereabouts-reconcilerdaemon set deployed successfully by running the following command:$ oc get all -n openshift-multus | grep whereabouts-reconcilerpod/whereabouts-reconciler-jnp6g 1/1 Running 0 6s pod/whereabouts-reconciler-k76gg 1/1 Running 0 6s daemonset.apps/whereabouts-reconciler 6 6 6 6 6 kubernetes.io/os=linux 6s
17.3.4.5. Configuring the Whereabouts IP reconciler schedule
The Whereabouts IPAM CNI plugin runs the IP address reconciler daily. This process cleans up any stranded IP address allocations that might result in exhausting IP addresses and therefore prevent new pods from getting a stranded IP address allocated to them.
Use this procedure to change the frequency at which the IP reconciler runs.
Prerequisites
-
You installed the OpenShift CLI (
oc). -
You have access to the cluster as a user with the
cluster-adminrole. -
You have deployed the
whereabouts-reconcilerdaemon set, and thewhereabouts-reconcilerpods are up and running.
Procedure
Run the following command to create a
ConfigMapobject namedwhereabouts-configin theopenshift-multusnamespace with a specific cron expression for the IP reconciler:$ oc create configmap whereabouts-config -n openshift-multus --from-literal=reconciler_cron_expression="*/15 * * * *"This cron expression indicates the IP reconciler runs every 15 minutes. Adjust the expression based on your specific requirements.
NoteThe
whereabouts-reconcilerdaemon set can only consume a cron expression pattern that includes five asterisks. Red Hat does not support the sixth asterisk, which is used to denote seconds.Retrieve information about resources related to the
whereabouts-reconcilerdaemon set and pods within theopenshift-multusnamespace by running the following command:$ oc get all -n openshift-multus | grep whereabouts-reconcilerpod/whereabouts-reconciler-2p7hw 1/1 Running 0 4m14s pod/whereabouts-reconciler-76jk7 1/1 Running 0 4m14s daemonset.apps/whereabouts-reconciler 6 6 6 6 6 kubernetes.io/os=linux 4m16sRun the following command to verify that the
whereabouts-reconcilerpod runs the IP reconciler with the configured interval:$ oc -n openshift-multus logs whereabouts-reconciler-2p7hw2024-02-02T16:33:54Z [debug] event not relevant: "/cron-schedule/..2024_02_02_16_33_54.1375928161": CREATE 2024-02-02T16:33:54Z [debug] event not relevant: "/cron-schedule/..2024_02_02_16_33_54.1375928161": CHMOD 2024-02-02T16:33:54Z [debug] event not relevant: "/cron-schedule/..data_tmp": RENAME 2024-02-02T16:33:54Z [verbose] using expression: */15 * * * * 2024-02-02T16:33:54Z [verbose] configuration updated to file "/cron-schedule/..data". New cron expression: */15 * * * * 2024-02-02T16:33:54Z [verbose] successfully updated CRON configuration id "00c2d1c9-631d-403f-bb86-73ad104a6817" - new cron expression: */15 * * * * 2024-02-02T16:33:54Z [debug] event not relevant: "/cron-schedule/config": CREATE 2024-02-02T16:33:54Z [debug] event not relevant: "/cron-schedule/..2024_02_02_16_26_17.3874177937": REMOVE 2024-02-02T16:45:00Z [verbose] starting reconciler run 2024-02-02T16:45:00Z [debug] NewReconcileLooper - inferred connection data 2024-02-02T16:45:00Z [debug] listing IP pools 2024-02-02T16:45:00Z [debug] no IP addresses to cleanup 2024-02-02T16:45:00Z [verbose] reconciler success
17.3.4.6. Creating a configuration for assignment of dual-stack IP addresses dynamically
You can dynamically assign dual-stack IP addresses to a secondary network so that pods can communicate over both IPv4 and IPv6 addresses.
You can configure the following IP address assignment types in the ipRanges parameter:
- IPv4 addresses
- IPv6 addresses
- multiple IP address assignment
Procedure
-
Set
typetowhereabouts. Use
ipRangesto allocate IP addresses as shown in the following example:cniVersion: operator.openshift.io/v1 kind: Network metadata: name: cluster spec: additionalNetworks: - name: whereabouts-shim namespace: default type: Raw rawCNIConfig: |- { "name": "whereabouts-dual-stack", "cniVersion": "0.3.1, "type": "bridge", "ipam": { "type": "whereabouts", "ipRanges": [ {"range": "192.168.10.0/24"}, {"range": "2001:db8::/64"} ] } }- Attach the secondary network to a pod. For more information, see "Adding a pod to a secondary network".
Verification
Verify that all IP addresses got assigned to the network interfaces within the network namespace of a pod by entering the following command:
$ oc exec -it <pod_name> -- ip awhere:
<podname>- The name of the pod.
17.3.5. About configuring the master interface in the container network namespace
You can create a MAC-VLAN, an IP-VLAN, or a VLAN subinterface that is based on a master interface that exists in a container namespace. You can also create a master interface as part of the pod network configuration in a separate network attachment definition CRD.
To use a container namespace master interface, you must specify true for the linkInContainer parameter that exists in the subinterface configuration of the NetworkAttachmentDefinition CRD.
17.3.5.1. Creating multiple VLANs on SR-IOV VFs
You can create multiple VLANs based on SR-IOV VFs. For this configuration, create an SR-IOV network and then define the network attachments for the VLAN interfaces.
The following diagram shows the setup process for creating multiple VLANs on SR-IOV VFs.
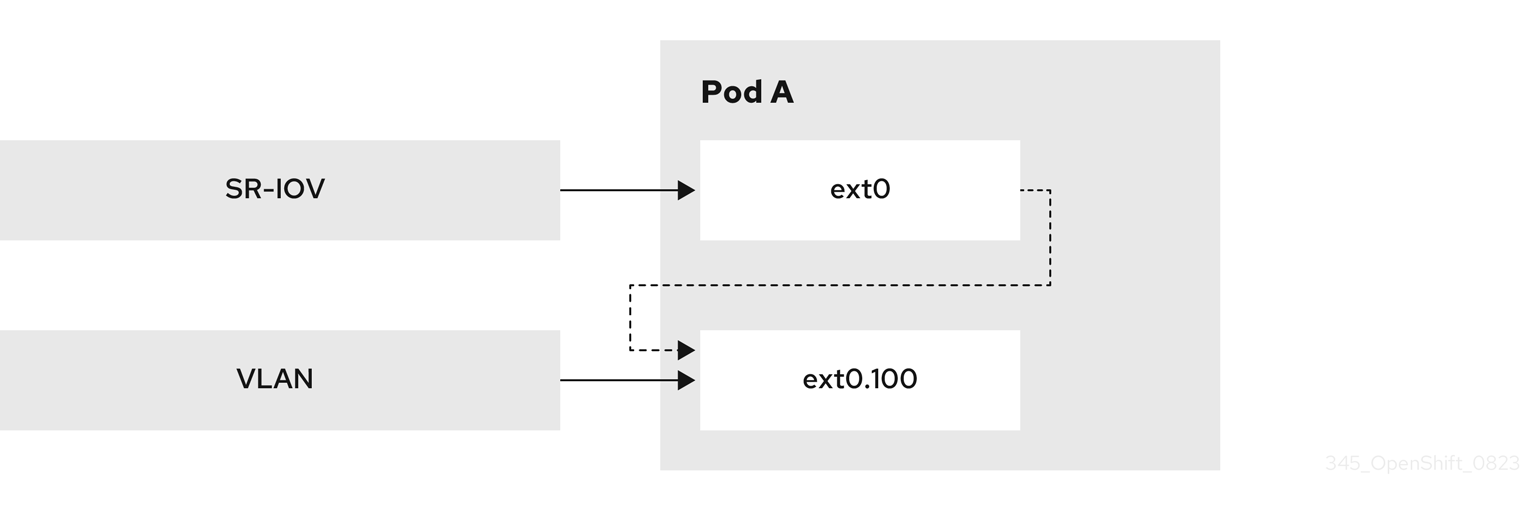
Prerequisites
-
You installed the OpenShift CLI (
oc). -
You have access to the cluster as a user with the
cluster-adminrole. - You have installed the SR-IOV Network Operator.
Procedure
Create a dedicated container namespace where you want to deploy your pod by using the following command:
$ oc new-project test-namespaceCreate an SR-IOV node policy.
Create an
SriovNetworkNodePolicyobject, and then save the YAML in thesriov-node-network-policy.yamlfile:apiVersion: sriovnetwork.openshift.io/v1 kind: SriovNetworkNodePolicy metadata: name: sriovnic namespace: openshift-sriov-network-operator spec: deviceType: netdevice isRdma: false needVhostNet: true nicSelector: vendor: "15b3" deviceID: "101b" rootDevices: ["00:05.0"] numVfs: 10 priority: 99 resourceName: sriovnic nodeSelector: feature.node.kubernetes.io/network-sriov.capable: "true"where:
vendor-
The vendor hexadecimal code of the SR-IOV network device. The value
15b3associates with a Mellanox NIC. deviceIDThe device hexadecimal code of the SR-IOV network device.
NoteThe SR-IOV network node policy configuration example, with the setting
deviceType: netdevice, is tailored specifically for Mellanox Network Interface Cards (NICs).
Apply the YAML configuration by running the following command:
$ oc apply -f sriov-node-network-policy.yamlNoteApplying the YAML configuration might take time because of a node reboot operation.
Create an SR-IOV network:
Create the
SriovNetworkcustom resource (CR) for the additional secondary SR-IOV network attachment as demonstrated in the following example CR. Save the YAML as asriov-network-attachment.yamlfile:apiVersion: sriovnetwork.openshift.io/v1 kind: SriovNetwork metadata: name: sriov-network namespace: openshift-sriov-network-operator spec: networkNamespace: test-namespace resourceName: sriovnic spoofChk: "off" trust: "on"Apply the YAML by running the following command:
$ oc apply -f sriov-network-attachment.yaml
Create the VLAN secondary network.
Using the following YAML example, create a file named
vlan100-additional-network-configuration.yaml:apiVersion: k8s.cni.cncf.io/v1 kind: NetworkAttachmentDefinition metadata: name: vlan-100 namespace: test-namespace spec: config: | { "cniVersion": "0.4.0", "name": "vlan-100", "plugins": [ { "type": "vlan", "master": "ext0", "mtu": 1500, "vlanId": 100, "linkInContainer": true, "ipam": {"type": "whereabouts", "ipRanges": [{"range": "1.1.1.0/24"}]} } ] }where:
master-
The VLAN configuration needs to specify the
mastername. You can specify the name in the networks annotation of a pod. linkInContainer-
The
linkInContainerparameter must be specified.
Apply the YAML file by running the following command:
$ oc apply -f vlan100-additional-network-configuration.yaml
Create a pod definition by using the earlier specified networks.
Using the following YAML configuration example, create a file named
pod-a.yamlfile:NoteThe manifest example includes the following resources:
- Namespace with security labels
- Pod definition with appropriate network annotation
apiVersion: v1 kind: Namespace metadata: name: test-namespace labels: pod-security.kubernetes.io/enforce: privileged pod-security.kubernetes.io/audit: privileged pod-security.kubernetes.io/warn: privileged security.openshift.io/scc.podSecurityLabelSync: "false" --- apiVersion: v1 kind: Pod metadata: name: nginx-pod namespace: test-namespace annotations: k8s.v1.cni.cncf.io/networks: '[ { "name": "sriov-network", "namespace": "test-namespace", "interface": "ext0" }, { "name": "vlan-100", "namespace": "test-namespace", "interface": "ext0.100" } ]' spec: securityContext: runAsNonRoot: true containers: - name: nginx-container image: nginxinc/nginx-unprivileged:latest securityContext: allowPrivilegeEscalation: false capabilities: drop: ["ALL"] ports: - containerPort: 80 seccompProfile: type: "RuntimeDefault"where:
interface-
The name to be used as the
masterinterface for the VLAN interface.
Apply the YAML file by running the following command:
$ oc apply -f pod-a.yaml
Get detailed information about the
nginx-podwithin thetest-namespaceby running the following command:$ oc describe pods nginx-pod -n test-namespaceName: nginx-pod Namespace: test-namespace Priority: 0 Node: worker-1/10.46.186.105 Start Time: Mon, 14 Aug 2023 16:23:13 -0400 Labels: <none> Annotations: k8s.ovn.org/pod-networks: {"default":{"ip_addresses":["10.131.0.26/23"],"mac_address":"0a:58:0a:83:00:1a","gateway_ips":["10.131.0.1"],"routes":[{"dest":"10.128.0.0... k8s.v1.cni.cncf.io/network-status: [{ "name": "ovn-kubernetes", "interface": "eth0", "ips": [ "10.131.0.26" ], "mac": "0a:58:0a:83:00:1a", "default": true, "dns": {} },{ "name": "test-namespace/sriov-network", "interface": "ext0", "mac": "6e:a7:5e:3f:49:1b", "dns": {}, "device-info": { "type": "pci", "version": "1.0.0", "pci": { "pci-address": "0000:d8:00.2" } } },{ "name": "test-namespace/vlan-100", "interface": "ext0.100", "ips": [ "1.1.1.1" ], "mac": "6e:a7:5e:3f:49:1b", "dns": {} }] k8s.v1.cni.cncf.io/networks: [ { "name": "sriov-network", "namespace": "test-namespace", "interface": "ext0" }, { "name": "vlan-100", "namespace": "test-namespace", "i... openshift.io/scc: privileged Status: Running IP: 10.131.0.26 IPs: IP: 10.131.0.26
17.3.5.2. Creating a subinterface based on a bridge master interface in a container namespace
You can create a subinterface based on a bridge master interface that exists in a container namespace. Creating a subinterface can be applied to other types of interfaces.
Prerequisites
-
You have installed the OpenShift CLI (
oc). -
You are logged in to the OpenShift Container Platform cluster as a user with
cluster-adminprivileges.
Procedure
Create a dedicated container namespace where you want to deploy your pod by entering the following command:
$ oc new-project test-namespaceUsing the following YAML configuration example, create a bridge
NetworkAttachmentDefinitioncustom resource definition (CRD) file namedbridge-nad.yaml:apiVersion: "k8s.cni.cncf.io/v1" kind: NetworkAttachmentDefinition metadata: name: bridge-network spec: config: '{ "cniVersion": "0.4.0", "name": "bridge-network", "type": "bridge", "bridge": "br-001", "isGateway": true, "ipMasq": true, "hairpinMode": true, "ipam": { "type": "host-local", "subnet": "10.0.0.0/24", "routes": [{"dst": "0.0.0.0/0"}] } }'Run the following command to apply the
NetworkAttachmentDefinitionCRD to your OpenShift Container Platform cluster:$ oc apply -f bridge-nad.yamlVerify that you successfully created a
NetworkAttachmentDefinitionCRD by entering the following command. The expected output shows the name of the NAD CRD and the creation age in minutes.$ oc get network-attachment-definitionsUsing the following YAML example, create a file named
ipvlan-additional-network-configuration.yamlfor the IPVLAN secondary network configuration:apiVersion: k8s.cni.cncf.io/v1 kind: NetworkAttachmentDefinition metadata: name: ipvlan-net namespace: test-namespace spec: config: '{ "cniVersion": "0.3.1", "name": "ipvlan-net", "type": "ipvlan", "master": "net1", "mode": "l3", "linkInContainer": true, "ipam": {"type": "whereabouts", "ipRanges": [{"range": "10.0.0.0/24"}]} }'where:
master- Specifies the ethernet interface to associate with the network attachment. The ethernet interface is subsequently configured in the pod networks annotation.
linkInContainer-
Specifies that the
masterinterface exists in the container network namespace.
Apply the YAML file by running the following command:
$ oc apply -f ipvlan-additional-network-configuration.yamlVerify that the
NetworkAttachmentDefinitionCRD has been created successfully by running the following command. The expected output shows the name of the NAD CRD and the creation age in minutes.$ oc get network-attachment-definitionsUsing the following YAML configuration example, create a file named
pod-a.yamlfor the pod definition:apiVersion: v1 kind: Pod metadata: name: pod-a namespace: test-namespace annotations: k8s.v1.cni.cncf.io/networks: '[ { "name": "bridge-network", "interface": "ext0"1 }, { "name": "ipvlan-net", "interface": "ext1" } ]' spec: securityContext: runAsNonRoot: true seccompProfile: type: RuntimeDefault containers: - name: test-pod image: quay.io/openshifttest/hello-sdn@sha256:c89445416459e7adea9a5a416b3365ed3d74f2491beb904d61dc8d1eb89a72a4 securityContext: allowPrivilegeEscalation: false capabilities: drop: [ALL]where:
k8s.v1.cni.cncf.io/networks,interface-
Specifies the name to be used as the
masterfor the IPVLAN interface.
Apply the YAML file by running the following command:
$ oc apply -f pod-a.yaml
Verification
Verify that the pod is running by using the following command:
$ oc get pod -n test-namespaceNAME READY STATUS RESTARTS AGE pod-a 1/1 Running 0 2m36sShow network interface information about the
pod-aresource within thetest-namespaceby running the following command:$ oc exec -n test-namespace pod-a -- ip a1: lo: <LOOPBACK,UP,LOWER_UP> mtu 65536 qdisc noqueue state UNKNOWN group default qlen 1000 link/loopback 00:00:00:00:00:00 brd 00:00:00:00:00:00 inet 127.0.0.1/8 scope host lo valid_lft forever preferred_lft forever inet6 ::1/128 scope host valid_lft forever preferred_lft forever 3: eth0@if105: <BROADCAST,MULTICAST,UP,LOWER_UP> mtu 1400 qdisc noqueue state UP group default link/ether 0a:58:0a:d9:00:5d brd ff:ff:ff:ff:ff:ff link-netnsid 0 inet 10.217.0.93/23 brd 10.217.1.255 scope global eth0 valid_lft forever preferred_lft forever inet6 fe80::488b:91ff:fe84:a94b/64 scope link valid_lft forever preferred_lft forever 4: ext0@if107: <BROADCAST,MULTICAST,UP,LOWER_UP> mtu 1500 qdisc noqueue state UP group default link/ether be:da:bd:7e:f4:37 brd ff:ff:ff:ff:ff:ff link-netnsid 0 inet 10.0.0.2/24 brd 10.0.0.255 scope global ext0 valid_lft forever preferred_lft forever inet6 fe80::bcda:bdff:fe7e:f437/64 scope link valid_lft forever preferred_lft forever 5: ext1@ext0: <BROADCAST,MULTICAST,NOARP,UP,LOWER_UP> mtu 1500 qdisc noqueue state UNKNOWN group default link/ether be:da:bd:7e:f4:37 brd ff:ff:ff:ff:ff:ff inet 10.0.0.1/24 brd 10.0.0.255 scope global ext1 valid_lft forever preferred_lft forever inet6 fe80::beda:bd00:17e:f437/64 scope link valid_lft forever preferred_lft foreverThis output shows that the network interface
net2associates with the physical interfacenet1.
17.4. Creating additional networks
You can manage additional networks in your OpenShift cluster by creating, editing, viewing, and deleting them as needed. You can extend the networking capabilities of your cluster beyond the default primary network by configuring additional networks.
17.4.1. Configuration for a primary network attachment
You configure a primary network by using the NetworkAttachmentDefinition API in the k8s.cni.cncf.io API group.
The configuration for the API is described in the following table:
| Field | Type | Description |
|---|---|---|
|
|
| The name for the primary network. |
|
|
| The namespace that the object is associated with. |
|
|
| The CNI plugin configuration in JSON format. |
17.4.2. Approaches to managing an additional network
You can manage the life cycle of a primary network created by a NAD CR through the Cluster Network Operator (CNO) or a YAML manifest. Using the CNO provides automated management of the network resource, while applying a YAML manifest allows for direct control over the network configuration.
- Modifying the Cluster Network Operator (CNO) configuration
-
With this method, the CNO automatically creates and manages the
NetworkAttachmentDefinitionobject. In addition to managing the object lifecycle, the CNO ensures that a DHCP is available for a primary network that uses a DHCP assigned IP address. - Applying a YAML manifest
-
With this method, you can manage the primary network directly by creating an
NetworkAttachmentDefinitionobject. This approach allows for the invocation of multiple CNI plugins in order to attach primary network interfaces in a pod.
Each approach is mutually exclusive and you can only use one approach for managing a primary network at a time. For either approach, the primary network is managed by a Container Network Interface (CNI) plugin that you configure.
When deploying OpenShift Container Platform nodes with multiple network interfaces on Red Hat OpenStack Platform (RHOSP) with OVN SDN, DNS configuration of the secondary interface might take precedence over the DNS configuration of the primary interface. In this case, remove the DNS nameservers for the subnet ID that is attached to the secondary interface by running the following command:
$ openstack subnet set --dns-nameserver 0.0.0.0 <subnet_id>17.4.3. Creating an additional network attachment with the Cluster Network Operator
When you specify a primary network to create by using the Cluster Network Operator (CNO), the (CNO) creates the NetworkAttachmentDefinition custom resource definition (CRD) automatically and manages it.
The Cluster Network Operator (CNO) manages additional network definitions. When you specify a primary network to create, the CNO creates the NetworkAttachmentDefinition custom resource definition (CRD) automatically.
Do not edit the NetworkAttachmentDefinition CRDs that the Cluster Network Operator manages. Doing so might disrupt network traffic on your additional network.
Prerequisites
-
Install the OpenShift CLI (
oc). -
Log in as a user with
cluster-adminprivileges.
Procedure
Optional: Create the namespace for the additional networks:
$ oc create namespace <namespace_name>To edit the CNO configuration, enter the following command:
$ oc edit networks.operator.openshift.io clusterModify the CR that you are creating by adding the configuration for the additional network that you are creating, as in the following example CR.
apiVersion: operator.openshift.io/v1 kind: Network metadata: name: cluster spec: # ... additionalNetworks: - name: tertiary-net namespace: namespace2 type: Raw rawCNIConfig: |- { "cniVersion": "0.3.1", "name": "tertiary-net", "type": "ipvlan", "master": "eth1", "mode": "l2", "ipam": { "type": "static", "addresses": [ { "address": "192.168.1.23/24" } ] } }- Save your changes and quit the text editor to commit your changes.
Verification
Confirm that the CNO created the
NetworkAttachmentDefinitionCRD by running the following command. A delay might exist before the CNO creates the CRD. The expected output shows the name of the NAD CRD and the creation age in minutes.$ oc get network-attachment-definitions -n <namespace>where:
<namespace>- Specifies the namespace for the network attachment that you added to the CNO configuration.
17.4.4. Creating an additional network attachment by applying a YAML manifest
Create a primary network attachment by directly applying a NetworkAttachmentDefinition YAML manifest. This gives you full control over the network configuration without relying on the Cluster Network Operator to manage the resource automatically.
Prerequisites
-
Install the OpenShift CLI (
oc). -
Log in as a user with
cluster-adminprivileges.
Procedure
Create a YAML file with your additional network configuration, such as in the following example:
apiVersion: k8s.cni.cncf.io/v1 kind: NetworkAttachmentDefinition metadata: name: next-net spec: config: |- { "cniVersion": "0.3.1", "name": "work-network", "type": "host-device", "device": "eth1", "ipam": { "type": "dhcp" } }To create the additional network, enter the following command:
$ oc apply -f <file>.yamlwhere:
<file>- Specifies the name of the file contained the YAML manifest.
17.4.5. IP address assignment for additional networks
For additional networks, you can assign IP addresses by using an IP Address Management (IPAM) CNI plugin, which supports various assignment methods, including Dynamic Host Configuration Protocol (DHCP) and static assignment.
The DHCP IPAM CNI plugin responsible for dynamic assignment of IP addresses operates with two distinct components:
- CNI Plugin: Responsible for integrating with the Kubernetes networking stack to request and release IP addresses.
- DHCP IPAM CNI Daemon: A listener for DHCP events that coordinates with existing DHCP servers in the environment to handle IP address assignment requests. This daemon is not a DHCP server itself.
For networks requiring type: dhcp in their IPAM configuration, ensure the following:
- A DHCP server is available and running in the environment. The DHCP server is external to the cluster and is expected to be part of the customer’s existing network infrastructure.
- The DHCP server is appropriately configured to serve IP addresses to the nodes.
In cases where a DHCP server is unavailable in the environment, it is recommended to use the Whereabouts IPAM CNI plugin instead. The Whereabouts CNI provides similar IP address management capabilities without the need for an external DHCP server.
Use the Whereabouts CNI plugin when there is no external DHCP server or where static IP address management is preferred. The Whereabouts plugin includes a reconciler daemon to manage stale IP address allocations.
A DHCP lease must be periodically renewed throughout the container’s lifetime, so a separate daemon, the DHCP IPAM CNI Daemon, is required. To deploy the DHCP IPAM CNI daemon, modify the Cluster Network Operator (CNO) configuration to trigger the deployment of this daemon as part of the additional network setup.
17.4.6. Configuration for an OVN-Kubernetes additional network
The Red Hat OpenShift Networking OVN-Kubernetes network plugin allows the configuration of secondary network interfaces for pods. To configure secondary network interfaces, you must define the configurations in the NetworkAttachmentDefinition custom resource definition (CRD).
Pod and multi-network policy creation might remain in a pending state until the OVN-Kubernetes control plane agent in the nodes processes the associated network-attachment-definition CRD.
You must install the NMState Operator before using the OVN-Kubernetes network plugin to configure secondary network interfaces.
You can configure an OVN-Kubernetes additional network in either layer 2 or localnet topologies.
- A layer 2 topology supports east-west cluster traffic, but does not allow access to the underlying physical network.
- A localnet topology allows connections to the physical network, but requires additional configuration of the underlying Open vSwitch (OVS) bridge on cluster nodes.
The following sections provide example configurations for each of the topologies that OVN-Kubernetes currently allows for secondary networks.
Networks names must be unique. For example, creating multiple NetworkAttachmentDefinition CRDs with different configurations that reference the same network is unsupported.
17.4.6.1. Supported platforms for OVN-Kubernetes additional network
You can use an OVN-Kubernetes additional network with the following supported platforms:
- Bare metal
- IBM Power®
- IBM Z®
- IBM® LinuxONE
- VMware vSphere
- Red Hat OpenStack Platform (RHOSP)
17.4.6.2. OVN-Kubernetes network plugin JSON configuration table
The OVN-Kubernetes network plugin JSON configuration object describes the configuration parameters for the OVN-Kubernetes CNI network plugin. The following table details these parameters:
| Field | Type | Description |
|---|---|---|
|
|
|
The CNI specification version. The required value is |
|
|
|
The name of the network. These networks are not namespaced. For example, a network named |
|
|
|
The name of the CNI plugin to configure. This value must be set to |
|
|
|
The topological configuration for the network. Must be one of |
|
|
| The subnet to use for the network across the cluster.
For When omitted, the logical switch implementing the network only provides layer 2 communication, and users must configure IP addresses for the pods. Port security only prevents MAC spoofing. |
|
|
| The maximum transmission unit (MTU). If you do not set a value, the Cluster Network Operator (CNO) sets a default MTU value by calculating the difference among the underlay MTU of the primary network interface, the overlay MTU of the pod network, such as the Geneve (Generic Network Virtualization Encapsulation), and byte capacity of any enabled features, such as IPsec. |
|
|
|
The metadata |
|
|
| A comma-separated list of CIDRs and IP addresses. IP addresses are removed from the assignable IP address pool and are never passed to the pods. |
|
|
|
If topology is set to |
17.4.6.3. Compatibility with multi-network policy
When defining a network policy, the network policy rules that can be used depend on whether the OVN-Kubernetes secondary network defines the subnets field.
The multi-network policy API, which is provided by the MultiNetworkPolicy custom resource definition (CRD) in the k8s.cni.cncf.io API group, is compatible with an OVN-Kubernetes secondary network.
Refer to the following table that details supported multi-network policy selectors that are based on a subnets CNI configuration:
subnets field specified | Allowed multi-network policy selectors |
|---|---|
| Yes |
|
| No |
|
You can use the k8s.v1.cni.cncf.io/policy-for annotation on a MultiNetworkPolicy object to point to a NetworkAttachmentDefinition (NAD) custom resource (CR). The NAD CR defines the network to which the policy applies. The following example multi-network policy that uses a pod selector is valid only if the subnets field is defined in the secondary network CNI configuration for the secondary network named blue2:
apiVersion: k8s.cni.cncf.io/v1beta1
kind: MultiNetworkPolicy
metadata:
name: allow-same-namespace
annotations:
k8s.v1.cni.cncf.io/policy-for: blue2
spec:
podSelector:
ingress:
- from:
- podSelector: {}
The following example uses the ipBlock network multi-network policy that is always valid for an OVN-Kubernetes secondary network:
Example multi-network policy that uses an IP block selector
apiVersion: k8s.cni.cncf.io/v1beta1
kind: MultiNetworkPolicy
metadata:
name: ingress-ipblock
annotations:
k8s.v1.cni.cncf.io/policy-for: default/flatl2net
spec:
podSelector:
matchLabels:
name: access-control
policyTypes:
- Ingress
ingress:
- from:
- ipBlock:
cidr: 10.200.0.0/3017.4.6.4. Configuration for a localnet switched topology
The switched localnet topology interconnects the workloads created as Network Attachment Definitions (NADs) through a cluster-wide logical switch to a physical network.
You must map a secondary network to the OVS bridge to use it as an OVN-Kubernetes secondary network. Bridge mappings allow network traffic to reach the physical network. A bridge mapping associates a physical network name, also known as an interface label, to a bridge created with Open vSwitch (OVS).
You can create an NodeNetworkConfigurationPolicy (NNCP) object, part of the nmstate.io/v1 API group, to declaratively create the mapping. This API is provided by the NMState Operator. By using this API you can apply the bridge mapping to nodes that match your specified nodeSelector expression, such as node-role.kubernetes.io/worker: ''. With this declarative approach, the NMState Operator applies additional network configuration to all nodes specified by the node selector automatically and transparently.
When attaching an additional network, you can either use the existing br-ex bridge or create a new bridge. Which approach to use depends on your specific network infrastructure. Consider the following approaches:
-
If your nodes include only a single network interface, you must use the existing bridge. This network interface is owned and managed by OVN-Kubernetes and you must not remove it from the
br-exbridge or alter the interface configuration. If you remove or alter the network interface, your cluster network stops working correctly. - If your nodes include several network interfaces, you can attach a different network interface to a new bridge, and use that for your secondary network. This approach provides for traffic isolation from your primary cluster network.
You cannot make configuration changes to the br-ex bridge or its underlying interfaces in the NodeNetworkConfigurationPolicy (NNCP) resource as a postinstallation task. As a workaround, use a secondary network interface connected to your host or switch.
The localnet1 network is mapped to the br-ex bridge in the following sharing-a-bridge example:
apiVersion: nmstate.io/v1
kind: NodeNetworkConfigurationPolicy
metadata:
name: mapping
spec:
nodeSelector:
node-role.kubernetes.io/worker: ''
desiredState:
ovn:
bridge-mappings:
- localnet: localnet1
bridge: br-ex
state: presentwhere:
metadata.name- The name for the configuration object.
spec.nodeSelector.node-role.kubernetes.io/worker- A node selector that specifies the nodes to apply the node network configuration policy to.
spec.desiredState.ovn.bridge-mappings.localnet-
The name for the secondary network from which traffic is forwarded to the OVS bridge. This secondary network must match the name of the
spec.config.namefield of theNetworkAttachmentDefinitionCRD that defines the OVN-Kubernetes secondary network. spec.desiredState.ovn.bridge-mappings.bridge-
The name of the OVS bridge on the node. This value is required only if you specify
state: present. spec.desiredState.ovn.bridge-mappings.state-
The state for the mapping. Must be either
presentto add the bridge orabsentto remove the bridge. The default value ispresent.
The following JSON example configures a localnet secondary network that is named localnet1. Note that the value for the mtu parameter must match the MTU value that was set for the secondary network interface that is mapped to the br-ex bridge interface.
{
"cniVersion": "0.3.1",
"name": "localnet1",
"type": "ovn-k8s-cni-overlay",
"topology":"localnet",
"physicalNetworkName": "localnet1",
"subnets": "202.10.130.112/28",
"vlanID": 33,
"mtu": 1500,
"netAttachDefName": "ns1/localnet-network",
"excludeSubnets": "10.100.200.0/29"
}
In the following multiple interfaces example, the localnet2 network interface is attached to the ovs-br1 bridge. Through this attachment, the network interface is available to the OVN-Kubernetes network plugin as a secondary network.
apiVersion: nmstate.io/v1
kind: NodeNetworkConfigurationPolicy
metadata:
name: ovs-br1-multiple-networks
spec:
nodeSelector:
node-role.kubernetes.io/worker: ''
desiredState:
interfaces:
- name: ovs-br1
description: |-
A dedicated OVS bridge with eth1 as a port
allowing all VLANs and untagged traffic
type: ovs-bridge
state: up
bridge:
allow-extra-patch-ports: true
options:
stp: false
mcast-snooping-enable: true
port:
- name: eth1
ovn:
bridge-mappings:
- localnet: localnet2
bridge: ovs-br1
state: presentwhere:
metadata.name- Specifies the name of the configuration object.
node-role.kubernetes.io/worker- Specifies a node selector that identifies the nodes to which the node network configuration policy applies.
desiredState.interfaces.name- Specifies a new OVS bridge that operates separately from the default bridge used by OVN-Kubernetes for cluster traffic.
options.mcast-snooping-enable-
Specifies whether to enable multicast snooping. When enabled, multicast snooping prevents network devices from flooding multicast traffic to all network members. By default, an OVS bridge does not enable multicast snooping. The default value is
false. bridge.port.name- Specifies the network device on the host system to associate with the new OVS bridge.
ovn.bridge-mappings.localnet-
Specifies the name of the secondary network that forwards traffic to the OVS bridge. This name must match the value of the
spec.config.namefield in theNetworkAttachmentDefinitionCRD that defines the OVN-Kubernetes secondary network. ovn.bridge-mappings.bridge-
Specifies the name of the OVS bridge on the node. The value is required only when
state: presentis set. ovn.bridge-mappings.state-
Specifies the state of the mapping. Valid values are
presentto add the bridge orabsentto remove the bridge. The default value ispresent.
The following JSON example configures a localnet secondary network that is named localnet2. Note that the value for the mtu parameter must match the MTU value that was set for the eth1 secondary network interface.
{
"cniVersion": "0.3.1",
"name": "localnet2",
"type": "ovn-k8s-cni-overlay",
"topology":"localnet",
"physicalNetworkName": "localnet2",
"subnets": "202.10.130.112/28",
"vlanID": 33,
"mtu": 1500,
"netAttachDefName": "ns1/localnet-network"
"excludeSubnets": "10.100.200.0/29"
}17.4.6.4.1. Configuring pods for additional networks
You must specify the secondary network attachments through the k8s.v1.cni.cncf.io/networks annotation.
The following example provisions a pod with two secondary attachments, one for each of the attachment configurations presented in this guide:
apiVersion: v1
kind: Pod
metadata:
annotations:
k8s.v1.cni.cncf.io/networks: l2-network
name: tinypod
namespace: ns1
spec:
containers:
- args:
- pause
image: k8s.gcr.io/e2e-test-images/agnhost:2.36
imagePullPolicy: IfNotPresent
name: agnhost-container17.4.6.4.2. Configuring pods with a static IP address
You can configure pods with a static IP address. The example in the procedure provisions a pod with a static IP address.
- You can only specify the IP address for a pod’s secondary network attachment for layer 2 attachments.
- Specifying a static IP address for the pod is only possible when the attachment configuration does not feature subnets.
apiVersion: v1
kind: Pod
metadata:
annotations:
k8s.v1.cni.cncf.io/networks: '[
{
"name": "l2-network",
"mac": "02:03:04:05:06:07",
"interface": "myiface1",
"ips": [
"192.0.2.20/24"
]
}
]'
name: tinypod
namespace: ns1
spec:
containers:
- args:
- pause
image: k8s.gcr.io/e2e-test-images/agnhost:2.36
imagePullPolicy: IfNotPresent
name: agnhost-containerwhere:
k8s.v1.cni.cncf.io/networks.name-
The name of the network. This value must be unique across all
NetworkAttachmentDefinitionCRDs. k8s.v1.cni.cncf.io/networks.mac- The MAC address to be assigned for the interface.
k8s.v1.cni.cncf.io/networks.interface- The name of the network interface to be created for the pod.
k8s.v1.cni.cncf.io/networks.ips- The IP addresses to be assigned to the network interface.
17.5. About virtual routing and forwarding
17.5.1. About virtual routing and forwarding
You can use virtual routing and forwarding (VRF) to provide multi-tenancy functionality. For example, where each tenant has its own unique routing tables and requires different default gateways.
VRF reduces the number of permissions needed by cloud-native network function (CNF), and provides increased visibility of the network topology of secondary networks. VRF devices combined with IP address rules provide the ability to create virtual routing and forwarding domains.
Processes can bind a socket to the VRF device. Packets through the binded socket use the routing table associated with the VRF device. An important feature of VRF is that it impacts only OSI model layer 3 traffic and above so L2 tools, such as LLDP, are not affected. This allows higher priority IP address rules such as policy based routing to take precedence over the VRF device rules directing specific traffic.
17.5.1.1. Benefits of secondary networks for pods for telecommunications operators
You can connect network functions to different customers' infrastructure by using the same IP address with the Container Network Interface (CNI) virtual routing and forwarding (VRF) plugin. Using the CNI VRF plugin keeps different customers isolated.
In telecommunications use cases, each CNF can potentially be connected to many different networks sharing the same address space. These secondary networks can potentially conflict with the cluster’s main network CIDR.
With the CNI VRF plugin, IP addresses are overlapped with the OpenShift Container Platform IP address space. The CNI VRF plugin also reduces the number of permissions needed by CNF and increases the visibility of the network topologies of secondary networks.
17.6. Configuring multi-network policy
As a cluster administrator, you can configure a multi-network policy for a Single-Root I/O Virtualization (SR-IOV), MAC Virtual Local Area Network (MacVLAN), or OVN-Kubernetes additional networks.
MacVLAN additional networks are fully supported. Other types of additional networks, such as IP Virtual Local Area Network (IPVLAN), are not supported.
Support for configuring multi-network policies for SR-IOV additional networks is only supported with kernel network interface controllers (NICs). SR-IOV is not supported for Data Plane Development Kit (DPDK) applications.
17.6.1. Differences between multi-network policy and network policy
Although the MultiNetworkPolicy API implements the NetworkPolicy API, ensure that you understand the following key differences between the two policies:
You must use the
MultiNetworkPolicyAPI, as demonstrated in the following example configuration:apiVersion: k8s.cni.cncf.io/v1beta1 kind: MultiNetworkPolicy # ...-
You must use the
multi-networkpolicyresource name when using the CLI to interact with multi-network policies. For example, you can view a multi-network policy object with theoc get multi-networkpolicy <name>command where<name>is the name of a multi-network policy. You can use the
k8s.v1.cni.cncf.io/policy-forannotation on aMultiNetworkPolicyobject to point to aNetworkAttachmentDefinition(NAD) custom resource (CR). The NAD CR defines the network to which the policy applies. The following example multi-network policy includes thek8s.v1.cni.cncf.io/policy-forannotation:apiVersion: k8s.cni.cncf.io/v1beta1 kind: MultiNetworkPolicy metadata: annotations: k8s.v1.cni.cncf.io/policy-for:<namespace_name>/<network_name> # ...where:
<namespace_name>- Specifies the namespace name.
<network_name>- Specifies the name of a network attachment definition.
17.6.2. Enabling multi-network policy for the cluster
As a cluster administrator, you can enable multi-network policy support on your cluster.
Prerequisites
-
Install the OpenShift CLI (
oc). -
Log in to the cluster with a user with
cluster-adminprivileges.
Procedure
Create the
multinetwork-enable-patch.yamlfile with the following YAML:apiVersion: operator.openshift.io/v1 kind: Network metadata: name: cluster spec: useMultiNetworkPolicy: true # ...Configure the cluster to enable multi-network policy. Successful output lists the name of the policy object and the
patchedstatus.$ oc patch network.operator.openshift.io cluster --type=merge --patch-file=multinetwork-enable-patch.yaml
17.6.3. Supporting multi-network policies in IPv6 networks
The ICMPv6 Neighbor Discovery Protocol (NDP) is a set of messages and processes that enable devices to discover and maintain information about neighboring nodes. NDP plays a crucial role in IPv6 networks, facilitating the interaction between devices on the same link.
The Cluster Network Operator (CNO) deploys the iptables implementation of multi-network policy when the useMultiNetworkPolicy parameter is set to true.
To support multi-network policies in IPv6 networks the Cluster Network Operator deploys the following set of custom rules in every pod affected by a multi-network policy:
kind: ConfigMap
apiVersion: v1
metadata:
name: multi-networkpolicy-custom-rules
namespace: openshift-multus
data:
custom-v6-rules.txt: |
# accept NDP
-p icmpv6 --icmpv6-type neighbor-solicitation -j ACCEPT
-p icmpv6 --icmpv6-type neighbor-advertisement -j ACCEPT
# accept RA/RS
-p icmpv6 --icmpv6-type router-solicitation -j ACCEPT
-p icmpv6 --icmpv6-type router-advertisement -j ACCEPTwhere:
icmpv6-type neighbor-solicitation- This rule allows incoming ICMPv6 neighbor solicitation messages, which are part of the neighbor discovery protocol (NDP). These messages help determine the link-layer addresses of neighboring nodes.
icmpv6-type neighbor-advertisement- This rule allows incoming ICMPv6 neighbor advertisement messages, which are part of NDP and provide information about the link-layer address of the sender.
icmpv6-type router-solicitation- This rule permits incoming ICMPv6 router solicitation messages. Hosts use these messages to request router configuration information.
icmpv6-type router-advertisement- This rule allows incoming ICMPv6 router advertisement messages, which give configuration information to hosts.
You cannot edit the predefined rules.
The rules collectively enable essential ICMPv6 traffic for correct network functioning, including address resolution and router communication in an IPv6 environment. With these rules in place and a multi-network policy denying traffic, applications are not expected to experience connectivity issues.
17.6.3.1. Creating a multi-network policy using the CLI
To define granular rules describing ingress or egress network traffic allowed for namespaces in your cluster, you can create a multi-network policy.
Prerequisites
-
Your cluster uses a network plugin that supports
NetworkPolicyobjects, such as the OVN-Kubernetes network plugin or the OpenShift SDN network plugin withmode: NetworkPolicyset. This mode is the default for OpenShift SDN. - You have enabled multi-network policy support for your cluster.
-
You installed the OpenShift CLI (
oc). -
You logged in to the cluster with a user with
cluster-adminprivileges. - You are working in the namespace that the multi-network policy applies to.
Procedure
Create a policy rule.
Create a
<policy_name>.yamlfile:$ touch <policy_name>.yamlwhere:
<policy_name>- Specifies the multi-network policy file name.
Define a multi-network policy in the created file. The following example denies ingress traffic from all pods in all namespaces. This is a fundamental policy, blocking all cross-pod networking other than cross-pod traffic allowed by the configuration of other Network Policies.
apiVersion: k8s.cni.cncf.io/v1beta1 kind: MultiNetworkPolicy metadata: name: deny-by-default annotations: k8s.v1.cni.cncf.io/policy-for:<namespace_name>/<network_name> spec: podSelector: {} policyTypes: - Ingress ingress: []where:
<network_name>Specifies the name of a network attachment definition.
The following example configuration allows ingress traffic from all pods in the same namespace:
apiVersion: k8s.cni.cncf.io/v1beta1 kind: MultiNetworkPolicy metadata: name: allow-same-namespace annotations: k8s.v1.cni.cncf.io/policy-for:<namespace_name>/<network_name> spec: podSelector: ingress: - from: - podSelector: {} # ...where:
<network_name>Specifies the name of a network attachment definition.
The following example allows ingress traffic to one pod from a particular namespace. This policy allows traffic to pods that have the
pod-alabel from pods running innamespace-y.apiVersion: k8s.cni.cncf.io/v1beta1 kind: MultiNetworkPolicy metadata: name: allow-traffic-pod annotations: k8s.v1.cni.cncf.io/policy-for:<namespace_name>/<network_name> spec: podSelector: matchLabels: pod: pod-a policyTypes: - Ingress ingress: - from: - namespaceSelector: matchLabels: kubernetes.io/metadata.name: namespace-y # ...where:
<network_name>Specifies the name of a network attachment definition.
The following example configuration restricts traffic to a service. This policy when applied ensures every pod with both labels
app=bookstoreandrole=apican only be accessed by pods with labelapp=bookstore. In this example the application could be a REST API server, marked with labelsapp=bookstoreandrole=api.This example configuration addresses the following use cases:
- Restricting the traffic to a service to only the other microservices that need to use it.
Restricting the connections to a database to only permit the application using it.
apiVersion: k8s.cni.cncf.io/v1beta1 kind: MultiNetworkPolicy metadata: name: api-allow annotations: k8s.v1.cni.cncf.io/policy-for:<namespace_name>/<network_name> spec: podSelector: matchLabels: app: bookstore role: api ingress: - from: - podSelector: matchLabels: app: bookstore # ...where:
<network_name>- Specifies the name of a network attachment definition.
To create the multi-network policy object, enter the following command. Successful output lists the name of the policy object and the
createdstatus.$ oc apply -f <policy_name>.yaml -n <namespace>where:
<policy_name>- Specifies the multi-network policy file name.
<namespace>- Optional parameter. If you defined the object in a different namespace than the current namespace, the parameter specifices the namespace.
Successful output lists the name of the policy object and the
createdstatus.NoteIf you log in to the web console with
cluster-adminprivileges, you have a choice of creating a network policy in any namespace in the cluster directly in YAML or from a form in the web console.
17.6.3.2. Editing a multi-network policy
To modify existing policy configurations, you can edit a multi-network policy in a namespace. Edit policies by modifying the policy file and applying it with oc apply, or by using the oc edit command directly.
If you log in with cluster-admin privileges, you can edit network policies in any namespace in the cluster. In the web console, you can edit policies directly in YAML or by using the Actions menu.
Prerequisites
-
Your cluster uses a network plugin that supports
NetworkPolicyobjects, such as the OVN-Kubernetes network plugin or the OpenShift SDN network plugin withmode: NetworkPolicyset. This mode is the default for OpenShift SDN. -
You installed the OpenShift CLI (
oc). -
You are logged in to the cluster with a user with
cluster-adminprivileges. - You are working in the namespace where the multi-network policy exists.
Procedure
Optional: To list the multi-network policy objects in a namespace, enter the following command:
$ oc get multi-network policy -n <namespace>where:
<namespace>- Optional: Specifies the namespace if the object is defined in a different namespace than the current namespace.
Edit the multi-network policy object.
If you saved the multi-network policy definition in a file, edit the file and make any necessary changes, and then enter the following command.
$ oc apply -n <namespace> -f <policy_file>.yamlwhere:
<namespace>- Optional: Specifies the namespace if the object is defined in a different namespace than the current namespace.
<policy_file>- Specifies the name of the file containing the network policy.
If you need to update the multi-network policy object directly, enter the following command:
$ oc edit multi-network policy <policy_name> -n <namespace>where:
<policy_name>- Specifies the name of the network policy.
<namespace>- Optional: Specifies the namespace if the object is defined in a different namespace than the current namespace.
Confirm that the multi-network policy object is updated.
$ oc describe multi-networkpolicy <policy_name> -n <namespace>where:
<policy_name>- Specifies the name of the multi-network policy.
<namespace>- Optional: Specifies the namespace if the object is defined in a different namespace than the current namespace.
17.6.3.3. Viewing multi-network policies using the CLI
You can examine the multi-network policies in a namespace.
If you log in with cluster-admin privileges, you can edit network policies in any namespace in the cluster. In the web console, you can edit policies directly in YAML or by using the Actions menu.
Prerequisites
-
You installed the OpenShift CLI (
oc). -
You are logged in to the cluster with a user with
cluster-adminprivileges. - You are working in the namespace where the multi-network policy exists.
Procedure
List multi-network policies in a namespace.
To view multi-network policy objects defined in a namespace enter the following command:
$ oc get multi-networkpolicyOptional: To examine a specific multi-network policy enter the following command:
$ oc describe multi-networkpolicy <policy_name> -n <namespace>where:
<policy_name>- Specifies the name of the multi-network policy to inspect.
<namespace>- Optional: Specifies the namespace if the object is defined in a different namespace than the current namespace.
17.6.3.4. Deleting a multi-network policy using the CLI
You can delete a multi-network policy in a namespace.
If you log in with cluster-admin privileges, you can delete network policies in any namespace in the cluster. In the web console, you can delete policies directly in YAML or by using the Actions menu.
Prerequisites
-
Your cluster uses a network plugin that supports
NetworkPolicyobjects, such as the OVN-Kubernetes network plugin or the OpenShift SDN network plugin withmode: NetworkPolicyset. This mode is the default for OpenShift SDN. -
You installed the OpenShift CLI (
oc). -
You logged in to the cluster with a user with
cluster-adminprivileges. - You are working in the namespace where the multi-network policy exists.
Procedure
To delete a multi-network policy object, enter the following command. Successful output lists the name of the policy object and the
deletedstatus.$ oc delete multi-networkpolicy <policy_name> -n <namespace>where:
<policy_name>- Specifies the name of the multi-network policy.
<namespace>- Optional parameter. If you defined the object in a different namespace than the current namespace, the parameter specifices the namespace.
17.6.3.5. Creating a default deny all multi-network policy
The default deny all multi-network policy blocks all cross-pod networking other than network traffic allowed by the configuration of other deployed network policies and traffic between host-networked pods. This procedure enforces a strong deny policy by applying a deny-by-default policy in the my-project namespace.
Without configuring a NetworkPolicy custom resource (CR) that allows traffic communication, the following policy might cause communication problems across your cluster.
Prerequisites
-
Your cluster uses a network plugin that supports
NetworkPolicyobjects, such as the OVN-Kubernetes network plugin or the OpenShift SDN network plugin withmode: NetworkPolicyset. This mode is the default for OpenShift SDN. -
You installed the OpenShift CLI (
oc). -
You logged in to the cluster with a user with
cluster-adminprivileges. - You are working in the namespace that the multi-network policy applies to.
Procedure
Create the following YAML that defines a
deny-by-defaultpolicy to deny ingress from all pods in all namespaces. Save the YAML in thedeny-by-default.yamlfile:apiVersion: k8s.cni.cncf.io/v1beta1 kind: MultiNetworkPolicy metadata: name: deny-by-default namespace: my-project annotations: k8s.v1.cni.cncf.io/policy-for:<namespace_name>/<network_name> spec: podSelector: {} policyTypes: - Ingress ingress: []where:
namespace-
Specifies the namespace in which to deploy the policy. For example, the
my-projectnamespace. annotations- Specifies the name of namespace project followed by the network attachment definition name.
podSelector-
If this field is empty, the configuration matches all the pods. Therefore, the policy applies to all pods in the
my-projectnamespace. policyTypes-
Specifies a list of rule types that the
NetworkPolicyrelates to. - Ingress-
Specifies
IngressonlypolicyTypes. ingress- Specifies ingress rules. If not specified, all incoming traffic is dropped to all pods.
Apply the policy by entering the following command. Successful output lists the name of the policy object and the
createdstatus.$ oc apply -f deny-by-default.yaml
17.6.3.6. Creating a multi-network policy to allow traffic from external clients
With the deny-by-default policy in place you can proceed to configure a policy that allows traffic from external clients to a pod with the label app=web.
If you log in with a user with the cluster-admin role, then you can create a network policy in any namespace in the cluster.
Follow this procedure to configure a policy that allows external service from the public Internet directly or by using a Load Balancer to access the pod. Traffic is only allowed to a pod with the label app=web.
Prerequisites
-
Your cluster uses a network plugin that supports
NetworkPolicyobjects, such as the OVN-Kubernetes network plugin or the OpenShift SDN network plugin withmode: NetworkPolicyset. This mode is the default for OpenShift SDN. -
You installed the OpenShift CLI (
oc). -
You logged in to the cluster with a user with
cluster-adminprivileges. - You are working in the namespace that the multi-network policy applies to.
Procedure
Create a policy that allows traffic from the public Internet directly or by using a load balancer to access the pod. Save the YAML in the
web-allow-external.yamlfile:apiVersion: k8s.cni.cncf.io/v1beta1 kind: MultiNetworkPolicy metadata: name: web-allow-external namespace: default annotations: k8s.v1.cni.cncf.io/policy-for:<namespace_name>/<network_name> spec: policyTypes: - Ingress podSelector: matchLabels: app: web ingress: - {}Apply the policy by entering the following command. Successful output lists the name of the policy object and the
createdstatus.$ oc apply -f web-allow-external.yamlThis policy allows traffic from all resources, including external traffic as illustrated in the following diagram:
17.6.3.7. Creating a multi-network policy allowing traffic to an application from all namespaces
You can configure a policy that allows traffic from all pods in all namespaces to a particular application.
If you log in with a user with the cluster-admin role, then you can create a network policy in any namespace in the cluster.
Prerequisites
-
Your cluster uses a network plugin that supports
NetworkPolicyobjects, such as the OVN-Kubernetes network plugin or the OpenShift SDN network plugin withmode: NetworkPolicyset. This mode is the default for OpenShift SDN. -
You installed the OpenShift CLI (
oc). -
You logged in to the cluster with a user with
cluster-adminprivileges. - You are working in the namespace that the multi-network policy applies to.
Procedure
Create a policy that allows traffic from all pods in all namespaces to a particular application. Save the YAML in the
web-allow-all-namespaces.yamlfile:apiVersion: k8s.cni.cncf.io/v1beta1 kind: MultiNetworkPolicy metadata: name: web-allow-all-namespaces namespace: default annotations: k8s.v1.cni.cncf.io/policy-for:<namespace_name>/<network_name> spec: podSelector: matchLabels: app: web policyTypes: - Ingress ingress: - from: - namespaceSelector: {}where:
app-
Applies the policy only to
app:webpods in default namespace. namespaceSelectorSelects all pods in all namespaces.
NoteBy default, if you do not specify a
namespaceSelectorparameter in the policy object, no namespaces get selected. This means the policy allows traffic only from the namespace where the network policy deployes.
Apply the policy by entering the following command. Successful output lists the name of the policy object and the
createdstatus.$ oc apply -f web-allow-all-namespaces.yaml
Verification
Start a web service in the
defaultnamespace by entering the following command:$ oc run web --namespace=default --image=nginx --labels="app=web" --expose --port=80Run the following command to deploy an
alpineimage in thesecondarynamespace and to start a shell:$ oc run test-$RANDOM --namespace=secondary --rm -i -t --image=alpine -- shRun the following command in the shell and observe that the service allows the request:
# wget -qO- --timeout=2 http://web.default<!DOCTYPE html> <html> <head> <title>Welcome to nginx!</title> <style> html { color-scheme: light dark; } body { width: 35em; margin: 0 auto; font-family: Tahoma, Verdana, Arial, sans-serif; } </style> </head> <body> <h1>Welcome to nginx!</h1> <p>If you see this page, the nginx web server is successfully installed and working. Further configuration is required.</p> <p>For online documentation and support please refer to <a href="http://nginx.org/">nginx.org</a>.<br/> Commercial support is available at <a href="http://nginx.com/">nginx.com</a>.</p> <p><em>Thank you for using nginx.</em></p> </body> </html>
17.6.3.8. Creating a multi-network policy allowing traffic to an application from a namespace
You can configure a policy that allows traffic to a pod with the label app=web from a particular namespace. This configuration is useful in the following use cases:
- Restrict traffic to a production database only to namespaces that have production workloads deployed.
- Enable monitoring tools deployed to a particular namespace to scrape metrics from the current namespace.
If you log in with a user with the cluster-admin role, then you can create a network policy in any namespace in the cluster.
Prerequisites
-
Your cluster uses a network plugin that supports
NetworkPolicyobjects, such as the OVN-Kubernetes network plugin or the OpenShift SDN network plugin withmode: NetworkPolicyset. This mode is the default for OpenShift SDN. -
You installed the OpenShift CLI (
oc). -
You logged in to the cluster with a user with
cluster-adminprivileges. - You are working in the namespace that the multi-network policy applies to.
Procedure
Create a policy that allows traffic from all pods in a particular namespaces with a label
purpose=production. Save the YAML in theweb-allow-prod.yamlfile:apiVersion: k8s.cni.cncf.io/v1beta1 kind: MultiNetworkPolicy metadata: name: web-allow-prod namespace: default annotations: k8s.v1.cni.cncf.io/policy-for:<namespace_name>/<network_name> spec: podSelector: matchLabels: app: web policyTypes: - Ingress ingress: - from: - namespaceSelector: matchLabels: purpose: productionwhere:
app-
Applies the policy only to
app:webpods in the default namespace. purpose-
Restricts traffic to only pods in namespaces that have the label
purpose=production.
Apply the policy by entering the following command. Successful output lists the name of the policy object and the
createdstatus.$ oc apply -f web-allow-prod.yaml
Verification
Start a web service in the
defaultnamespace by entering the following command:$ oc run web --namespace=default --image=nginx --labels="app=web" --expose --port=80Run the following command to create the
prodnamespace:$ oc create namespace prodRun the following command to label the
prodnamespace:$ oc label namespace/prod purpose=productionRun the following command to create the
devnamespace:$ oc create namespace devRun the following command to label the
devnamespace:$ oc label namespace/dev purpose=testingRun the following command to deploy an
alpineimage in thedevnamespace and to start a shell:$ oc run test-$RANDOM --namespace=dev --rm -i -t --image=alpine -- shRun the following command in the shell and observe the reason for the blocked request. For example, expected output states
wget: download timed out.# wget -qO- --timeout=2 http://web.defaultRun the following command to deploy an
alpineimage in theprodnamespace and start a shell:$ oc run test-$RANDOM --namespace=prod --rm -i -t --image=alpine -- shRun the following command in the shell and observe that the request is allowed:
# wget -qO- --timeout=2 http://web.default<!DOCTYPE html> <html> <head> <title>Welcome to nginx!</title> <style> html { color-scheme: light dark; } body { width: 35em; margin: 0 auto; font-family: Tahoma, Verdana, Arial, sans-serif; } </style> </head> <body> <h1>Welcome to nginx!</h1> <p>If you see this page, the nginx web server is successfully installed and working. Further configuration is required.</p> <p>For online documentation and support please refer to <a href="http://nginx.org/">nginx.org</a>.<br/> Commercial support is available at <a href="http://nginx.com/">nginx.com</a>.</p> <p><em>Thank you for using nginx.</em></p> </body> </html>
17.7. Attaching a pod to an additional network
To enable a pod to use additional network interfaces beyond the primary cluster network in OpenShift Container Platform, you can attach the pod to a secondary network. Secondary networks provide additional connectivity options for your workloads.
17.7.1. Adding a pod to an additional network
To enable a pod to use additional network interfaces in OpenShift Container Platform, you can attach the pod to a secondary network. The pod continues to send normal cluster-related network traffic over the default network.
When a pod is created, a secondary network is attached to the pod. However, if a pod already exists, you cannot attach a secondary network to it.
The pod must be in the same namespace as the additional network.
Prerequisites
-
Install the OpenShift CLI (
oc). - Log in to the cluster.
Procedure
Add an annotation to the
Podobject. Only one of the following annotation formats can be used:To attach a secondary network without any customization, add an annotation with the following format:
metadata: annotations: k8s.v1.cni.cncf.io/networks: <network>[,<network>,...]where:
k8s.v1.cni.cncf.io/networks- Specifies the name of the secondary network to associate with the pod. To specify more than one secondary network, separate each network with a comma. Do not include whitespace between the comma. If you specify the same secondary network multiple times, that pod will have multiple network interfaces attached to that network.
To attach a secondary network with customizations, add an annotation with the following format:
metadata: annotations: k8s.v1.cni.cncf.io/networks: |- [ { "name": "<network>", "namespace": "<namespace>", "default-route": ["<default_route>"] } ]where:
<network>-
Specifies the name of the secondary network defined by a
NetworkAttachmentDefinitionobject. <namespace>-
Specifies the namespace where the
NetworkAttachmentDefinitionobject is defined. <default-route>-
Optional parameter. Specifies an override for the default route, such as
192.168.17.1.
Create the pod by entering the following command.
$ oc create -f <name>.yamlReplace
<name>with the name of the pod.Optional: Confirm that the annotation exists in the
podCR by entering the following command. Replace<name>with the name of the pod.$ oc get pod <name> -o yamlIn the following example, the
example-podpod is attached to thenet1additional network:$ oc get pod example-pod -o yaml apiVersion: v1 kind: Pod metadata: annotations: k8s.v1.cni.cncf.io/networks: macvlan-bridge k8s.v1.cni.cncf.io/network-status: |- [{ "name": "openshift-sdn", "interface": "eth0", "ips": [ "10.128.2.14" ], "default": true, "dns": {} },{ "name": "macvlan-bridge", "interface": "net1", "ips": [ "20.2.2.100" ], "mac": "22:2f:60:a5:f8:00", "dns": {} }] name: example-pod namespace: default spec: ... status: ...where:
k8s.v1.cni.cncf.io/network-status- Specifies a JSON array of objects. Each object describes the status of a secondary network attached to the pod. The annotation value is stored as a plain text value.
17.7.1.1. Specifying pod-specific addressing and routing options
To set static IP addresses, MAC addresses, and default routes for a pod in OpenShift Container Platform, you can configure pod-specific addressing and routing options using JSON-formatted annotations. With these annotations, you can customize network behavior for individual pods on secondary networks.
Prerequisites
- The pod must be in the same namespace as the additional network.
-
Install the OpenShift CLI (
oc). - You must log in to the cluster.
Procedure
Edit the
Podresource definition. If you are editing an existingPodresource, run the following command to edit its definition in the default editor. Replace<name>with the name of thePodresource to edit.$ oc edit pod <name>In the
Podresource definition, add thek8s.v1.cni.cncf.io/networksparameter to the podmetadatamapping. Thek8s.v1.cni.cncf.io/networksaccepts a JSON string of a list of objects that reference the name ofNetworkAttachmentDefinitioncustom resource (CR) names in addition to specifying additional properties.metadata: annotations: k8s.v1.cni.cncf.io/networks: '[<network>[,<network>,...]]' # ...where:
<network>- Replace with a JSON object as shown in the following examples. The single quotes are required.
In the following example the annotation specifies which network attachment will have the default route, using the
default-routeparameter.apiVersion: v1 kind: Pod metadata: name: example-pod annotations: k8s.v1.cni.cncf.io/networks: '[ { "name": "net1" }, { "name": "net2", "default-route": ["192.0.2.1"] }]' spec: containers: - name: example-pod command: ["/bin/bash", "-c", "sleep 2000000000000"] image: centos/toolswhere:
net1,net2-
Specifies the name of the
NetworkAttachmentDefinitionresource that defines the secondary network to associate with the pod. 192.0.2.1-
Specifies a value of a gateway for traffic to be routed over if no other routing entry is present in the routing table. If more than one
default-routekey is specified, this will cause the pod to fail to become active.
The default route will cause any traffic that is not specified in other routes to be routed to the gateway.
ImportantSetting the default route to an interface other than the default network interface for OpenShift Container Platform may cause traffic that is anticipated for pod-to-pod traffic to be routed over another interface.
To verify the routing properties of a pod, the
occommand may be used to execute theipcommand within a pod.$ oc exec -it <pod_name> -- ip routeNoteYou may also reference the pod’s
k8s.v1.cni.cncf.io/network-statusto see which additional network has been assigned the default route, by the presence of thedefault-routekey in the JSON-formatted list of objects.To set a static IP address or MAC address for a pod you can use the JSON formatted annotations. This requires you create networks that specifically allow for this functionality. This can be specified in a rawCNIConfig for the CNO.
Edit the CNO CR by running the following command:
$ oc edit networks.operator.openshift.io clusterThe following YAML describes the configuration parameters for the CNO:
Cluster Network Operator YAML configuration
name: <name> namespace: <namespace> rawCNIConfig: '{ ... }' type: Rawwhere:
name-
Specifies a name for the secondary network attachment that you are creating. The name must be unique within the specified
namespace. namespace-
Specifies the namespace to create the network attachment in. If you do not specify a value, then the
defaultnamespace is used. rawCNIConfig- Specifies the CNI plugin configuration in JSON format, which is based on the following template.
The following object describes the configuration parameters for utilizing static MAC address and IP address using the macvlan CNI plugin:
macvlan CNI plugin JSON configuration object using static IP and MAC address
{ "cniVersion": "0.3.1", "name": "<name>", "plugins": [{ "type": "macvlan", "capabilities": { "ips": true }, "master": "eth0", "mode": "bridge", "ipam": { "type": "static" } }, { "capabilities": { "mac": true }, "type": "tuning" }] }where:
name-
Specifies the name for the secondary network attachment to create. The name must be unique within the specified
namespace. plugins- Specifies an array of CNI plugin configurations. The first object specifies a macvlan plugin configuration and the second object specifies a tuning plugin configuration.
ips- Specifies that a request is made to enable the static IP address functionality of the CNI plugin runtime configuration capabilities.
master- Specifies the interface that the macvlan plugin uses.
mac- Specifies that a request is made to enable the static MAC address functionality of a CNI plugin.
The above network attachment can be referenced in a JSON formatted annotation, along with keys to specify which static IP and MAC address will be assigned to a given pod.
Edit the pod by entering the following command:
$ oc edit pod <name>macvlan CNI plugin JSON configuration object using static IP and MAC address
apiVersion: v1 kind: Pod metadata: name: example-pod annotations: k8s.v1.cni.cncf.io/networks: '[ { "name": "<name>", "ips": [ "192.0.2.205/24" ], "mac": "CA:FE:C0:FF:EE:00" } ]'where:
metadata.name-
Specifies the name for the secondary network attachment to create. The name must be unique within the specified
namespace. metadata.annotations.k8s.v1.cni.cncf.io/ips- Specifies an IP address including the subnet mask.
metadata.annotations.k8s.v1.cni.cncf.io/mac- Specifies the MAC address.
NoteStatic IP addresses and MAC addresses do not have to be used at the same time. You can use them individually, or together.
17.8. Removing a pod from an additional network
To disconnect a pod from specific network configurations in OpenShift Container Platform, you can remove the pod from a secondary network. Delete the pod to remove its connection to the secondary network.
17.8.1. Removing a pod from an additional network
To disconnect a pod from specific network configurations in OpenShift Container Platform, you can remove the pod from a secondary network. Delete the pod using the oc delete pod command to remove its connection to the secondary network.
Prerequisites
- An additional network is attached to the pod.
-
Install the OpenShift CLI (
oc). - Log in to the cluster.
Procedure
Delete the pod by entering the following command:
$ oc delete pod <name> -n <namespace>where:
<name>- Specifies the name of the pod.
<namespace>- Specifies the namespace that contains the pod.
17.9. Editing an additional network
To update network settings or change network parameters for a secondary network in OpenShift Container Platform, you can modify the configuration for an existing secondary network. Edit the NetworkAttachmentDefinition custom resource to apply your changes.
17.9.1. Modifying a NetworkAttachmentDefinition custom resource
To update network settings or change network parameters for a secondary network in OpenShift Container Platform, you can modify the NetworkAttachmentDefinition custom resource. Edit the Cluster Network Operator CR to apply your changes.
Prerequisites
- You have configured an additional network for your cluster.
-
Install the OpenShift CLI (
oc). -
Log in as a user with
cluster-adminprivileges.
Procedure
Edit the Cluster Network Operator (CNO) CR in your default text editor by running the following command:
$ oc edit networks.operator.openshift.io cluster-
In the
additionalNetworkscollection, update the secondary network with your changes. - Save your changes and quit the text editor to commit your changes.
Optional: Confirm that the CNO updated the
NetworkAttachmentDefinitionobject by running the following command. Replace<network_name>with the name of the secondary network to display. There might be a delay before the CNO updates theNetworkAttachmentDefinitionobject to reflect your changes.$ oc get network-attachment-definitions <network_name> -o yamlFor example, the following console output displays a
NetworkAttachmentDefinitionobject that is namednet1:$ oc get network-attachment-definitions net1 -o go-template='{{printf "%s\n" .spec.config}}' { "cniVersion": "0.3.1", "type": "macvlan", "master": "ens5", "mode": "bridge", "ipam": {"type":"static","routes":[{"dst":"0.0.0.0/0","gw":"10.128.2.1"}],"addresses":[{"address":"10.128.2.100/23","gateway":"10.128.2.1"}],"dns":{"nameservers":["172.30.0.10"],"domain":"us-west-2.compute.internal","search":["us-west-2.compute.internal"]}} }
17.9.2. Using an OVN-Kubernetes localnet topology to map VLANs to a secondary interface
You can use OVN-Kubernetes localnet topology in a NetworkAttachmentDefinition (NAD) to map a specific VLAN ID from the physical network to the secondary interface of a pod.
To provide multiple VLANs for cluster workloads in OpenShift Container Platform, define additional VLANs in the NetworkAttachmentDefinition custom resource (CR). Configuring trunk ports ensures that the physical network associates correctly with your virtual infrastructure for reliable traffic management.
The example in the procedure demonstrates the following configurations:
- Physical switch ports connect to OpenShift Container Platform nodes by using VLAN trunking. The trunk carries tagged traffic for the VLANs you define in NADs.
-
The
br-exacts as the OVS bridge that connects virtual workloads to the physical workloads. -
Multiple NADs with specific VLAN tags get created by using the
localnettopology. This configuration defines specific VLAN IDs for traffic isolation. - Pods or virtual machines (VMs) attach to the NAD CRs for the purposes of improved network connectivity.
Prerequisites
-
You installed the OpenShift CLI (
oc). -
You logged in as a user with
cluster-adminprivileges. - You installed the NMState Operator.
-
You configured the
br-exbridge interface during cluster installation.
Procedure
Create an
NetworkAttachmentDefinitionCR for each VLAN, such asnad-cvlan100.yaml. OVN-Kubernetes uses the NAD files to tag and untag Ethernet frames for pods or VMs.Example configuration
apiVersion: k8s.cni.cncf.io/v1 kind: NetworkAttachmentDefinition metadata: name: vlan-100 namespace: default spec: config: |- { "cniVersion": "0.4.0", "name": "localnet-vlan-100", "type": "ovn-k8s-cni-overlay", "physicalNetworkName": "physnet", "topology": "localnet", "vlanID": 100, "mtu": 1500, "netAttachDefName": "default/vlan-100" } # ...Attach pods or VMs to the VLANs by referencing the NAD in the configuration for the pod or VM:
Example pod configuration
apiVersion: v1 kind: Pod metadata: annotations: k8s.v1.cni.cncf.io/networks: vlan-100 # ...Example VM configuration
apiVersion: kubevirt.io/v1 kind: VirtualMachine spec: template: spec: networks: - multus: networkName: vlan-100 name: secondary-vlan # ...
17.10. Removing an additional network
To clean up unused network configurations or free up network resources in OpenShift Container Platform, you can remove an additional network attachment. Delete the NetworkAttachmentDefinition custom resource to remove the secondary network from your cluster.
17.10.1. Removing a secondary NetworkAttachmentDefinition custom resource
To clean up unused network configurations or free up network resources in OpenShift Container Platform, you can remove a secondary NetworkAttachmentDefinition CR. Edit the Cluster Network Operator CR and delete the NetworkAttachmentDefinition CR to remove the secondary network from your cluster.
When a secondary network is removed from the cluster, it is not removed from any pods that it is attached to.
Prerequisites
-
Install the OpenShift CLI (
oc). -
Log in as a user with
cluster-adminprivileges.
Procedure
Edit the Cluster Network Operator (CNO) in your default text editor by running the following command:
$ oc edit networks.operator.openshift.io clusterModify the custom resource (CR) by removing the configuration that the CNO created from the
additionalNetworkscollection for the secondary network that you want to remove.apiVersion: operator.openshift.io/v1 kind: Network metadata: name: cluster spec: additionalNetworks: []where:
spec.additionalNetworks-
Specifies the secondary network attachment definition that you want to remove from the
additionalNetworkscollection. If you are removing the configuration mapping for the only secondary network attachment definition in theadditionalNetworkscollection, you must specify an empty collection.
Remove the
NetworkAttachmentDefinitionCR from the network of your cluster by entering the following command:$ oc delete net-attach-def <name_of_network_attachment_definition>Replace
<name_of_network_attachment_definition>with the name of theNetworkAttachmentDefinitionCR that you want to remove.- Save your changes and quit the text editor to commit your changes.
Optional: Confirm that the additional network CR was deleted by running the following command:
$ oc get network-attachment-definition --all-namespaces
17.11. Enabling multi-networking for advanced use cases with CNI plugin chaining
You can use Container Network Interface (CNI) plugin chaining to enable advanced multi-networking use cases for your pods.
17.11.1. About CNI chaining
CNI plugin chaining allows pods to use multiple network interfaces. This enables advanced configurations such as traffic isolation and prioritized routing through granular traffic policies.
By using CNI plugin chaining, different types of traffic can be isolated to meet performance, security, and compliance requirements, providing greater flexibility in network design and traffic management.
Some scenarios where this might be useful include:
- Multi-Network topologies: Enables you to attach pods to multiple networks, each with its own traffic policy, where relevant.
- Traffic isolation: Provides separate networks for management, storage, and application traffic to ensure each has the appropriate security and QoS settings.
- Custom routing rules: Ensures that specific traffic, for example SIP traffic, always uses a designated network interface, while other traffic follows the default network.
- Enhanced network performance: Allows you to prioritize certain traffic types or manage congestion by directing them through dedicated network interfaces.
17.11.2. Configuring plugin chaining with the route-override CNI plugin
Plugin chaining allows you to configure multiple CNI plugins to be applied sequentially to the same network interface, where each plugin in the chain processes the interface in order.
When you define a NetworkAttachmentDefinition (NAD) with a plugins array, the first plugin can create the interface, and a second plugin can modify its routing configuration.
The route-override CNI plugin is commonly used as the second plugin in a chain to modify the routing configuration of an interface created by the first plugin. It supports the following operations:
-
addroutes:Add static routes to direct traffic for specific destination networks through the interface. -
delroutes:Remove specific routes from the interface. -
flushroutes:Remove all routes from the interface. -
flushgateway:Remove the default gateway route from the interface.
The following example demonstrates plugin chaining by configuring a pod with two additional network interfaces, each on a separate VLAN with custom routing:
-
eth1on the192.168.100.0/24network (VLAN 100), with a static route directing10.0.0.0/8traffic through this interface. -
eth2on the192.168.200.0/24network (VLAN 200), with a static route directing172.16.0.0/12traffic through this interface.
Each interface uses a chain of two plugins: macvlan to create the interface on a VLAN, and route-override to add static routes that direct specific traffic through that interface.
Prerequisites
-
Install the OpenShift CLI (
oc). -
An account with
cluster-adminprivileges.
Procedure
Create a namespace for the example by running the following command:
$ oc create namespace chain-exampleCreate the first NetworkAttachmentDefinition (NAD) with a chained plugin configuration.
Create a YAML file, such as
management.yaml, to define a NAD that configures a new interface,eth1, on VLAN 100 with the following configuration:apiVersion: k8s.cni.cncf.io/v1 kind: NetworkAttachmentDefinition metadata: name: management-net namespace: chain-example spec: config: '{ "cniVersion": "1.0.0", "name": "management-net", "plugins": [ { "type": "macvlan", "master": "br-ex", "vlan": 100, "mode": "bridge", "ipam": { "type": "static", "addresses": [ { "address": "192.168.100.10/24", "gateway": "192.168.100.1" } ] } }, { "type": "route-override", "addroutes": [ { "dst": "10.0.0.0/8", "gw": "192.168.100.1" } ] } ] }'
Create the NAD by running the following command:
$ oc apply -f management.yamlCreate the second NAD with a chained plugin configuration.
Create a YAML file, such as
sip.yaml, to define a NAD that configures a new interface,eth2, on VLAN 200 with the following configuration:apiVersion: k8s.cni.cncf.io/v1 kind: NetworkAttachmentDefinition metadata: name: sip-net namespace: chain-example spec: config: '{ "cniVersion": "1.0.0", "name": "sip-net", "plugins": [ { "type": "macvlan", "master": "br-ex", "vlan": 200, "mode": "bridge", "ipam": { "type": "static", "addresses": [ { "address": "192.168.200.10/24", "gateway": "192.168.200.1" } ] } }, { "type": "route-override", "addroutes": [ { "dst": "172.16.0.0/12", "gw": "192.168.200.1" } ] } ] }'
Create the NAD by running the following command:
$ oc apply -f sip.yamlAttach the
NetworkAttachmentDefinitionresources to a pod by creating a pod definition file, such aspod.yaml, with the following configuration:apiVersion: v1 kind: Pod metadata: name: chain-test-pod namespace: chain-example labels: app: chain-test annotations: k8s.v1.cni.cncf.io/networks: '[ { "name": "management-net", "interface": "eth1" }, { "name": "sip-net", "interface": "eth2" } ]' spec: securityContext: runAsNonRoot: true seccompProfile: type: RuntimeDefault containers: - name: test-container image: registry.access.redhat.com/ubi9/ubi:latest command: ["sleep", "infinity"] securityContext: allowPrivilegeEscalation: false capabilities: drop: ["ALL"]Create the pod by running the following command:
$ oc apply -f pod.yamlVerify the pod is running with the following command:
$ oc wait --for=condition=Ready pod/chain-test-pod -n chain-example --timeout=120sExample output:
pod/chain-test-pod condition met
Verification
Run the following command to list all network interfaces and their assigned IP addresses inside the pod. This verifies that the pod has the additional interfaces configured by plugin chaining:
$ oc exec chain-test-pod -n chain-example -- ip aExample output:
1: lo: <LOOPBACK,UP,LOWER_UP> mtu 65536 qdisc noqueue state UNKNOWN qlen 1000 link/loopback 00:00:00:00:00:00 brd 00:00:00:00:00:00 inet 127.0.0.1/8 scope host lo valid_lft forever preferred_lft forever inet6 ::1/128 scope host valid_lft forever preferred_lft forever 2: eth0@if31: <BROADCAST,MULTICAST,UP,LOWER_UP> mtu 8901 qdisc noqueue state UP link/ether 0a:58:0a:83:02:19 brd ff:ff:ff:ff:ff:ff link-netnsid 0 inet 10.131.2.25/23 brd 10.131.3.255 scope global eth0 valid_lft forever preferred_lft forever inet6 fe80::858:aff:fe83:219/64 scope link valid_lft forever preferred_lft forever 3: eth1@if5: <BROADCAST,MULTICAST,UP,LOWER_UP> mtu 9001 qdisc noqueue state UP qlen 1000 link/ether aa:25:73:ff:a7:00 brd ff:ff:ff:ff:ff:ff link-netnsid 0 inet 192.168.100.10/24 brd 192.168.100.255 scope global eth1 valid_lft forever preferred_lft forever inet6 fe80::a825:73ff:feff:a700/64 scope link valid_lft forever preferred_lft forever 4: eth2@if5: <BROADCAST,MULTICAST,UP,LOWER_UP> mtu 9001 qdisc noqueue state UP qlen 1000 link/ether aa:a4:6c:4e:e8:97 brd ff:ff:ff:ff:ff:ff link-netnsid 0 inet 192.168.200.10/24 brd 192.168.200.255 scope global eth2 valid_lft forever preferred_lft forever inet6 fe80::a8a4:6cff:fe4e:e897/64 scope link valid_lft forever preferred_lft foreverThis output shows the pod has three network interfaces:
-
eth0:The default interface, connected to the cluster network. -
eth1:The first additional interface frommanagement-net, with IP192.168.100.10. -
eth2:The second additional interface fromsip-net, with IP192.168.200.10.
-
Run the following command to verify that the
route-overrideplugin added the expected static routes:$ oc exec chain-test-pod -n chain-example -- ip routeExample output:
default via 10.132.0.1 dev eth0 10.0.0.0/8 via 192.168.100.1 dev eth1 10.132.0.0/23 dev eth0 proto kernel scope link src 10.132.1.97 10.132.0.0/14 via 10.132.0.1 dev eth0 100.64.0.0/16 via 10.132.0.1 dev eth0 169.254.0.5 via 10.132.0.1 dev eth0 172.16.0.0/12 via 192.168.200.1 dev eth2 172.30.0.0/16 via 10.132.0.1 dev eth0 192.168.100.0/24 dev eth1 proto kernel scope link src 192.168.100.10 192.168.200.0/24 dev eth2 proto kernel scope link src 192.168.200.10This output confirms that the
route-overrideplugin in each chain added the expected static routes:-
For
10.0.0.0/8 via 192.168.100.1 dev eth1, traffic destined for10.0.0.0/8is routed througheth1via themanagement-netgateway. This route was added by theroute-overrideplugin in themanagement-netchain. -
For
172.16.0.0/12 via 192.168.200.1 dev eth2, traffic destined for172.16.0.0/12is routed througheth2via thesip-netgateway. This route was added by theroute-overrideplugin in thesip-netchain. -
The connected subnet routes (
192.168.100.0/24and192.168.200.0/24) were created by themacvlanplugin, while the default route useseth0, the cluster network interface.
-
For
17.12. Assigning a secondary network to a VRF
As a cluster administrator, you can configure a secondary network for a virtual routing and forwarding (VRF) domain by using the CNI VRF plugin. The virtual network that this plugin creates is associated with the physical interface that you specify.
Using a secondary network with a VRF instance has the following advantages:
- Workload isolation
- Isolate workload traffic by configuring a VRF instance for the additional network.
- Improved security
- Enable improved security through isolated network paths in the VRF domain.
- Multi-tenancy support
- Support multi-tenancy through network segmentation with a unique routing table in the VRF domain for each tenant.
Applications that use VRFs must bind to a specific device. The common usage is to use the SO_BINDTODEVICE option for a socket. The SO_BINDTODEVICE option binds the socket to the device that is specified in the passed interface name, for example, eth1. To use the SO_BINDTODEVICE option, the application must have CAP_NET_RAW capabilities.
Using a VRF through the ip vrf exec command is not supported in OpenShift Container Platform pods. To use VRF, bind applications directly to the VRF interface.
17.12.1. Creating an additional network attachment with the CNI VRF plugin
The Cluster Network Operator (CNO) manages secondary network definitions. When you specify a secondary network in the cluster-scoped Network custom resource (CR), the CNO automatically creates the NetworkAttachmentDefinition CR.
Do not edit the NetworkAttachmentDefinition CRs that the Cluster Network Operator manages. Doing so might disrupt network traffic on your additional network.
Prerequisites
-
Install the OpenShift CLI (
oc). -
Log in to the cluster as a user with
cluster-adminprivileges.
Procedure
Create the
NetworkCR for the additional network attachment and insert therawCNIConfigconfiguration for the secondary network. Save as theadditional-network-attachment.yamlfile.apiVersion: operator.openshift.io/v1 kind: Network metadata: name: cluster spec: additionalNetworks: - name: test-network-1 namespace: additional-network-1 type: Raw rawCNIConfig: '{ "cniVersion": "0.3.1", "name": "macvlan-vrf", "plugins": [ { "type": "macvlan", "master": "eth1", "ipam": { "type": "static", "addresses": [ { "address": "191.168.1.23/24" } ] } }, { "type": "vrf", "vrfname": "vrf-1", "table": 1001 }] }'where:
plugins- You must specify a list. The first item in the list must be the secondary network underpinning the VRF network. The second item in the list is the VRF plugin configuration.
type-
You must set this parameter to
vrf. vrfname- The name of the VRF that the interface is assigned to. If the VRF does not exist in the pod, the CNI creates the VRF.
tableOptional parameter. Specify the routing table ID. By default, the
tableidparameter is used. If you do not specify a table ID, the CNI assigns a free routing table ID to the VRF.NoteVRF functions correctly only when the resource is of type
netdevice.
Create the
Networkresource:$ oc create -f additional-network-attachment.yamlConfirm that the CNO created the
NetworkAttachmentDefinitionCR by running the following command. Replace<namespace>with the namespace that you specified when configuring the network attachment, for example,additional-network-1. The expected output shows the name of the NAD CR and the creation age in minutes.$ oc get network-attachment-definitions -n <namespace>NoteA delay might exist before the CNO creates the CR.
Verification
Create a pod and assign the pod to the secondary network that includes the VRF plugin configuration.
Create a YAML file that defines the
Podresource, as demonstrated in the followingpod-additional-net.yamlfile:apiVersion: v1 kind: Pod metadata: name: pod-additional-net annotations: k8s.v1.cni.cncf.io/networks: '[ { "name": "test-network-1"1 } ]' spec: containers: - name: example-pod-1 command: ["/bin/bash", "-c", "sleep 9000000"] image: centos:8where:
name- Specify the name of the secondary network that includes the VRF plugin configuration.
Create the
Podresource by running the following command. The expected output shows the name of thePodresource and the creation age in minutes.$ oc create -f pod-additional-net.yaml
Verify that the pod network attachment connects to the VRF secondary network. Start a remote session with the pod and run the following command. The expected output shows the name of the VRF interface and its unique ID in the routing table.
$ ip vrf showConfirm that the VRF interface is the controller for the secondary interface by entering the following command:
$ ip link5: net1: <BROADCAST,MULTICAST,UP,LOWER_UP> mtu 1500 qdisc noqueue master red state UP mode
Chapter 18. Hardware networks
18.1. About Single Root I/O Virtualization (SR-IOV) hardware networks
The Single Root I/O Virtualization (SR-IOV) specification is a standard for a type of PCI device assignment that can share a single device with multiple pods.
You can configure a Single Root I/O Virtualization (SR-IOV) device in your cluster by using the SR-IOV Operator.
SR-IOV can segment a compliant network device, recognized on the host node as a physical function (PF), into multiple virtual functions (VFs). The VF is used like any other network device. The SR-IOV network device driver for the device determines how the VF is exposed in the container:
-
netdevicedriver: A regular kernel network device in thenetnsof the container -
vfio-pcidriver: A character device mounted in the container
You can use SR-IOV network devices with additional networks on your OpenShift Container Platform cluster installed on bare metal or Red Hat OpenStack Platform (RHOSP) infrastructure for applications that require high bandwidth or low latency.
The SR-IOV Network Operator is supported on the following platforms:
- Bare metal
- Red Hat OpenStack Platform (RHOSP)
For a list of devices, such as network interface controllers (NICs) that OpenShift Container Platform supports, see Red Hat certified hardware on the Red Hat Ecosystem Catalog. The following example, finds the Intel X710 network adapter:
- From the Red Hat certified hardware webpage, click Explore from the Components tile.
- From the Provider drop-down menu, click the Intel Corporation checkbox.
- From the Platform drop-down menu, click the Red Hat OpenShift Container Platform checkbox.
- Find the Intel® Ethernet Server Adapter X710 network adapter from the list and then click on its tile. A new webpage opens that shows information for the network adapter.
You can configure multi-network policies for SR-IOV networks. The support for this is technology preview and SR-IOV additional networks are only supported with kernel NICs. They are not supported for Data Plane Development Kit (DPDK) applications.
Creating multi-network policies on SR-IOV networks might not deliver the same performance to applications compared to SR-IOV networks without a multi-network policy configured.
Multi-network policies for SR-IOV network is a Technology Preview feature only. Technology Preview features are not supported with Red Hat production service level agreements (SLAs) and might not be functionally complete. Red Hat does not recommend using them in production. These features provide early access to upcoming product features, enabling customers to test functionality and provide feedback during the development process.
For more information about the support scope of Red Hat Technology Preview features, see Technology Preview Features Support Scope.
You can enable SR-IOV on a node by using the following command:
$ oc label node <node_name> feature.node.kubernetes.io/network-sriov.capable="true"18.1.2. Components that manage SR-IOV network devices
The SR-IOV Network Operator creates and manages the components of the SR-IOV stack. The Operator performs the following functions:
- Orchestrates discovery and management of SR-IOV network devices
-
Generates
NetworkAttachmentDefinitioncustom resources for the SR-IOV Container Network Interface (CNI) - Creates and updates the configuration of the SR-IOV network device plugin
-
Creates node specific
SriovNetworkNodeStatecustom resources -
Updates the
spec.interfacesfield in eachSriovNetworkNodeStatecustom resource
The Operator provisions the following components:
- SR-IOV network configuration daemon
- A daemon set that is deployed on worker nodes when the SR-IOV Network Operator starts. The daemon is responsible for discovering and initializing SR-IOV network devices in the cluster.
- SR-IOV Network Operator webhook
- A dynamic admission controller webhook that validates the Operator custom resource and sets appropriate default values for unset fields.
- SR-IOV Network resources injector
-
A dynamic admission controller webhook that provides functionality for patching Kubernetes pod specifications with requests and limits for custom network resources such as SR-IOV VFs. The SR-IOV network resources injector adds the
resourcefield to only the first container in a pod automatically. - SR-IOV network device plugin
- A device plugin that discovers, advertises, and allocates SR-IOV network virtual function (VF) resources. Device plugins are used in Kubernetes to enable the use of limited resources, typically in physical devices. Device plugins give the Kubernetes scheduler awareness of resource availability, so that the scheduler can schedule pods on nodes with sufficient resources.
- SR-IOV CNI plugin
- A CNI plugin that attaches VF interfaces allocated from the SR-IOV network device plugin directly into a pod.
- SR-IOV InfiniBand CNI plugin
- A CNI plugin that attaches InfiniBand (IB) VF interfaces allocated from the SR-IOV network device plugin directly into a pod.
The SR-IOV Network resources injector and SR-IOV Network Operator webhook are enabled by default and can be disabled by editing the default SriovOperatorConfig CR. Use caution when disabling the SR-IOV Network Operator Admission Controller webhook. You can disable the webhook under specific circumstances, such as troubleshooting, or if you want to use unsupported devices.
18.1.4. Next steps
- Configuring the SR-IOV Network Operator
- Configuring an SR-IOV network device
- If you use OpenShift Virtualization: Connecting a virtual machine to an SR-IOV network
- Configuring an SR-IOV network attachment
- Ethernet network attachement: Adding a pod to an SR-IOV additional network
- InfiniBand network attachement: Adding a pod to an SR-IOV additional network
18.2. Configuring an SR-IOV network device
You can configure a Single Root I/O Virtualization (SR-IOV) device in your cluster.
Before you perform any tasks in the following documentation, ensure that you installed the SR-IOV Network Operator.
18.2.1. SR-IOV network node configuration object
You specify the SR-IOV network device configuration for a node by creating an SR-IOV network node policy. The API object for the policy is part of the sriovnetwork.openshift.io API group.
The following YAML describes an SR-IOV network node policy:
apiVersion: sriovnetwork.openshift.io/v1
kind: SriovNetworkNodePolicy
metadata:
name: <name>
namespace: openshift-sriov-network-operator
spec:
resourceName: <sriov_resource_name>
nodeSelector:
feature.node.kubernetes.io/network-sriov.capable: "true"
priority: <priority>
mtu: <mtu>
needVhostNet: false
numVfs: <num>
externallyManaged: false
nicSelector:
vendor: "<vendor_code>"
deviceID: "<device_id>"
pfNames: ["<pf_name>", ...]
rootDevices: ["<pci_bus_id>", ...]
netFilter: "<filter_string>"
deviceType: <device_type>
isRdma: false
linkType: <link_type>
eSwitchMode: "switchdev"
excludeTopology: false - 1 1 1 1
- The name for the custom resource object.
- 2
- The namespace where the SR-IOV Network Operator is installed.
- 3
- The resource name of the SR-IOV network device plugin. You can create multiple SR-IOV network node policies for a resource name.
When specifying a name, be sure to use the accepted syntax expression
^[a-zA-Z0-9_]+$in theresourceName. - 4
- The node selector specifies the nodes to configure. Only SR-IOV network devices on the selected nodes are configured. The SR-IOV Container Network Interface (CNI) plugin and device plugin are deployed on selected nodes only.Important
The SR-IOV Network Operator applies node network configuration policies to nodes in sequence. Before applying node network configuration policies, the SR-IOV Network Operator checks if the machine config pool (MCP) for a node is in an unhealthy state such as
DegradedorUpdating. If a node is in an unhealthy MCP, the process of applying node network configuration policies to all targeted nodes in the cluster pauses until the MCP returns to a healthy state.To avoid a node in an unhealthy MCP from blocking the application of node network configuration policies to other nodes, including nodes in other MCPs, you must create a separate node network configuration policy for each MCP.
- 5
- Optional: The priority is an integer value between
0and99. A smaller value receives higher priority. For example, a priority of10is a higher priority than99. The default value is99. - 6
- Optional: The maximum transmission unit (MTU) of the physical function and all its virtual functions. The maximum MTU value can vary for different network interface controller (NIC) models.Important
If you want to create virtual function on the default network interface, ensure that the MTU is set to a value that matches the cluster MTU.
If you want to modify the MTU of a single virtual function while the function is assigned to a pod, leave the MTU value blank in the SR-IOV network node policy. Otherwise, the SR-IOV Network Operator reverts the MTU of the virtual function to the MTU value defined in the SR-IOV network node policy, which might trigger a node drain.
- 7
- Optional: Set
needVhostNettotrueto mount the/dev/vhost-netdevice in the pod. Use the mounted/dev/vhost-netdevice with Data Plane Development Kit (DPDK) to forward traffic to the kernel network stack. - 8
- The number of the virtual functions (VF) to create for the SR-IOV physical network device. For an Intel network interface controller (NIC), the number of VFs cannot be larger than the total VFs supported by the device. For a Mellanox NIC, the number of VFs cannot be larger than
127. - 9
- The
externallyManagedfield indicates whether the SR-IOV Network Operator manages all, or only a subset of virtual functions (VFs). With the value set tofalsethe SR-IOV Network Operator manages and configures all VFs on the PF.NoteWhen
externallyManagedis set totrue, you must manually create the Virtual Functions (VFs) on the physical function (PF) before applying theSriovNetworkNodePolicyresource. If the VFs are not pre-created, the SR-IOV Network Operator’s webhook will block the policy request.When
externallyManagedis set tofalse, the SR-IOV Network Operator automatically creates and manages the VFs, including resetting them if necessary.To use VFs on the host system, you must create them through NMState, and set
externallyManagedtotrue. In this mode, the SR-IOV Network Operator does not modify the PF or the manually managed VFs, except for those explicitly defined in thenicSelectorfield of your policy. However, the SR-IOV Network Operator continues to manage VFs that are used as pod secondary interfaces. - 10
- The NIC selector identifies the device to which this resource applies. You do not have to specify values for all the parameters. It is recommended to identify the network device with enough precision to avoid selecting a device unintentionally.
If you specify
rootDevices, you must also specify a value forvendor,deviceID, orpfNames. If you specify bothpfNamesandrootDevicesat the same time, ensure that they refer to the same device. If you specify a value fornetFilter, then you do not need to specify any other parameter because a network ID is unique. - 11
- Optional: The vendor hexadecimal vendor identifier of the SR-IOV network device. The only allowed values are
8086(Intel) and15b3(Mellanox). - 12
- Optional: The device hexadecimal device identifier of the SR-IOV network device. For example,
101bis the device ID for a Mellanox ConnectX-6 device. - 13
- Optional: An array of one or more physical function (PF) names the resource must apply to.
- 14
- Optional: An array of one or more PCI bus addresses the resource must apply to. For example
0000:02:00.1. - 15
- Optional: The platform-specific network filter. The only supported platform is Red Hat OpenStack Platform (RHOSP). Acceptable values use the following format:
openstack/NetworkID:xxxxxxxx-xxxx-xxxx-xxxx-xxxxxxxxxxxx. Replacexxxxxxxx-xxxx-xxxx-xxxx-xxxxxxxxxxxxwith the value from the/var/config/openstack/latest/network_data.jsonmetadata file. This filter ensures that VFs are associated with a specific OpenStack network. The operator uses this filter to map the VFs to the appropriate network based on metadata provided by the OpenStack platform. - 16
- Optional: The driver to configure for the VFs created from this resource. The only allowed values are
netdeviceandvfio-pci. The default value isnetdevice.For a Mellanox NIC to work in DPDK mode on bare metal nodes, use the
netdevicedriver type and setisRdmatotrue. - 17
- Optional: Configures whether to enable remote direct memory access (RDMA) mode. The default value is
false.If the
isRdmaparameter is set totrue, you can continue to use the RDMA-enabled VF as a normal network device. A device can be used in either mode.Set
isRdmatotrueand additionally setneedVhostNettotrueto configure a Mellanox NIC for use with Fast Datapath DPDK applications.NoteYou cannot set the
isRdmaparameter totruefor intel NICs. - 18
- Optional: The link type for the VFs. The default value is
ethfor Ethernet. Change this value to 'ib' for InfiniBand.When
linkTypeis set toib,isRdmais automatically set totrueby the SR-IOV Network Operator webhook. WhenlinkTypeis set toib,deviceTypeshould not be set tovfio-pci.Do not set linkType to
ethfor SriovNetworkNodePolicy, because this can lead to an incorrect number of available devices reported by the device plugin. - 19
- Optional: To enable hardware offloading, you must set the
eSwitchModefield to"switchdev". For more information about hardware offloading, see "Configuring hardware offloading". - 20
- Optional: To exclude advertising an SR-IOV network resource’s NUMA node to the Topology Manager, set the value to
true. The default value isfalse.
18.2.1.1. SR-IOV network node configuration examples
The following example describes the configuration for an InfiniBand device:
Example configuration for an InfiniBand device
apiVersion: sriovnetwork.openshift.io/v1
kind: SriovNetworkNodePolicy
metadata:
name: <name>
namespace: openshift-sriov-network-operator
spec:
resourceName: <sriov_resource_name>
nodeSelector:
feature.node.kubernetes.io/network-sriov.capable: "true"
numVfs: <num>
nicSelector:
vendor: "<vendor_code>"
deviceID: "<device_id>"
rootDevices:
- "<pci_bus_id>"
linkType: <link_type>
isRdma: true
# ...The following example describes the configuration for an SR-IOV network device in a RHOSP virtual machine:
Example configuration for an SR-IOV device in a virtual machine
apiVersion: sriovnetwork.openshift.io/v1
kind: SriovNetworkNodePolicy
metadata:
name: <name>
namespace: openshift-sriov-network-operator
spec:
resourceName: <sriov_resource_name>
nodeSelector:
feature.node.kubernetes.io/network-sriov.capable: "true"
numVfs: 1
nicSelector:
vendor: "<vendor_code>"
deviceID: "<device_id>"
netFilter: "openstack/NetworkID:ea24bd04-8674-4f69-b0ee-fa0b3bd20509"
# ...18.2.1.2. Automated discovery of SR-IOV network devices
The SR-IOV Network Operator searches your cluster for SR-IOV capable network devices on worker nodes. The Operator creates and updates a SriovNetworkNodeState custom resource (CR) for each worker node that provides a compatible SR-IOV network device.
The CR is assigned the same name as the worker node. The status.interfaces list provides information about the network devices on a node.
Do not modify a SriovNetworkNodeState object. The Operator creates and manages these resources automatically.
18.2.1.2.1. Example SriovNetworkNodeState object
The following YAML is an example of a SriovNetworkNodeState object created by the SR-IOV Network Operator:
An SriovNetworkNodeState object
apiVersion: sriovnetwork.openshift.io/v1
kind: SriovNetworkNodeState
metadata:
name: node-25
namespace: openshift-sriov-network-operator
ownerReferences:
- apiVersion: sriovnetwork.openshift.io/v1
blockOwnerDeletion: true
controller: true
kind: SriovNetworkNodePolicy
name: default
spec:
dpConfigVersion: "39824"
status:
interfaces:
- deviceID: "1017"
driver: mlx5_core
mtu: 1500
name: ens785f0
pciAddress: "0000:18:00.0"
totalvfs: 8
vendor: 15b3
- deviceID: "1017"
driver: mlx5_core
mtu: 1500
name: ens785f1
pciAddress: "0000:18:00.1"
totalvfs: 8
vendor: 15b3
- deviceID: 158b
driver: i40e
mtu: 1500
name: ens817f0
pciAddress: 0000:81:00.0
totalvfs: 64
vendor: "8086"
- deviceID: 158b
driver: i40e
mtu: 1500
name: ens817f1
pciAddress: 0000:81:00.1
totalvfs: 64
vendor: "8086"
- deviceID: 158b
driver: i40e
mtu: 1500
name: ens803f0
pciAddress: 0000:86:00.0
totalvfs: 64
vendor: "8086"
syncStatus: Succeeded18.2.1.3. Virtual function (VF) partitioning for SR-IOV devices
In some cases, you might want to split virtual functions (VFs) from the same physical function (PF) into many resource pools. For example, you might want some of the VFs to load with the default driver and the remaining VFs load with the vfio-pci driver.
For example, the following YAML shows the selector for an interface named netpf0 with VF 2 through 7:
pfNames: ["netpf0#2-7"]where:
netpf0- The name of the PF interface name.
2- The first VF index (0-based) that gets included in the range.
7- The last VF index (0-based) that gets included in the range.
You can select VFs from the same PF by using different policy CRs provided that you meet the following requirements:
-
The
numVfsvalue must be similar for policies that select the same PF. -
The VF index must be in the range of
0to<numVfs>-1. For example, if you have a policy withnumVfsset to8, then the<first_vf>value must not be smaller than0, and the<last_vf>must not be larger than7. - The VFs ranges in different policies must not overlap.
-
The
<first_vf>must not be larger than the<last_vf>.
The following example illustrates NIC partitioning for an SR-IOV device.
The policy policy-net-1 defines a resource pool net-1 that includes the VF 0 of PF netpf0 with the default VF driver. The policy policy-net-1-dpdk defines a resource pool net-1-dpdk that includes the VF 8 to 15 of PF netpf0 with the vfio VF driver.
Policy policy-net-1:
apiVersion: sriovnetwork.openshift.io/v1
kind: SriovNetworkNodePolicy
metadata:
name: policy-net-1
namespace: openshift-sriov-network-operator
spec:
resourceName: net1
nodeSelector:
feature.node.kubernetes.io/network-sriov.capable: "true"
numVfs: 16
nicSelector:
pfNames: ["netpf0#0-0"]
deviceType: netdevice
Policy policy-net-1-dpdk:
apiVersion: sriovnetwork.openshift.io/v1
kind: SriovNetworkNodePolicy
metadata:
name: policy-net-1-dpdk
namespace: openshift-sriov-network-operator
spec:
resourceName: net1dpdk
nodeSelector:
feature.node.kubernetes.io/network-sriov.capable: "true"
numVfs: 16
nicSelector:
pfNames: ["netpf0#8-15"]
deviceType: vfio-pciVerifying that the interface is successfully partitioned
Confirm that the interface partitioned to virtual functions (VFs) for the SR-IOV device by running the following command.
$ ip link show <interface>1 - 1
- Replace
<interface>with the interface that you specified when partitioning to VFs for the SR-IOV device, for example,ens3f1.
Example output
5: ens3f1: <BROADCAST,MULTICAST,UP,LOWER_UP> mtu 1500 qdisc mq state UP mode DEFAULT group default qlen 1000 link/ether 3c:fd:fe:d1:bc:01 brd ff:ff:ff:ff:ff:ff vf 0 link/ether 5a:e7:88:25:ea:a0 brd ff:ff:ff:ff:ff:ff, spoof checking on, link-state auto, trust off vf 1 link/ether 3e:1d:36:d7:3d:49 brd ff:ff:ff:ff:ff:ff, spoof checking on, link-state auto, trust off vf 2 link/ether ce:09:56:97:df:f9 brd ff:ff:ff:ff:ff:ff, spoof checking on, link-state auto, trust off vf 3 link/ether 5e:91:cf:88:d1:38 brd ff:ff:ff:ff:ff:ff, spoof checking on, link-state auto, trust off vf 4 link/ether e6:06:a1:96:2f:de brd ff:ff:ff:ff:ff:ff, spoof checking on, link-state auto, trust off
18.2.1.4. A test pod template for clusters that use SR-IOV on OpenStack
The following testpmd pod demonstrates container creation with huge pages, reserved CPUs, and the SR-IOV port.
An example testpmd pod
apiVersion: v1
kind: Pod
metadata:
name: testpmd-sriov
namespace: mynamespace
annotations:
cpu-load-balancing.crio.io: "disable"
cpu-quota.crio.io: "disable"
# ...
spec:
containers:
- name: testpmd
command: ["sleep", "99999"]
image: registry.redhat.io/openshift4/dpdk-base-rhel8:v4.9
securityContext:
capabilities:
add: ["IPC_LOCK","SYS_ADMIN"]
privileged: true
runAsUser: 0
resources:
requests:
memory: 1000Mi
hugepages-1Gi: 1Gi
cpu: '2'
openshift.io/sriov1: 1
limits:
hugepages-1Gi: 1Gi
cpu: '2'
memory: 1000Mi
openshift.io/sriov1: 1
volumeMounts:
- mountPath: /dev/hugepages
name: hugepage
readOnly: False
runtimeClassName: performance-cnf-performanceprofile
volumes:
- name: hugepage
emptyDir:
medium: HugePages- 1
- This example assumes that the name of the performance profile is
cnf-performance profile.
18.2.1.5. A test pod template for clusters that use OVS hardware offloading on OpenStack
The following testpmd pod demonstrates Open vSwitch (OVS) hardware offloading on Red Hat OpenStack Platform (RHOSP).
An example testpmd pod
apiVersion: v1
kind: Pod
metadata:
name: testpmd-sriov
namespace: mynamespace
annotations:
k8s.v1.cni.cncf.io/networks: hwoffload1
spec:
runtimeClassName: performance-cnf-performanceprofile
containers:
- name: testpmd
command: ["sleep", "99999"]
image: registry.redhat.io/openshift4/dpdk-base-rhel8:v4.9
securityContext:
capabilities:
add: ["IPC_LOCK","SYS_ADMIN"]
privileged: true
runAsUser: 0
resources:
requests:
memory: 1000Mi
hugepages-1Gi: 1Gi
cpu: '2'
limits:
hugepages-1Gi: 1Gi
cpu: '2'
memory: 1000Mi
volumeMounts:
- mountPath: /mnt/huge
name: hugepage
readOnly: False
volumes:
- name: hugepage
emptyDir:
medium: HugePages- 1
- If your performance profile is not named
cnf-performance profile, replace that string with the correct performance profile name.
18.2.1.6. Huge pages resource injection for Downward API
When a pod specification includes a resource request or limit for huge pages, the Network Resources Injector automatically adds Downward API fields to the pod specification to provide the huge pages information to the container.
The Network Resources Injector adds a volume that is named podnetinfo and is mounted at /etc/podnetinfo for each container in the pod. The volume uses the Downward API and includes a file for huge pages requests and limits. The file naming convention is as follows:
-
/etc/podnetinfo/hugepages_1G_request_<container-name> -
/etc/podnetinfo/hugepages_1G_limit_<container-name> -
/etc/podnetinfo/hugepages_2M_request_<container-name> -
/etc/podnetinfo/hugepages_2M_limit_<container-name>
The paths specified in the previous list are compatible with the app-netutil library. By default, the library is configured to search for resource information in the /etc/podnetinfo directory. If you choose to specify the Downward API path items yourself manually, the app-netutil library searches for the following paths in addition to the paths in the previous list.
-
/etc/podnetinfo/hugepages_request -
/etc/podnetinfo/hugepages_limit -
/etc/podnetinfo/hugepages_1G_request -
/etc/podnetinfo/hugepages_1G_limit -
/etc/podnetinfo/hugepages_2M_request -
/etc/podnetinfo/hugepages_2M_limit
As with the paths that the Network Resources Injector can create, the paths in the preceding list can optionally end with a _<container-name> suffix.
18.2.2. Configuring SR-IOV network devices
The SR-IOV Network Operator adds the SriovNetworkNodePolicy.sriovnetwork.openshift.io custom resource definition (CRD) to OpenShift Container Platform. You can configure an SR-IOV network device by creating a SriovNetworkNodePolicy custom resource (CR).
When applying the configuration specified in a SriovNetworkNodePolicy CR, the SR-IOV Operator might drain the nodes, and in some cases, reboot nodes. Reboot only happens in the following cases:
-
With Mellanox NICs (
mlx5driver) a node reboot happens every time the number of virtual functions (VFs) increase on a physical function (PF). -
With Intel NICs, a reboot only happens if the kernel parameters do not include
intel_iommu=onandiommu=pt.
It might take several minutes for a configuration change to apply.
Prerequisites
-
You installed the OpenShift CLI (
oc). -
You have access to the cluster as a user with the
cluster-adminrole. - You have installed the SR-IOV Network Operator.
- You have enough available nodes in your cluster to handle the evicted workload from drained nodes.
- You have not selected any control plane nodes for SR-IOV network device configuration.
Procedure
-
Create an
SriovNetworkNodePolicyobject, and then save the YAML in the<name>-sriov-node-network.yamlfile. Replace<name>with the name for this configuration. -
Optional: Label the SR-IOV capable cluster nodes with
SriovNetworkNodePolicy.Spec.NodeSelectorif they are not already labeled. For more information about labeling nodes, see "Understanding how to update labels on nodes". Create the
SriovNetworkNodePolicyobject. When running the following command, replace<name>with the name for this configuration:$ oc create -f <name>-sriov-node-network.yamlAfter applying the configuration update, all the pods in
sriov-network-operatornamespace transition to theRunningstatus.To verify that the SR-IOV network device is configured, enter the following command. Replace
<node_name>with the name of a node with the SR-IOV network device that you just configured.$ oc get sriovnetworknodestates -n openshift-sriov-network-operator <node_name> -o jsonpath='{.status.syncStatus}'
18.2.3. Creating a non-uniform memory access (NUMA) aligned SR-IOV pod
You can create a NUMA aligned SR-IOV pod by restricting SR-IOV and the CPU resources allocated from the same NUMA node with restricted or single-numa-node Topology Manager polices.
Prerequisites
-
You have installed the OpenShift CLI (
oc). -
You have configured the CPU Manager policy to
static. For more information on CPU Manager, see the "Additional resources" section. You have configured the Topology Manager policy to
single-numa-node.NoteWhen
single-numa-nodeis unable to satisfy the request, you can configure the Topology Manager policy torestricted. For more flexible SR-IOV network resource scheduling, see Excluding SR-IOV network topology during NUMA-aware scheduling in the Additional resources section.
Procedure
Create the following SR-IOV pod spec, and then save the YAML in the
<name>-sriov-pod.yamlfile. Replace<name>with a name for this pod.The following example shows an SR-IOV pod spec:
apiVersion: v1 kind: Pod metadata: name: sample-pod annotations: k8s.v1.cni.cncf.io/networks: <name>1 spec: containers: - name: sample-container image: <image>2 command: ["sleep", "infinity"] resources: limits: memory: "1Gi"3 cpu: "2"4 requests: memory: "1Gi" cpu: "2"- 1
- Replace
<name>with the name of the SR-IOV network attachment definition CR. - 2
- Replace
<image>with the name of thesample-podimage. - 3
- To create the SR-IOV pod with guaranteed QoS, set
memory limitsequal tomemory requests. - 4
- To create the SR-IOV pod with guaranteed QoS, set
cpu limitsequals tocpu requests.
Create the sample SR-IOV pod by running the following command:
$ oc create -f <filename>1 - 1
- Replace
<filename>with the name of the file you created in the previous step.
Confirm that the
sample-podis configured with guaranteed QoS.$ oc describe pod sample-podConfirm that the
sample-podis allocated with exclusive CPUs.$ oc exec sample-pod -- cat /sys/fs/cgroup/cpuset/cpuset.cpusConfirm that the SR-IOV device and CPUs that are allocated for the
sample-podare on the same NUMA node.$ oc exec sample-pod -- cat /sys/fs/cgroup/cpuset/cpuset.cpus
18.2.4. Exclude the SR-IOV network topology for NUMA-aware scheduling
You can exclude advertising the Non-Uniform Memory Access (NUMA) node for the SR-IOV network to the Topology Manager for more flexible SR-IOV network deployments during NUMA-aware pod scheduling.
In some scenarios, it is a priority to maximize CPU and memory resources for a pod on a single NUMA node. By not providing a hint to the Topology Manager about the NUMA node for the pod’s SR-IOV network resource, the Topology Manager can deploy the SR-IOV network resource and the pod CPU and memory resources to different NUMA nodes. This can add to network latency because of the data transfer between NUMA nodes. However, it is acceptable in scenarios when workloads require optimal CPU and memory performance.
For example, consider a compute node, compute-1, that features two NUMA nodes: numa0 and numa1. The SR-IOV-enabled NIC is present on numa0. The CPUs available for pod scheduling are present on numa1 only. By setting the excludeTopology specification to true, the Topology Manager can assign CPU and memory resources for the pod to numa1 and can assign the SR-IOV network resource for the same pod to numa0. This is only possible when you set the excludeTopology specification to true. Otherwise, the Topology Manager attempts to place all resources on the same NUMA node.
18.2.5. Troubleshooting SR-IOV configuration
After following the procedure to configure an SR-IOV network device, the following sections address some error conditions.
Procedure
- To display the state of nodes, run the following command:
$ oc get sriovnetworknodestates -n openshift-sriov-network-operator <node_name>where:
- <node_name>
- Specifies the name of a node with an SR-IOV network device.
If the output from the command indicates "cannot allocate memory", check the following items:
- Confirm that global SR-IOV settings are enabled in the BIOS for the node.
- Confirm that VT-d is enabled in the BIOS for the node.
18.2.6. Next steps
18.3. Configuring an SR-IOV Ethernet network attachment
You can configure an Ethernet network attachment for an Single Root I/O Virtualization (SR-IOV) device in the cluster.
Before you perform any tasks in the following documentation, ensure that you installed the SR-IOV Network Operator.
18.3.1. Ethernet device configuration object
You can configure an Ethernet network device by defining an SriovNetwork object.
The following YAML describes an SriovNetwork object:
apiVersion: sriovnetwork.openshift.io/v1
kind: SriovNetwork
metadata:
name: <name>
namespace: openshift-sriov-network-operator
spec:
resourceName: <sriov_resource_name>
networkNamespace: <target_namespace>
vlan: <vlan>
spoofChk: "<spoof_check>"
ipam: |-
{}
linkState: <link_state>
maxTxRate: <max_tx_rate>
minTxRate: <min_tx_rate>
vlanQoS: <vlan_qos>
trust: "<trust_vf>"
capabilities: <capabilities> - 1
- A name for the object. The SR-IOV Network Operator creates a
NetworkAttachmentDefinitionobject with same name. - 2
- The namespace where the SR-IOV Network Operator is installed.
- 3
- The value for the
spec.resourceNameparameter from theSriovNetworkNodePolicyobject that defines the SR-IOV hardware for this additional network. - 4
- The target namespace for the SriovNetwork object. Only pods in the target namespace can attach to the additional network. When installing the SR-IOV Network Operator in a namespace other than
openshift-sriov-network-operator, you must not configure this field. - 5
- Optional: Specifies the VLAN ID to assign to an additional network. The default value of
0means that an additional network has no VLAN ID tag. Supported VLAN ID values range from1to4094. - 6
- Optional: The spoof check mode of the VF. The allowed values are the strings
"on"and"off".ImportantYou must enclose the value you specify in quotes or the object is rejected by the SR-IOV Network Operator.
- 7
- A configuration object for the IPAM CNI plugin as a YAML block scalar. The plugin manages IP address assignment for the attachment definition.
- 8
- Optional: The link state of virtual function (VF). Allowed value are
enable,disableandauto. - 9
- Optional: A maximum transmission rate, in Mbps, for the VF.
- 10
- Optional: A minimum transmission rate, in Mbps, for the VF. This value must be less than or equal to the maximum transmission rate.Note
Intel NICs do not support the
minTxRateparameter. For more information, see BZ#1772847. - 11
- Optional: An IEEE 802.1p priority level for the VF. The default value is
0. - 12
- Optional: The trust mode of the VF. The allowed values are the strings
"on"and"off".ImportantYou must enclose the value that you specify in quotes, or the SR-IOV Network Operator rejects the object.
- 13
- Optional: The capabilities to configure for this additional network. You can specify
'{ "ips": true }'to enable IP address support or'{ "mac": true }'to enable MAC address support.
18.3.1.1. Creating a configuration for assignment of dual-stack IP addresses dynamically
You can dynamically assign dual-stack IP addresses to a secondary network so that pods can communicate over both IPv4 and IPv6 addresses.
You can configure the following IP address assignment types in the ipRanges parameter:
- IPv4 addresses
- IPv6 addresses
- multiple IP address assignment
Procedure
-
Set
typetowhereabouts. Use
ipRangesto allocate IP addresses as shown in the following example:cniVersion: operator.openshift.io/v1 kind: Network metadata: name: cluster spec: additionalNetworks: - name: whereabouts-shim namespace: default type: Raw rawCNIConfig: |- { "name": "whereabouts-dual-stack", "cniVersion": "0.3.1, "type": "bridge", "ipam": { "type": "whereabouts", "ipRanges": [ {"range": "192.168.10.0/24"}, {"range": "2001:db8::/64"} ] } }- Attach the secondary network to a pod. For more information, see "Adding a pod to a secondary network".
Verification
Verify that all IP addresses got assigned to the network interfaces within the network namespace of a pod by entering the following command:
$ oc exec -it <pod_name> -- ip awhere:
<podname>- The name of the pod.
18.3.1.2. Configuration of IP address assignment for a network attachment
For secondary networks, you can assign IP addresses by using an IP Address Management (IPAM) CNI plugin, which supports various assignment methods, including Dynamic Host Configuration Protocol (DHCP) and static assignment.
You can use the following IP address assignment types:
- Static assignment.
- Dynamic assignment through a DHCP server. The DHCP server you specify must be reachable from the additional network.
- Dynamic assignment through the Whereabouts IPAM CNI plugin.
18.3.1.2.1. Static IP address assignment configuration
The following table describes the configuration for static IP address assignment:
| Field | Type | Description |
|---|---|---|
|
|
|
The IPAM address type. The value |
|
|
| An array of objects specifying IP addresses to assign to the virtual interface. Both IPv4 and IPv6 IP addresses are supported. |
|
|
| An array of objects specifying routes to configure inside the pod. |
|
|
| Optional: An array of objects specifying the DNS configuration. |
The addresses array requires objects with the following fields:
| Field | Type | Description |
|---|---|---|
|
|
|
An IP address and network prefix that you specify. For example, if you specify |
|
|
| The default gateway to route egress network traffic to. |
| Field | Type | Description |
|---|---|---|
|
|
|
The IP address range in CIDR format, such as |
|
|
| The gateway that routes network traffic. |
| Field | Type | Description |
|---|---|---|
|
|
| An array of one or more IP addresses where DNS queries get sent. |
|
|
|
The default domain to append to a hostname. For example, if the domain is set to |
|
|
|
An array of domain names to append to an unqualified hostname, such as |
Static IP address assignment configuration example
{
"ipam": {
"type": "static",
"addresses": [
{
"address": "191.168.1.7/24"
}
]
}
}18.3.1.2.2. Dynamic IP address (DHCP) assignment configuration
A pod obtains its original DHCP lease when the pod gets created. The lease must be periodically renewed by a minimal DHCP server deployment running on the cluster.
For an Ethernet network attachment, the SR-IOV Network Operator does not create a DHCP server deployment; the Cluster Network Operator is responsible for creating the minimal DHCP server deployment.
To trigger the deployment of the DHCP server, you must create a shim network attachment by editing the Cluster Network Operator configuration, as in the following example:
Example shim network attachment definition
apiVersion: operator.openshift.io/v1
kind: Network
metadata:
name: cluster
spec:
additionalNetworks:
- name: dhcp-shim
namespace: default
type: Raw
rawCNIConfig: |-
{
"name": "dhcp-shim",
"cniVersion": "0.3.1",
"type": "bridge",
"ipam": {
"type": "dhcp"
}
}
# ...where:
type- Specifies dynamic IP address assignment for the cluster.
The following table describes the configuration parameters for dynamic IP address address assignment with DHCP.
| Field | Type | Description |
|---|---|---|
|
|
|
The IPAM address type. The value |
The following JSON example describes the configuration p for dynamic IP address address assignment with DHCP.
Dynamic IP address (DHCP) assignment configuration example
{
"ipam": {
"type": "dhcp"
}
}18.3.1.2.3. Dynamic IP address assignment configuration with Whereabouts
The Whereabouts CNI plugin allows the dynamic assignment of an IP address to an additional network without the use of a DHCP server.
The Whereabouts CNI plugin also supports overlapping IP address ranges and configuration of the same CIDR range multiple times within separate NetworkAttachmentDefinition CRDs. This provides greater flexibility and management capabilities in multi-tenant environments.
18.3.1.2.3.1. Dynamic IP address configuration objects
The following table describes the configuration objects for dynamic IP address assignment with Whereabouts:
| Field | Type | Description |
|---|---|---|
|
|
|
The IPAM address type. The value |
|
|
| An IP address and range in CIDR notation. IP addresses are assigned from within this range of addresses. |
|
|
| Optional: A list of zero or more IP addresses and ranges in CIDR notation. IP addresses within an excluded address range are not assigned. |
|
|
| Optional: Helps ensure that each group or domain of pods gets its own set of IP addresses, even if they share the same range of IP addresses. Setting this field is important for keeping networks separate and organized, notably in multi-tenant environments. |
18.3.1.2.3.2. Dynamic IP address assignment configuration that uses Whereabouts
The following example shows a dynamic address assignment configuration that uses Whereabouts:
Whereabouts dynamic IP address assignment
{
"ipam": {
"type": "whereabouts",
"range": "192.0.2.192/27",
"exclude": [
"192.0.2.192/30",
"192.0.2.196/32"
]
}
}18.3.1.2.3.3. Dynamic IP address assignment that uses Whereabouts with overlapping IP address ranges
The following example shows a dynamic IP address assignment that uses overlapping IP address ranges for multi-tenant networks.
NetworkAttachmentDefinition 1
{
"ipam": {
"type": "whereabouts",
"range": "192.0.2.192/29",
"network_name": "example_net_common",
}
}- 1
- Optional. If set, must match the
network_nameofNetworkAttachmentDefinition 2.
NetworkAttachmentDefinition 2
{
"ipam": {
"type": "whereabouts",
"range": "192.0.2.192/24",
"network_name": "example_net_common",
}
}- 1
- Optional. If set, must match the
network_nameofNetworkAttachmentDefinition 1.
18.3.2. Configuring SR-IOV additional network
You can configure an additional network that uses SR-IOV hardware by creating an SriovNetwork object. When you create an SriovNetwork object, the SR-IOV Network Operator automatically creates a NetworkAttachmentDefinition object.
Do not modify or delete an SriovNetwork object if it is attached to any pods in a running state.
Prerequisites
-
Install the OpenShift CLI (
oc). -
Log in as a user with
cluster-adminprivileges.
Procedure
Create a
SriovNetworkobject, and then save the YAML in the<name>.yamlfile, where<name>is a name for this additional network. The object specification might resemble the following example:apiVersion: sriovnetwork.openshift.io/v1 kind: SriovNetwork metadata: name: attach1 namespace: openshift-sriov-network-operator spec: resourceName: net1 networkNamespace: project2 ipam: |- { "type": "host-local", "subnet": "10.56.217.0/24", "rangeStart": "10.56.217.171", "rangeEnd": "10.56.217.181", "gateway": "10.56.217.1" }To create the object, enter the following command:
$ oc create -f <name>.yamlwhere:
<name>- Specifies the name of the additional network.
Optional: To confirm that the
NetworkAttachmentDefinitionobject that is associated with theSriovNetworkobject that you created in the previous step exists, enter the following command. Replace<namespace>with thenetworkNamespacevalue you specified in theSriovNetworkobject.$ oc get net-attach-def -n <namespace>
18.3.3. Assigning an SR-IOV network to a VRF
As a cluster administrator, you can assign an SR-IOV network interface to your VRF domain by using the CNI VRF plugin.
To do this, add the VRF configuration to the optional metaPlugins parameter of the SriovNetwork resource.
Applications that use VRFs need to bind to a specific device. The common usage is to use the SO_BINDTODEVICE option for a socket. SO_BINDTODEVICE binds the socket to a device that is specified in the passed interface name, for example, eth1. To use SO_BINDTODEVICE, the application must have CAP_NET_RAW capabilities.
Using a VRF through the ip vrf exec command is not supported in OpenShift Container Platform pods. To use VRF, bind applications directly to the VRF interface.
18.3.3.1. Creating an additional SR-IOV network attachment with the CNI VRF plugin
The SR-IOV Network Operator manages additional network definitions. When you specify an additional SR-IOV network to create, the SR-IOV Network Operator creates the NetworkAttachmentDefinition custom resource (CR) automatically.
Do not edit NetworkAttachmentDefinition custom resources that the SR-IOV Network Operator manages. Doing so might disrupt network traffic on your additional network.
To create an additional SR-IOV network attachment with the CNI virtual routing and forwarding (VRF) plugin, perform the following procedure.
Prerequisites
-
Install the OpenShift CLI (
oc). - Log in to the OpenShift Container Platform cluster as a user with cluster-admin privileges.
Procedure
Create the
SriovNetworkcustom resource (CR) for the additional SR-IOV network attachment and insert themetaPluginsconfiguration, as in the following example CR. Save the YAML as the filesriov-network-attachment.yaml.apiVersion: sriovnetwork.openshift.io/v1 kind: SriovNetwork metadata: name: example-network namespace: additional-sriov-network-1 spec: ipam: | { "type": "host-local", "subnet": "10.56.217.0/24", "rangeStart": "10.56.217.171", "rangeEnd": "10.56.217.181", "routes": [{ "dst": "0.0.0.0/0" }], "gateway": "10.56.217.1" } vlan: 0 resourceName: intelnics metaPlugins : | { "type": "vrf",1 "vrfname": "example-vrf-name" }where:
metaPlugins.type-
Set the
typeparameter tovrf. metaPlugins.vrfname-
Specify a name for the VRF in the
vrfnameparameter. An interface gets assigned to the VRF. If you do not specify a name for the VRF in a pod, the SR-IOV Network Operator automatically generates a name for the VRF.
Create the
SriovNetworkresource:$ oc create -f sriov-network-attachment.yaml
Verification
Confirm that the SR-IOV Network Operator created the
NetworkAttachmentDefinitionCR by running the following command. The expected output shows the name of the NAD CR and the creation age in minutes.$ oc get network-attachment-definitions -n <namespace><namespace>: Replace<namespace>with the namespace that you specified when configuring the network attachment, for example,additional-sriov-network-1.NoteThere might be a delay before the SR-IOV Network Operator creates the CR.
To verify that the VRF CNI is correctly configured and that the additional SR-IOV network attachment is attached, do the following:
- Create an SR-IOV network that uses the VRF CNI.
- Assign the network to a pod.
Verify that the pod network attachment connects to the SR-IOV additional network. Ensure that you remote shell login into the pod and run the following command. The expected output shows the name of the VRF interface and its unique ID in the routing table.
$ ip vrf showConfirm that the VRF interface is
masterfor the secondary interface by running the following command. Example output shows5: net1: <BROADCAST,MULTICAST,UP,LOWER_UP> mtu 1500 qdisc noqueue master red state UP mode.$ ip link
18.3.4. Runtime configuration for an Ethernet-based SR-IOV attachment
When attaching a pod to an additional network, you can specify a runtime configuration to make specific customizations for the pod. For example, you can request a specific MAC hardware address.
You specify the runtime configuration by setting an annotation in the pod specification. The annotation key is k8s.v1.cni.cncf.io/networks, and it accepts a JSON object that describes the runtime configuration.
Example runtime configuration for an Ethernet-based SR-IOV network attachment
apiVersion: v1
kind: Pod
metadata:
name: sample-pod
annotations:
k8s.v1.cni.cncf.io/networks: |-
[
{
"name": "<network_attachment>",
"mac": "<mac_address>",
"ips": ["<cidr_range>"]
}
]
spec:
containers:
- name: sample-container
image: <image>
imagePullPolicy: IfNotPresent
command: ["sleep", "infinity"]where:
k8s.v1.cni.cncf.io/networks.name-
The name of the SR-IOV network attachment definition CR. Example value is
ibl. k8s.v1.cni.cncf.io/networks.mac-
Optional parameter. The MAC address for the SR-IOV device that is allocated from the resource type defined in the SR-IOV network attachment definition CR. To use this feature, you also must specify
{ "mac": true }in theSriovNetworkobject. Example value isc2:11:22:33:44:55:66:77. k8s.v1.cni.cncf.io/networks.ips-
Optional parameter. IP addresses for the SR-IOV device that is allocated from the resource type defined in the SR-IOV network attachment definition CR. Both IPv4 and IPv6 addresses are supported. To use this feature, you also must specify
{ "ips": true }in theSriovNetworkobject. Example value is192.168.10.1/24", "2001::1/64.
18.3.5. Adding a pod to an additional network
To enable a pod to use additional network interfaces in OpenShift Container Platform, you can attach the pod to a secondary network. The pod continues to send normal cluster-related network traffic over the default network.
When a pod is created, a secondary network is attached to the pod. However, if a pod already exists, you cannot attach a secondary network to it.
The pod must be in the same namespace as the additional network.
Prerequisites
-
Install the OpenShift CLI (
oc). - Log in to the cluster.
Procedure
Add an annotation to the
Podobject. Only one of the following annotation formats can be used:To attach a secondary network without any customization, add an annotation with the following format:
metadata: annotations: k8s.v1.cni.cncf.io/networks: <network>[,<network>,...]where:
k8s.v1.cni.cncf.io/networks- Specifies the name of the secondary network to associate with the pod. To specify more than one secondary network, separate each network with a comma. Do not include whitespace between the comma. If you specify the same secondary network multiple times, that pod will have multiple network interfaces attached to that network.
To attach a secondary network with customizations, add an annotation with the following format:
metadata: annotations: k8s.v1.cni.cncf.io/networks: |- [ { "name": "<network>", "namespace": "<namespace>", "default-route": ["<default_route>"] } ]where:
<network>-
Specifies the name of the secondary network defined by a
NetworkAttachmentDefinitionobject. <namespace>-
Specifies the namespace where the
NetworkAttachmentDefinitionobject is defined. <default-route>-
Optional parameter. Specifies an override for the default route, such as
192.168.17.1.
Create the pod by entering the following command.
$ oc create -f <name>.yamlReplace
<name>with the name of the pod.Optional: Confirm that the annotation exists in the
podCR by entering the following command. Replace<name>with the name of the pod.$ oc get pod <name> -o yamlIn the following example, the
example-podpod is attached to thenet1additional network:$ oc get pod example-pod -o yaml apiVersion: v1 kind: Pod metadata: annotations: k8s.v1.cni.cncf.io/networks: macvlan-bridge k8s.v1.cni.cncf.io/network-status: |- [{ "name": "openshift-sdn", "interface": "eth0", "ips": [ "10.128.2.14" ], "default": true, "dns": {} },{ "name": "macvlan-bridge", "interface": "net1", "ips": [ "20.2.2.100" ], "mac": "22:2f:60:a5:f8:00", "dns": {} }] name: example-pod namespace: default spec: ... status: ...where:
k8s.v1.cni.cncf.io/network-status- Specifies a JSON array of objects. Each object describes the status of a secondary network attached to the pod. The annotation value is stored as a plain text value.
18.3.6. Configuring parallel node draining during SR-IOV network policy updates
By default, the SR-IOV Network Operator drains workloads from a node before every policy change. The Operator performs this action, one node at a time, to ensure that the reconfiguration does not impact workloads.
In large clusters, draining nodes sequentially can be time-consuming, taking hours or even days. In time-sensitive environments, you can enable parallel node draining in an SriovNetworkPoolConfig custom resource (CR) for faster rollouts of SR-IOV network configurations.
To configure parallel draining, use the SriovNetworkPoolConfig CR to create a node pool. You can then add nodes to the pool and define the maximum number of nodes in the pool that the Operator can drain in parallel. With this approach, you can enable parallel draining for faster reconfiguration while ensuring you still have enough nodes remaining in the pool to handle any running workloads.
A node can only belong to one SR-IOV network pool configuration. If a node is not part of a pool, the node gets added to a virtual, default, pool that with a configuration for draining one node at a time only.
The node might restart during the draining process.
The procedure requires that you create SR-IOV resources and then parallel drain the nodes.
Prerequisites
-
Install the OpenShift CLI (
oc). -
Log in as a user with
cluster-adminprivileges. - Install the SR-IOV Network Operator.
- Nodes have hardware that support SR-IOV.
Procedure
Create a YAML file that defines the
SriovNetworkPoolConfigresource:Example
sriov-nw-pool.yamlfileapiVersion: v1 kind: SriovNetworkPoolConfig metadata: name: pool-1 namespace: openshift-sriov-network-operator spec: maxUnavailable: 2 nodeSelector: matchLabels: node-role.kubernetes.io/worker: ""where:
name-
Specify the name of the
SriovNetworkPoolConfigobject. namespace- Specify namespace where the SR-IOV Network Operator is installed.
maxUnavailable- Specify an integer number, or percentage value, for nodes that can be unavailable in the pool during an update. For example, if you have 10 nodes and you set the maximum unavailable to 2, then only 2 nodes can be drained in parallel at any time, leaving 8 nodes for handling workloads.
nodeSelector-
Specify the nodes to add the pool by using the node selector. This example adds all nodes with the
workerrole to the pool.
Create the
SriovNetworkPoolConfigresource by running the following command:$ oc create -f sriov-nw-pool.yamlCreate the
sriov-testnamespace by running the following comand:$ oc create namespace sriov-testCreate a YAML file that defines the
SriovNetworkNodePolicyresource, as demonstrated in the following example YAML file:apiVersion: sriovnetwork.openshift.io/v1 kind: SriovNetworkNodePolicy metadata: name: sriov-nic-1 namespace: openshift-sriov-network-operator spec: deviceType: netdevice nicSelector: pfNames: ["ens1"] nodeSelector: node-role.kubernetes.io/worker: "" numVfs: 5 priority: 99 resourceName: sriov_nic_1Create the
SriovNetworkNodePolicyresource by running the following command:$ oc create -f sriov-node-policy.yamlCreate a YAML file that defines the
SriovNetworkresource:Example
sriov-network.yamlfileapiVersion: sriovnetwork.openshift.io/v1 kind: SriovNetwork metadata: name: sriov-nic-1 namespace: openshift-sriov-network-operator spec: linkState: auto networkNamespace: sriov-test resourceName: sriov_nic_1 capabilities: '{ "mac": true, "ips": true }' ipam: '{ "type": "static" }'Create the
SriovNetworkresource by running the following command:$ oc create -f sriov-network.yamlView the node pool you created by running the following command:
$ oc get sriovNetworkpoolConfig -n openshift-sriov-network-operatorExpected output shows the name of the node pool, such as
pool-1, that includes all the node that have theworkerrole and the age of the node pool in seconds, such as67s.Update the number of virtual functions in the
SriovNetworkNodePolicyresource to trigger workload draining in the cluster:$ oc patch SriovNetworkNodePolicy sriov-nic-1 -n openshift-sriov-network-operator --type merge -p '{"spec": {"numVfs": 4}}'Check the draining status on the target cluster by running the following command:
$ oc get sriovNetworkNodeState -n openshift-sriov-network-operatorExample output
NAMESPACE NAME SYNC STATUS DESIRED SYNC STATE CURRENT SYNC STATE AGE openshift-sriov-network-operator worker-0 InProgress Drain_Required DrainComplete 3d10h openshift-sriov-network-operator worker-1 InProgress Drain_Required DrainComplete 3d10hWhen the draining process completes, the
SYNC STATUSchanges toSucceeded, and theDESIRED SYNC STATEandCURRENT SYNC STATEvalues return toIDLE.
18.3.7. Excluding the SR-IOV network topology for NUMA-aware scheduling
To exclude advertising the SR-IOV network resource’s Non-Uniform Memory Access (NUMA) node to the Topology Manager, you can configure the excludeTopology specification in the SriovNetworkNodePolicy custom resource. Use this configuration for more flexible SR-IOV network deployments during NUMA-aware pod scheduling.
Prerequisites
-
You have installed the OpenShift CLI (
oc). -
You have configured the CPU Manager policy to
static. For more information about CPU Manager, see the Additional resources section. -
You have configured the Topology Manager policy to
single-numa-node. - You have installed the SR-IOV Network Operator.
Procedure
Create the
SriovNetworkNodePolicyCR:Save the following YAML in the
sriov-network-node-policy.yamlfile, replacing values in the YAML to match your environment:apiVersion: sriovnetwork.openshift.io/v1 kind: SriovNetworkNodePolicy metadata: name: <policy_name> namespace: openshift-sriov-network-operator spec: resourceName: sriovnuma01 nodeSelector: kubernetes.io/hostname: <node_name> numVfs: <number_of_Vfs> nicSelector:2 vendor: "<vendor_ID>" deviceID: "<device_ID>" deviceType: netdevice excludeTopology: true3 - 1 1
- The resource name of the SR-IOV network device plugin. This YAML uses a sample
resourceNamevalue. - 2
- Identify the device for the Operator to configure by using the network interface controller (NIC selector).
- 3
- To exclude advertising the NUMA node for the SR-IOV network resource to the Topology Manager, set the value to
true. The default value isfalse.
NoteIf many
SriovNetworkNodePolicyresources target the same SR-IOV network resource, theSriovNetworkNodePolicyresources must have the same value as theexcludeTopologyspecification. Otherwise, the conflicting policy is rejected.Create the
SriovNetworkNodePolicyresource by running the following command. Successful output lists the name of theSriovNetworkNodePolicyresource and thecreatedstatus.$ oc create -f sriov-network-node-policy.yaml
Create the
SriovNetworkCR:Save the following YAML in the
sriov-network.yamlfile, replacing values in the YAML to match your environment:apiVersion: sriovnetwork.openshift.io/v1 kind: SriovNetwork metadata: name: sriov-numa-0-network1 namespace: openshift-sriov-network-operator spec: resourceName: sriovnuma02 networkNamespace: <namespace>3 ipam: |-4 { "type": "<ipam_type>", }- 1
- Replace
sriov-numa-0-networkwith the name for the SR-IOV network resource. - 2
- Specify the resource name for the
SriovNetworkNodePolicyCR from the previous step. This YAML uses a sampleresourceNamevalue. - 3
- Enter the namespace for your SR-IOV network resource.
- 4
- Enter the IP address management configuration for the SR-IOV network.
Create the
SriovNetworkresource by running the following command. Successful output lists the name of theSriovNetworkresource and thecreatedstatus.$ oc create -f sriov-network.yaml
Create a pod and assign the SR-IOV network resource from the previous step:
Save the following YAML in the
sriov-network-pod.yamlfile, replacing values in the YAML to match your environment:apiVersion: v1 kind: Pod metadata: name: <pod_name> annotations: k8s.v1.cni.cncf.io/networks: |- [ { "name": "sriov-numa-0-network",1 } ] spec: containers: - name: <container_name> image: <image> imagePullPolicy: IfNotPresent command: ["sleep", "infinity"]- 1
- This is the name of the
SriovNetworkresource that uses theSriovNetworkNodePolicyresource.
Create the
Podresource by running the following command. The expected output shows the name of thePodresource and thecreatedstatus.$ oc create -f sriov-network-pod.yaml
Verification
Verify the status of the pod by running the following command, replacing
<pod_name>with the name of the pod:$ oc get pod <pod_name>Example output
NAME READY STATUS RESTARTS AGE test-deployment-sriov-76cbbf4756-k9v72 1/1 Running 0 45hOpen a debug session with the target pod to verify that the SR-IOV network resources are deployed to a different node than the memory and CPU resources.
Open a debug session with the pod by running the following command, replacing <pod_name> with the target pod name.
$ oc debug pod/<pod_name>Set
/hostas the root directory within the debug shell. The debug pod mounts the root file system from the host in/hostwithin the pod. By changing the root directory to/host, you can run binaries from the host file system:$ chroot /hostView information about the CPU allocation by running the following commands:
$ lscpu | grep NUMAExample output
NUMA node(s): 2 NUMA node0 CPU(s): 0,2,4,6,8,10,12,14,16,18,... NUMA node1 CPU(s): 1,3,5,7,9,11,13,15,17,19,...$ cat /proc/self/status | grep CpusExample output
Cpus_allowed: ffff Cpus_allowed_list: 1,3,5,7The expected output shows the CPUs (1, 3, 5, and 7) that get allocated to a
NUMAnode, such asNUMA node1. The SR-IOV network resource can use the NIC from anotherNUMAnode, such asNUMA node0. Note that theffffhexadecimal value represents the CPU cores that run a process.$ cat /sys/class/net/net1/device/numa_nodeExpected output shows the number for the
NUMAnode, such as0.NoteIf you set the
excludeTopologyspecification toTrue, the required resources might exist in the same NUMA node.
18.4. Configuring an SR-IOV InfiniBand network attachment
You can configure an InfiniBand (IB) network attachment for an Single Root I/O Virtualization (SR-IOV) device in the cluster.
Before you perform any tasks in the following documentation, ensure that you installed the SR-IOV Network Operator.
18.4.1. InfiniBand device configuration object
You can configure an InfiniBand (IB) network device by defining an SriovIBNetwork object.
The following YAML describes an SriovIBNetwork object:
apiVersion: sriovnetwork.openshift.io/v1
kind: SriovIBNetwork
metadata:
name: <name>
namespace: openshift-sriov-network-operator
spec:
resourceName: <sriov_resource_name>
networkNamespace: <target_namespace>
ipam: |-
{}
linkState: <link_state>
capabilities: <capabilities>where:
name-
A name for the object. The SR-IOV Network Operator creates a
NetworkAttachmentDefinitionobject with same name. namespace- The namespace where the SR-IOV Operator is installed.
resourceName-
The value for the
spec.resourceNameparameter from theSriovNetworkNodePolicyobject that defines the SR-IOV hardware for this additional network. networkNamespace-
The target namespace for the
SriovIBNetworkobject. Only pods in the target namespace can attach to the network device. ipam- Optional parameter. A configuration object for the IPAM CNI plugin as a YAML block scalar. The plugin manages IP address assignment for the attachment definition.
linkState-
Optional parameter. The link state of virtual function (VF). Allowed values are
enable,disableandauto. capabilities-
Optional parameter. The capabilities to configure for this network. You can specify
'{ "ips": true }'to enable IP address support or'{ "infinibandGUID": true }'to enable IB Global Unique Identifier (GUID) support.
18.4.1.1. Creating a configuration for assignment of dual-stack IP addresses dynamically
You can dynamically assign dual-stack IP addresses to a secondary network so that pods can communicate over both IPv4 and IPv6 addresses.
You can configure the following IP address assignment types in the ipRanges parameter:
- IPv4 addresses
- IPv6 addresses
- multiple IP address assignment
Procedure
-
Set
typetowhereabouts. Use
ipRangesto allocate IP addresses as shown in the following example:cniVersion: operator.openshift.io/v1 kind: Network metadata: name: cluster spec: additionalNetworks: - name: whereabouts-shim namespace: default type: Raw rawCNIConfig: |- { "name": "whereabouts-dual-stack", "cniVersion": "0.3.1, "type": "bridge", "ipam": { "type": "whereabouts", "ipRanges": [ {"range": "192.168.10.0/24"}, {"range": "2001:db8::/64"} ] } }- Attach the secondary network to a pod. For more information, see "Adding a pod to a secondary network".
Verification
Verify that all IP addresses got assigned to the network interfaces within the network namespace of a pod by entering the following command:
$ oc exec -it <pod_name> -- ip awhere:
<podname>- The name of the pod.
18.4.1.2. Configuration of IP address assignment for a network attachment
For secondary networks, you can assign IP addresses by using an IP Address Management (IPAM) CNI plugin, which supports various assignment methods, including Dynamic Host Configuration Protocol (DHCP) and static assignment.
You can use the following IP address assignment types:
- Static assignment.
- Dynamic assignment through a DHCP server. The DHCP server you specify must be reachable from the additional network.
- Dynamic assignment through the Whereabouts IPAM CNI plugin.
18.4.1.2.1. Static IP address assignment configuration
The following table describes the configuration for static IP address assignment:
| Field | Type | Description |
|---|---|---|
|
|
|
The IPAM address type. The value |
|
|
| An array of objects specifying IP addresses to assign to the virtual interface. Both IPv4 and IPv6 IP addresses are supported. |
|
|
| An array of objects specifying routes to configure inside the pod. |
|
|
| Optional: An array of objects specifying the DNS configuration. |
The addresses array requires objects with the following fields:
| Field | Type | Description |
|---|---|---|
|
|
|
An IP address and network prefix that you specify. For example, if you specify |
|
|
| The default gateway to route egress network traffic to. |
| Field | Type | Description |
|---|---|---|
|
|
|
The IP address range in CIDR format, such as |
|
|
| The gateway that routes network traffic. |
| Field | Type | Description |
|---|---|---|
|
|
| An array of one or more IP addresses where DNS queries get sent. |
|
|
|
The default domain to append to a hostname. For example, if the domain is set to |
|
|
|
An array of domain names to append to an unqualified hostname, such as |
Static IP address assignment configuration example
{
"ipam": {
"type": "static",
"addresses": [
{
"address": "191.168.1.7/24"
}
]
}
}18.4.1.2.2. Dynamic IP address (DHCP) assignment configuration
A pod obtains its original DHCP lease when the pod gets created. The lease must be periodically renewed by a minimal DHCP server deployment running on the cluster.
For an Ethernet network attachment, the SR-IOV Network Operator does not create a DHCP server deployment; the Cluster Network Operator is responsible for creating the minimal DHCP server deployment.
To trigger the deployment of the DHCP server, you must create a shim network attachment by editing the Cluster Network Operator configuration, as in the following example:
Example shim network attachment definition
apiVersion: operator.openshift.io/v1
kind: Network
metadata:
name: cluster
spec:
additionalNetworks:
- name: dhcp-shim
namespace: default
type: Raw
rawCNIConfig: |-
{
"name": "dhcp-shim",
"cniVersion": "0.3.1",
"type": "bridge",
"ipam": {
"type": "dhcp"
}
}
# ...where:
type- Specifies dynamic IP address assignment for the cluster.
The following table describes the configuration parameters for dynamic IP address address assignment with DHCP.
| Field | Type | Description |
|---|---|---|
|
|
|
The IPAM address type. The value |
The following JSON example describes the configuration p for dynamic IP address address assignment with DHCP.
Dynamic IP address (DHCP) assignment configuration example
{
"ipam": {
"type": "dhcp"
}
}18.4.1.2.3. Dynamic IP address assignment configuration with Whereabouts
The Whereabouts CNI plugin allows the dynamic assignment of an IP address to an additional network without the use of a DHCP server.
The Whereabouts CNI plugin also supports overlapping IP address ranges and configuration of the same CIDR range multiple times within separate NetworkAttachmentDefinition CRDs. This provides greater flexibility and management capabilities in multi-tenant environments.
18.4.1.2.3.1. Dynamic IP address configuration objects
The following table describes the configuration objects for dynamic IP address assignment with Whereabouts:
| Field | Type | Description |
|---|---|---|
|
|
|
The IPAM address type. The value |
|
|
| An IP address and range in CIDR notation. IP addresses are assigned from within this range of addresses. |
|
|
| Optional: A list of zero or more IP addresses and ranges in CIDR notation. IP addresses within an excluded address range are not assigned. |
|
|
| Optional: Helps ensure that each group or domain of pods gets its own set of IP addresses, even if they share the same range of IP addresses. Setting this field is important for keeping networks separate and organized, notably in multi-tenant environments. |
18.4.1.2.3.2. Dynamic IP address assignment configuration that uses Whereabouts
The following example shows a dynamic address assignment configuration that uses Whereabouts:
Whereabouts dynamic IP address assignment
{
"ipam": {
"type": "whereabouts",
"range": "192.0.2.192/27",
"exclude": [
"192.0.2.192/30",
"192.0.2.196/32"
]
}
}18.4.1.2.3.3. Dynamic IP address assignment that uses Whereabouts with overlapping IP address ranges
The following example shows a dynamic IP address assignment that uses overlapping IP address ranges for multi-tenant networks.
NetworkAttachmentDefinition 1
{
"ipam": {
"type": "whereabouts",
"range": "192.0.2.192/29",
"network_name": "example_net_common",
}
}- 1
- Optional. If set, must match the
network_nameofNetworkAttachmentDefinition 2.
NetworkAttachmentDefinition 2
{
"ipam": {
"type": "whereabouts",
"range": "192.0.2.192/24",
"network_name": "example_net_common",
}
}- 1
- Optional. If set, must match the
network_nameofNetworkAttachmentDefinition 1.
18.4.2. Configuring SR-IOV additional network
You can configure an additional network that uses SR-IOV hardware by creating an SriovIBNetwork object. When you create an SriovIBNetwork object, the SR-IOV Network Operator automatically creates a NetworkAttachmentDefinition object.
Do not modify or delete an SriovIBNetwork object if it is attached to any pods in a running state.
Prerequisites
-
Install the OpenShift CLI (
oc). -
Log in as a user with
cluster-adminprivileges.
Procedure
Create a
SriovIBNetworkobject, and then save the YAML in the<name>.yamlfile, where<name>is a name for this additional network. The object specification might resemble the following example:apiVersion: sriovnetwork.openshift.io/v1 kind: SriovIBNetwork metadata: name: attach1 namespace: openshift-sriov-network-operator spec: resourceName: net1 networkNamespace: project2 ipam: |- { "type": "host-local", "subnet": "10.56.217.0/24", "rangeStart": "10.56.217.171", "rangeEnd": "10.56.217.181", "gateway": "10.56.217.1" }To create the object, enter the following command:
$ oc create -f <name>.yamlwhere:
<name>- Specifies the name of the additional network.
Optional: To confirm that the
NetworkAttachmentDefinitionobject that is associated with theSriovIBNetworkobject that you created in the previous step exists, enter the following command. Replace<namespace>with thenetworkNamespacevalue you specified in theSriovIBNetworkobject.$ oc get net-attach-def -n <namespace>
18.4.3. Runtime configuration for an InfiniBand-based SR-IOV attachment
When attaching a pod to an additional network, you can specify a runtime configuration to make specific customizations for the pod. For example, you can request a specific MAC hardware address.
You specify the runtime configuration by setting an annotation in the pod specification. The annotation key is k8s.v1.cni.cncf.io/networks, and it accepts a JSON object that describes the runtime configuration.
The following JSON describes the runtime configuration options for an InfiniBand-based SR-IOV network attachment.
[
{
"name": "<network_attachment>",
"infiniband-guid": "<guid>",
"ips": ["<cidr_range>"]
}
]where:
name- The name of the SR-IOV network attachment definition CR.
infiniband-guid-
The InfiniBand GUID for the SR-IOV device. To use this feature, you also must specify
{ "infinibandGUID": true }in theSriovIBNetworkobject. ips-
The IP addresses for the SR-IOV device that is allocated from the resource type defined in the SR-IOV network attachment definition CR. Both IPv4 and IPv6 addresses are supported. To use this feature, you also must specify
{ "ips": true }in theSriovIBNetworkobject.
apiVersion: v1
kind: Pod
metadata:
name: sample-pod
annotations:
k8s.v1.cni.cncf.io/networks: |-
[
{
"name": "ib1",
"infiniband-guid": "c2:11:22:33:44:55:66:77",
"ips": ["192.168.10.1/24", "2001::1/64"]
}
]
spec:
containers:
- name: sample-container
image: <image>
imagePullPolicy: IfNotPresent
command: ["sleep", "infinity"]18.4.4. Adding a pod to an additional network
To enable a pod to use additional network interfaces in OpenShift Container Platform, you can attach the pod to a secondary network. The pod continues to send normal cluster-related network traffic over the default network.
When a pod is created, a secondary network is attached to the pod. However, if a pod already exists, you cannot attach a secondary network to it.
The pod must be in the same namespace as the additional network.
Prerequisites
-
Install the OpenShift CLI (
oc). - Log in to the cluster.
Procedure
Add an annotation to the
Podobject. Only one of the following annotation formats can be used:To attach a secondary network without any customization, add an annotation with the following format:
metadata: annotations: k8s.v1.cni.cncf.io/networks: <network>[,<network>,...]where:
k8s.v1.cni.cncf.io/networks- Specifies the name of the secondary network to associate with the pod. To specify more than one secondary network, separate each network with a comma. Do not include whitespace between the comma. If you specify the same secondary network multiple times, that pod will have multiple network interfaces attached to that network.
To attach a secondary network with customizations, add an annotation with the following format:
metadata: annotations: k8s.v1.cni.cncf.io/networks: |- [ { "name": "<network>", "namespace": "<namespace>", "default-route": ["<default_route>"] } ]where:
<network>-
Specifies the name of the secondary network defined by a
NetworkAttachmentDefinitionobject. <namespace>-
Specifies the namespace where the
NetworkAttachmentDefinitionobject is defined. <default-route>-
Optional parameter. Specifies an override for the default route, such as
192.168.17.1.
Create the pod by entering the following command.
$ oc create -f <name>.yamlReplace
<name>with the name of the pod.Optional: Confirm that the annotation exists in the
podCR by entering the following command. Replace<name>with the name of the pod.$ oc get pod <name> -o yamlIn the following example, the
example-podpod is attached to thenet1additional network:$ oc get pod example-pod -o yaml apiVersion: v1 kind: Pod metadata: annotations: k8s.v1.cni.cncf.io/networks: macvlan-bridge k8s.v1.cni.cncf.io/network-status: |- [{ "name": "openshift-sdn", "interface": "eth0", "ips": [ "10.128.2.14" ], "default": true, "dns": {} },{ "name": "macvlan-bridge", "interface": "net1", "ips": [ "20.2.2.100" ], "mac": "22:2f:60:a5:f8:00", "dns": {} }] name: example-pod namespace: default spec: ... status: ...where:
k8s.v1.cni.cncf.io/network-status- Specifies a JSON array of objects. Each object describes the status of a secondary network attached to the pod. The annotation value is stored as a plain text value.
18.5. Configuring interface-level network sysctl settings and all-multicast mode for SR-IOV networks
As a cluster administrator, you can change interface-level network sysctls and several interface attributes such as promiscuous mode, all-multicast mode, MTU, and MAC address by using the tuning Container Network Interface (CNI) meta plugin for a pod connected to a SR-IOV network device.
Before you perform any tasks in the following documentation, ensure that you installed the SR-IOV Network Operator.
18.5.1. Labeling nodes with an SR-IOV enabled NIC
If you want to enable SR-IOV on only SR-IOV capable nodes there are a couple of ways to do this:
-
Install the Node Feature Discovery (NFD) Operator. NFD detects the presence of SR-IOV enabled NICs and labels the nodes with
node.alpha.kubernetes-incubator.io/nfd-network-sriov.capable = true. Examine the
SriovNetworkNodeStateCR for each node. Theinterfacesstanza includes a list of all of the SR-IOV devices discovered by the SR-IOV Network Operator on the worker node. Label each node withfeature.node.kubernetes.io/network-sriov.capable: "true"by using the following command:$ oc label node <node_name> feature.node.kubernetes.io/network-sriov.capable="true"NoteYou can label the nodes with whatever name you want.
18.5.2. Setting one sysctl flag
You can set interface-level network sysctl settings for a pod connected to a SR-IOV network device.
In this example, net.ipv4.conf.IFNAME.accept_redirects is set to 1 on the created virtual interfaces.
The sysctl-tuning-test is a namespace used in this example.
Use the following command to create the
sysctl-tuning-testnamespace:$ oc create namespace sysctl-tuning-test
18.5.2.1. Setting one sysctl flag on nodes with SR-IOV network devices
The SR-IOV Network Operator adds the SriovNetworkNodePolicy.sriovnetwork.openshift.io custom resource definition (CRD) to OpenShift Container Platform. You can configure an SR-IOV network device by creating a SriovNetworkNodePolicy custom resource (CR).
When applying the configuration specified in a SriovNetworkNodePolicy object, the SR-IOV Operator might drain and reboot the nodes.
It can take several minutes for a configuration change to apply.
Follow this procedure to create a SriovNetworkNodePolicy custom resource (CR).
Procedure
Create an
SriovNetworkNodePolicycustom resource (CR). For example, save the following YAML as the filepolicyoneflag-sriov-node-network.yaml:apiVersion: sriovnetwork.openshift.io/v1 kind: SriovNetworkNodePolicy metadata: name: policyoneflag1 namespace: openshift-sriov-network-operator2 spec: resourceName: policyoneflag3 nodeSelector:4 feature.node.kubernetes.io/network-sriov.capable="true" priority: 105 numVfs: 56 nicSelector:7 pfNames: ["ens5"]8 deviceType: "netdevice"9 isRdma: false10 - 1
- The name for the custom resource object.
- 2
- The namespace where the SR-IOV Network Operator is installed.
- 3
- The resource name of the SR-IOV network device plugin. You can create multiple SR-IOV network node policies for a resource name.
- 4
- The node selector specifies the nodes to configure. Only SR-IOV network devices on the selected nodes are configured. The SR-IOV Container Network Interface (CNI) plugin and device plugin are deployed on selected nodes only.
- 5
- Optional: The priority is an integer value between
0and99. A smaller value receives higher priority. For example, a priority of10is a higher priority than99. The default value is99. - 6
- The number of the virtual functions (VFs) to create for the SR-IOV physical network device. For an Intel network interface controller (NIC), the number of VFs cannot be larger than the total VFs supported by the device. For a Mellanox NIC, the number of VFs cannot be larger than
127. - 7
- The NIC selector identifies the device for the Operator to configure. You do not have to specify values for all the parameters. It is recommended to identify the network device with enough precision to avoid selecting a device unintentionally. If you specify
rootDevices, you must also specify a value forvendor,deviceID, orpfNames. If you specify bothpfNamesandrootDevicesat the same time, ensure that they refer to the same device. If you specify a value fornetFilter, then you do not need to specify any other parameter because a network ID is unique. - 8
- Optional: An array of one or more physical function (PF) names for the device.
- 9
- Optional: The driver type for the virtual functions. The only allowed value is
netdevice. For a Mellanox NIC to work in DPDK mode on bare metal nodes, setisRdmatotrue. - 10
- Optional: Configures whether to enable remote direct memory access (RDMA) mode. The default value is
false. If theisRdmaparameter is set totrue, you can continue to use the RDMA-enabled VF as a normal network device. A device can be used in either mode. SetisRdmatotrueand additionally setneedVhostNettotrueto configure a Mellanox NIC for use with Fast Datapath DPDK applications.
NoteThe
vfio-pcidriver type is not supported.Create the
SriovNetworkNodePolicyobject:$ oc create -f policyoneflag-sriov-node-network.yamlAfter applying the configuration update, all the pods in
sriov-network-operatornamespace change to theRunningstatus.To verify that the SR-IOV network device is configured, enter the following command. Replace
<node_name>with the name of a node with the SR-IOV network device that you just configured. Expected output showsSucceeded.$ oc get sriovnetworknodestates -n openshift-sriov-network-operator <node_name> -o jsonpath='{.status.syncStatus}'
18.5.2.2. Configuring sysctl on a SR-IOV network
You can set interface specific sysctl settings on virtual interfaces created by SR-IOV by adding the tuning configuration to the optional metaPlugins parameter of the SriovNetwork resource.
The SR-IOV Network Operator manages additional network definitions. When you specify an additional SR-IOV network to create, the SR-IOV Network Operator creates the NetworkAttachmentDefinition custom resource (CR) automatically.
Do not edit NetworkAttachmentDefinition custom resources that the SR-IOV Network Operator manages. Doing so might disrupt network traffic on your additional network.
To change the interface-level network net.ipv4.conf.IFNAME.accept_redirects sysctl settings, create an additional SR-IOV network with the Container Network Interface (CNI) tuning plugin.
Prerequisites
- Install the OpenShift Container Platform CLI (oc).
- Log in to the OpenShift Container Platform cluster as a user with cluster-admin privileges.
Procedure
Create the
SriovNetworkcustom resource (CR) for the additional SR-IOV network attachment and insert themetaPluginsconfiguration, as in the following example CR. Save the YAML as the filesriov-network-interface-sysctl.yaml.apiVersion: sriovnetwork.openshift.io/v1 kind: SriovNetwork metadata: name: onevalidflag1 namespace: openshift-sriov-network-operator2 spec: resourceName: policyoneflag3 networkNamespace: sysctl-tuning-test4 ipam: '{ "type": "static" }'5 capabilities: '{ "mac": true, "ips": true }'6 metaPlugins : |7 { "type": "tuning", "capabilities":{ "mac":true }, "sysctl":{ "net.ipv4.conf.IFNAME.accept_redirects": "1" } }- 1
- A name for the object. The SR-IOV Network Operator creates a NetworkAttachmentDefinition object with same name.
- 2
- The namespace where the SR-IOV Network Operator is installed.
- 3
- The value for the
spec.resourceNameparameter from theSriovNetworkNodePolicyobject that defines the SR-IOV hardware for this additional network. - 4
- The target namespace for the
SriovNetworkobject. Only pods in the target namespace can attach to the additional network. - 5
- A configuration object for the IPAM CNI plugin as a YAML block scalar. The plugin manages IP address assignment for the attachment definition.
- 6
- Optional: Set capabilities for the additional network. You can specify
"{ "ips": true }"to enable IP address support or"{ "mac": true }"to enable MAC address support. - 7
- Optional: The metaPlugins parameter is used to add additional capabilities to the device. In this use case set the
typefield totuning. Specify the interface-level networksysctlyou want to set in thesysctlfield.
Create the
SriovNetworkresource:$ oc create -f sriov-network-interface-sysctl.yaml
Verifying that the NetworkAttachmentDefinition CR is successfully created
Confirm that the SR-IOV Network Operator created the
NetworkAttachmentDefinitionCR by running the following command:$ oc get network-attachment-definitions -n <namespace>1 - 1
- Replace
<namespace>with the value fornetworkNamespacethat you specified in theSriovNetworkobject. For example,sysctl-tuning-test. The expected output shows the name of the NAD CRD and the creation age in minutes.
NoteThere might be a delay before the SR-IOV Network Operator creates the CR.
Verifying that the additional SR-IOV network attachment is successful
To verify that the tuning CNI is correctly configured and the additional SR-IOV network attachment is attached, do the following:
Create a
PodCR. Save the following YAML as the fileexamplepod.yaml:apiVersion: v1 kind: Pod metadata: name: tunepod namespace: sysctl-tuning-test annotations: k8s.v1.cni.cncf.io/networks: |- [ { "name": "onevalidflag",1 "mac": "0a:56:0a:83:04:0c",2 "ips": ["10.100.100.200/24"]3 } ] spec: containers: - name: podexample image: centos command: ["/bin/bash", "-c", "sleep INF"] securityContext: runAsUser: 2000 runAsGroup: 3000 allowPrivilegeEscalation: false capabilities: drop: ["ALL"] securityContext: runAsNonRoot: true seccompProfile: type: RuntimeDefault- 1
- The name of the SR-IOV network attachment definition CR.
- 2
- Optional: The MAC address for the SR-IOV device that is allocated from the resource type defined in the SR-IOV network attachment definition CR. To use this feature, you also must specify
{ "mac": true }in the SriovNetwork object. - 3
- Optional: IP addresses for the SR-IOV device that are allocated from the resource type defined in the SR-IOV network attachment definition CR. Both IPv4 and IPv6 addresses are supported. To use this feature, you also must specify
{ "ips": true }in theSriovNetworkobject.
Create the
PodCR:$ oc apply -f examplepod.yamlVerify that the pod is created by running the following command:
$ oc get pod -n sysctl-tuning-testExample output
NAME READY STATUS RESTARTS AGE tunepod 1/1 Running 0 47sLog in to the pod by running the following command:
$ oc rsh -n sysctl-tuning-test tunepodVerify the values of the configured sysctl flag. Find the value
net.ipv4.conf.IFNAME.accept_redirectsby running the following command::$ sysctl net.ipv4.conf.net1.accept_redirects
18.5.3. Configuring sysctl settings for pods associated with bonded SR-IOV interface flag
You can set interface-level network sysctl settings for a pod connected to a bonded SR-IOV network device.
In this example, the specific network interface-level sysctl settings that can be configured are set on the bonded interface.
The sysctl-tuning-test is a namespace used in this example.
Use the following command to create the
sysctl-tuning-testnamespace:$ oc create namespace sysctl-tuning-test
18.5.3.1. Setting all sysctl flag on nodes with bonded SR-IOV network devices
The SR-IOV Network Operator adds the SriovNetworkNodePolicy.sriovnetwork.openshift.io custom resource definition (CRD) to OpenShift Container Platform. You can configure an SR-IOV network device by creating a SriovNetworkNodePolicy custom resource (CR).
When applying the configuration specified in a SriovNetworkNodePolicy object, the SR-IOV Operator might drain the nodes, and in some cases, reboot nodes.
It might take several minutes for a configuration change to apply.
Follow this procedure to create a SriovNetworkNodePolicy custom resource (CR).
Procedure
Create an
SriovNetworkNodePolicycustom resource (CR). Save the following YAML as the filepolicyallflags-sriov-node-network.yaml. Replacepolicyallflagswith the name for the configuration.apiVersion: sriovnetwork.openshift.io/v1 kind: SriovNetworkNodePolicy metadata: name: policyallflags1 namespace: openshift-sriov-network-operator2 spec: resourceName: policyallflags3 nodeSelector:4 node.alpha.kubernetes-incubator.io/nfd-network-sriov.capable = `true` priority: 105 numVfs: 56 nicSelector:7 pfNames: ["ens1f0"]8 deviceType: "netdevice"9 isRdma: false10 - 1
- The name for the custom resource object.
- 2
- The namespace where the SR-IOV Network Operator is installed.
- 3
- The resource name of the SR-IOV network device plugin. You can create multiple SR-IOV network node policies for a resource name.
- 4
- The node selector specifies the nodes to configure. Only SR-IOV network devices on the selected nodes are configured. The SR-IOV Container Network Interface (CNI) plugin and device plugin are deployed on selected nodes only.
- 5
- Optional: The priority is an integer value between
0and99. A smaller value receives higher priority. For example, a priority of10is a higher priority than99. The default value is99. - 6
- The number of virtual functions (VFs) to create for the SR-IOV physical network device. For an Intel network interface controller (NIC), the number of VFs cannot be larger than the total VFs supported by the device. For a Mellanox NIC, the number of VFs cannot be larger than
127. - 7
- The NIC selector identifies the device for the Operator to configure. You do not have to specify values for all the parameters. It is recommended to identify the network device with enough precision to avoid selecting a device unintentionally. If you specify
rootDevices, you must also specify a value forvendor,deviceID, orpfNames. If you specify bothpfNamesandrootDevicesat the same time, ensure that they refer to the same device. If you specify a value fornetFilter, then you do not need to specify any other parameter because a network ID is unique. - 8
- Optional: An array of one or more physical function (PF) names for the device.
- 9
- Optional: The driver type for the virtual functions. The only allowed value is
netdevice. For a Mellanox NIC to work in DPDK mode on bare metal nodes, setisRdmatotrue. - 10
- Optional: Configures whether to enable remote direct memory access (RDMA) mode. The default value is
false. If theisRdmaparameter is set totrue, you can continue to use the RDMA-enabled VF as a normal network device. A device can be used in either mode. SetisRdmatotrueand additionally setneedVhostNettotrueto configure a Mellanox NIC for use with Fast Datapath DPDK applications.
NoteThe
vfio-pcidriver type is not supported.Create the SriovNetworkNodePolicy object:
$ oc create -f policyallflags-sriov-node-network.yamlAfter applying the configuration update, all the pods in sriov-network-operator namespace change to the
Runningstatus.To verify that the SR-IOV network device is configured, enter the following command. Replace
<node_name>with the name of a node with the SR-IOV network device that you just configured. Expected output showsSucceeded$ oc get sriovnetworknodestates -n openshift-sriov-network-operator <node_name> -o jsonpath='{.status.syncStatus}'
18.5.3.2. Configuring sysctl on a bonded SR-IOV network
You can set interface specific sysctl settings on a bonded interface created from two SR-IOV interfaces. Do this by adding the tuning configuration to the optional Plugins parameter of the bond network attachment definition.
Do not edit NetworkAttachmentDefinition custom resources that the SR-IOV Network Operator manages. Doing so might disrupt network traffic on your additional network.
To change specific interface-level network sysctl settings create the SriovNetwork custom resource (CR) with the Container Network Interface (CNI) tuning plugin by using the following procedure.
Prerequisites
- Install the OpenShift Container Platform CLI (oc).
- Log in to the OpenShift Container Platform cluster as a user with cluster-admin privileges.
Procedure
Create the
SriovNetworkcustom resource (CR) for the bonded interface as in the following example CR. Save the YAML as the filesriov-network-attachment.yaml.apiVersion: sriovnetwork.openshift.io/v1 kind: SriovNetwork metadata: name: allvalidflags1 namespace: openshift-sriov-network-operator2 spec: resourceName: policyallflags3 networkNamespace: sysctl-tuning-test4 capabilities: '{ "mac": true, "ips": true }'5 - 1
- A name for the object. The SR-IOV Network Operator creates a NetworkAttachmentDefinition object with same name.
- 2
- The namespace where the SR-IOV Network Operator is installed.
- 3
- The value for the
spec.resourceNameparameter from theSriovNetworkNodePolicyobject that defines the SR-IOV hardware for this additional network. - 4
- The target namespace for the
SriovNetworkobject. Only pods in the target namespace can attach to the additional network. - 5
- Optional: The capabilities to configure for this additional network. You can specify
"{ "ips": true }"to enable IP address support or"{ "mac": true }"to enable MAC address support.
Create the
SriovNetworkresource:$ oc create -f sriov-network-attachment.yamlCreate a bond network attachment definition as in the following example CR. Save the YAML as the file
sriov-bond-network-interface.yaml.apiVersion: "k8s.cni.cncf.io/v1" kind: NetworkAttachmentDefinition metadata: name: bond-sysctl-network namespace: sysctl-tuning-test spec: config: '{ "cniVersion":"0.4.0", "name":"bound-net", "plugins":[ { "type":"bond",1 "mode": "active-backup",2 "failOverMac": 1,3 "linksInContainer": true,4 "miimon": "100", "links": [5 {"name": "net1"}, {"name": "net2"} ], "ipam":{6 "type":"static" } }, { "type":"tuning",7 "capabilities":{ "mac":true }, "sysctl":{ "net.ipv4.conf.IFNAME.accept_redirects": "0", "net.ipv4.conf.IFNAME.accept_source_route": "0", "net.ipv4.conf.IFNAME.disable_policy": "1", "net.ipv4.conf.IFNAME.secure_redirects": "0", "net.ipv4.conf.IFNAME.send_redirects": "0", "net.ipv6.conf.IFNAME.accept_redirects": "0", "net.ipv6.conf.IFNAME.accept_source_route": "1", "net.ipv6.neigh.IFNAME.base_reachable_time_ms": "20000", "net.ipv6.neigh.IFNAME.retrans_time_ms": "2000" } } ] }'- 1
- The type is
bond. - 2
- The
modeattribute specifies the bonding mode. The bonding modes supported are:-
balance-rr- 0 -
active-backup- 1 balance-xor- 2For
balance-rrorbalance-xormodes, you must set thetrustmode toonfor the SR-IOV virtual function.
-
- 3
- The
failoverattribute is mandatory for active-backup mode. - 4
- The
linksInContainer=trueflag informs the Bond CNI that the required interfaces are to be found inside the container. By default, Bond CNI looks for these interfaces on the host which does not work for integration with SRIOV and Multus. - 5
- The
linkssection defines which interfaces will be used to create the bond. By default, Multus names the attached interfaces as: "net", plus a consecutive number, starting with one. - 6
- A configuration object for the IPAM CNI plugin as a YAML block scalar. The plugin manages IP address assignment for the attachment definition. In this pod example IP addresses are configured manually, so in this case,
ipamis set to static. - 7
- Add additional capabilities to the device. For example, set the
typefield totuning. Specify the interface-level networksysctlyou want to set in the sysctl field. This example sets all interface-level networksysctlsettings that can be set.
Create the bond network attachment resource:
$ oc create -f sriov-bond-network-interface.yaml
Verifying that the NetworkAttachmentDefinition CR is successfully created
Confirm that the SR-IOV Network Operator created the
NetworkAttachmentDefinitionCR by running the following command:$ oc get network-attachment-definitions -n <namespace>1 - 1
- Replace
<namespace>with the networkNamespace that you specified when configuring the network attachment, for example,sysctl-tuning-test. Expected output shows the names of the NAD CRDs and the creation age in minutes.
NoteThere might be a delay before the SR-IOV Network Operator creates the CR.
Verifying that the additional SR-IOV network resource is successful
To verify that the tuning CNI is correctly configured and the additional SR-IOV network attachment is attached, do the following:
Create a
PodCR. For example, save the following YAML as the fileexamplepod.yaml:apiVersion: v1 kind: Pod metadata: name: tunepod namespace: sysctl-tuning-test annotations: k8s.v1.cni.cncf.io/networks: |- [ {"name": "allvalidflags"},1 {"name": "allvalidflags"}, { "name": "bond-sysctl-network", "interface": "bond0", "mac": "0a:56:0a:83:04:0c",2 "ips": ["10.100.100.200/24"]3 } ] spec: containers: - name: podexample image: centos command: ["/bin/bash", "-c", "sleep INF"] securityContext: runAsUser: 2000 runAsGroup: 3000 allowPrivilegeEscalation: false capabilities: drop: ["ALL"] securityContext: runAsNonRoot: true seccompProfile: type: RuntimeDefault- 1
- The name of the SR-IOV network attachment definition CR.
- 2
- Optional: The MAC address for the SR-IOV device that is allocated from the resource type defined in the SR-IOV network attachment definition CR. To use this feature, you also must specify
{ "mac": true }in the SriovNetwork object. - 3
- Optional: IP addresses for the SR-IOV device that are allocated from the resource type defined in the SR-IOV network attachment definition CR. Both IPv4 and IPv6 addresses are supported. To use this feature, you also must specify
{ "ips": true }in theSriovNetworkobject.
Apply the YAML:
$ oc apply -f examplepod.yamlVerify that the pod is created by running the following command:
$ oc get pod -n sysctl-tuning-testExample output
NAME READY STATUS RESTARTS AGE tunepod 1/1 Running 0 47sLog in to the pod by running the following command:
$ oc rsh -n sysctl-tuning-test tunepodVerify the values of the configured
sysctlflag. Find the valuenet.ipv6.neigh.IFNAME.base_reachable_time_msby running the following command:$ sysctl net.ipv6.neigh.bond0.base_reachable_time_ms
18.5.4. About all-multicast mode
Enabling all-multicast mode, particularly in the context of rootless applications, is critical. If you do not enable this mode, you would be required to grant the NET_ADMIN capability to the pod’s Security Context Constraints (SCC). If you were to allow the NET_ADMIN capability to grant the pod privileges to make changes that extend beyond its specific requirements, you could potentially expose security vulnerabilities.
The tuning CNI plugin supports changing several interface attributes, including all-multicast mode. By enabling this mode, you can allow applications running on Virtual Functions (VFs) that are configured on a SR-IOV network device to receive multicast traffic from applications on other VFs, whether attached to the same or different physical functions.
18.5.4.1. Enabling the all-multicast mode on an SR-IOV network
You can enable the all-multicast mode on an SR-IOV interface by:
-
Adding the tuning configuration to the
metaPluginsparameter of theSriovNetworkresource Setting the
allmultifield totruein the tuning configurationNoteEnsure that you create the virtual function (VF) with trust enabled.
The SR-IOV Network Operator manages additional network definitions. When you specify an additional SR-IOV network to create, the SR-IOV Network Operator creates the NetworkAttachmentDefinition custom resource (CR) automatically.
Do not edit NetworkAttachmentDefinition custom resources that the SR-IOV Network Operator manages. Doing so might disrupt network traffic on your additional network.
Enable the all-multicast mode on a SR-IOV network by following this guidance.
Prerequisites
- You have installed the OpenShift Container Platform CLI (oc).
-
You are logged in to the OpenShift Container Platform cluster as a user with
cluster-adminprivileges. - You have installed the SR-IOV Network Operator.
-
You have configured an appropriate
SriovNetworkNodePolicyobject.
Procedure
Create a YAML file with the following settings that defines a
SriovNetworkNodePolicyobject for a Mellanox ConnectX-5 device. Save the YAML file assriovnetpolicy-mlx.yaml.apiVersion: sriovnetwork.openshift.io/v1 kind: SriovNetworkNodePolicy metadata: name: sriovnetpolicy-mlx namespace: openshift-sriov-network-operator spec: deviceType: netdevice nicSelector: deviceID: "1017" pfNames: - ens8f0np0#0-9 rootDevices: - 0000:d8:00.0 vendor: "15b3" nodeSelector: feature.node.kubernetes.io/network-sriov.capable: "true" numVfs: 10 priority: 99 resourceName: resourcemlx-
Optional: If the SR-IOV capable cluster nodes are not already labeled, add the
SriovNetworkNodePolicy.Spec.NodeSelectorlabel. For more information about labeling nodes, see "Understanding how to update labels on nodes". Create the
SriovNetworkNodePolicyobject by running the following command:$ oc create -f sriovnetpolicy-mlx.yamlAfter applying the configuration update, all the pods in the
sriov-network-operatornamespace automatically move to aRunningstatus.Create the
enable-allmulti-testnamespace by running the following command:$ oc create namespace enable-allmulti-testCreate the
SriovNetworkcustom resource (CR) for the additional SR-IOV network attachment and insert themetaPluginsconfiguration, as in the following example CR YAML, and save the file assriov-enable-all-multicast.yaml.apiVersion: sriovnetwork.openshift.io/v1 kind: SriovNetwork metadata: name: enableallmulti1 namespace: openshift-sriov-network-operator2 spec: resourceName: enableallmulti3 networkNamespace: enable-allmulti-test4 ipam: '{ "type": "static" }'5 capabilities: '{ "mac": true, "ips": true }'6 trust: "on"7 metaPlugins : |8 { "type": "tuning", "capabilities":{ "mac":true }, "allmulti": true } }- 1
- Specify a name for the object. The SR-IOV Network Operator creates a
NetworkAttachmentDefinitionobject with the same name. - 2
- Specify the namespace where the SR-IOV Network Operator is installed.
- 3
- Specify a value for the
spec.resourceNameparameter from theSriovNetworkNodePolicyobject that defines the SR-IOV hardware for this additional network. - 4
- Specify the target namespace for the
SriovNetworkobject. Only pods in the target namespace can attach to the additional network. - 5
- Specify a configuration object for the IPAM CNI plugin as a YAML block scalar. The plugin manages IP address assignment for the attachment definition.
- 6
- Optional: Set capabilities for the additional network. You can specify
"{ "ips": true }"to enable IP address support or"{ "mac": true }"to enable MAC address support. - 7
- Specify the trust mode of the virtual function. This must be set to "on".
- 8
- Add more capabilities to the device by using the
metaPluginsparameter. In this use case, set thetypefield totuning, and add theallmultifield and set it totrue.
Create the
SriovNetworkresource by running the following command:$ oc create -f sriov-enable-all-multicast.yaml
Verification of the NetworkAttachmentDefinition CR
Confirm that the SR-IOV Network Operator created the
NetworkAttachmentDefinitionCR by running the following command:$ oc get network-attachment-definitions -n <namespace>1 - 1
- Replace
<namespace>with the value fornetworkNamespacethat you specified in theSriovNetworkobject. For this example, that isenable-allmulti-test. The expected output shows the name of the NAD CR and the creation age in minutes.
NoteThere might be a delay before the SR-IOV Network Operator creates the CR.
Display information about the SR-IOV network resources by running the following command:
$ oc get sriovnetwork -n openshift-sriov-network-operator
Verification of the additional SR-IOV network attachment
To verify that the tuning CNI is correctly configured and that the additional SR-IOV network attachment is attached, follow these steps:
Create a
PodCR. Save the following sample YAML in a file namedexamplepod.yaml:apiVersion: v1 kind: Pod metadata: name: samplepod namespace: enable-allmulti-test annotations: k8s.v1.cni.cncf.io/networks: |- [ { "name": "enableallmulti",1 "mac": "0a:56:0a:83:04:0c",2 "ips": ["10.100.100.200/24"]3 } ] spec: containers: - name: podexample image: centos command: ["/bin/bash", "-c", "sleep INF"] securityContext: runAsUser: 2000 runAsGroup: 3000 allowPrivilegeEscalation: false capabilities: drop: ["ALL"] securityContext: runAsNonRoot: true seccompProfile: type: RuntimeDefault- 1
- Specify the name of the SR-IOV network attachment definition CR.
- 2
- Optional: Specify the MAC address for the SR-IOV device that is allocated from the resource type defined in the SR-IOV network attachment definition CR. To use this feature, you also must specify
{"mac": true}in the SriovNetwork object. - 3
- Optional: Specify the IP addresses for the SR-IOV device that are allocated from the resource type defined in the SR-IOV network attachment definition CR. Both IPv4 and IPv6 addresses are supported. To use this feature, you also must specify
{ "ips": true }in theSriovNetworkobject.
Create the
PodCR by running the following command:$ oc apply -f examplepod.yamlVerify that the pod is created by running the following command:
$ oc get pod -n enable-allmulti-testExample output
NAME READY STATUS RESTARTS AGE samplepod 1/1 Running 0 47sLog in to the pod by running the following command:
$ oc rsh -n enable-allmulti-test samplepodList all the interfaces associated with the pod by running the following command:
sh-4.4# ip linkExample output
1: lo: <LOOPBACK,UP,LOWER_UP> mtu 65536 qdisc noqueue state UNKNOWN mode DEFAULT group default qlen 1000 link/loopback 00:00:00:00:00:00 brd 00:00:00:00:00:00 2: eth0@if22: <BROADCAST,MULTICAST,UP,LOWER_UP> mtu 8901 qdisc noqueue state UP mode DEFAULT group default link/ether 0a:58:0a:83:00:10 brd ff:ff:ff:ff:ff:ff link-netnsid 01 3: net1@if24: <BROADCAST,MULTICAST,ALLMULTI,UP,LOWER_UP> mtu 1500 qdisc noqueue state UP mode DEFAULT group default link/ether ee:9b:66:a4:ec:1d brd ff:ff:ff:ff:ff:ff link-netnsid 02
18.6. Configuring QinQ support for SR-IOV enabled workloads
QinQ, formally known as 802.1Q-in-802.1Q, is a networking technique defined by IEEE 802.1ad. IEEE 802.1ad extends the IEEE 802.1Q-1998 standard and enriches VLAN capabilities by introducing an additional 802.1Q tag to packets already tagged with 802.1Q. This method is also referred to as VLAN stacking or double VLAN.
Before you perform any tasks in the following documentation, ensure that you installed the SR-IOV Network Operator.
18.6.1. About 802.1Q-in-802.1Q support
In traditional VLAN setups, frames typically contain a single VLAN tag, such as VLAN-100, as well as other metadata such as Quality of Service (QoS) bits and protocol information. QinQ introduces a second VLAN tag, where the service provider designates the outer tag for their use, offering them flexibility, while the inner tag remains dedicated to the customer’s VLAN.
QinQ facilitates the creation of nested VLANs by using double VLAN tagging, enabling finer segmentation and isolation of traffic within a network environment. This approach is particularly valuable in service provider networks where you need to deliver VLAN-based services to multiple customers over a common infrastructure, while ensuring separation and isolation of traffic.
The following diagram illustrates how OpenShift Container Platform can use SR-IOV and QinQ to achieve advanced network segmentation and isolation for containerized workloads.
The diagram shows how double VLAN tagging (QinQ) works in a worker node with SR-IOV support. The SR-IOV virtual function (VF) located in the pod namespace, ext0 is configured by the SR-IOV Container Network Interface (CNI) with a VLAN ID and VLAN protocol. This corresponds to the S-tag. Inside the pod, the VLAN CNI creates a subinterface using the primary interface ext0. This subinterface adds an internal VLAN ID using the 802.1Q protocol, which corresponds to the C-tag.
This demonstrates how QinQ enables finer traffic segmentation and isolation within the network. The Ethernet frame structure is detailed on the right, highlighting the inclusion of both VLAN tags, EtherType, IP, TCP, and Payload sections. QinQ facilitates the delivery of VLAN-based services to multiple customers over a shared infrastructure while ensuring traffic separation and isolation.
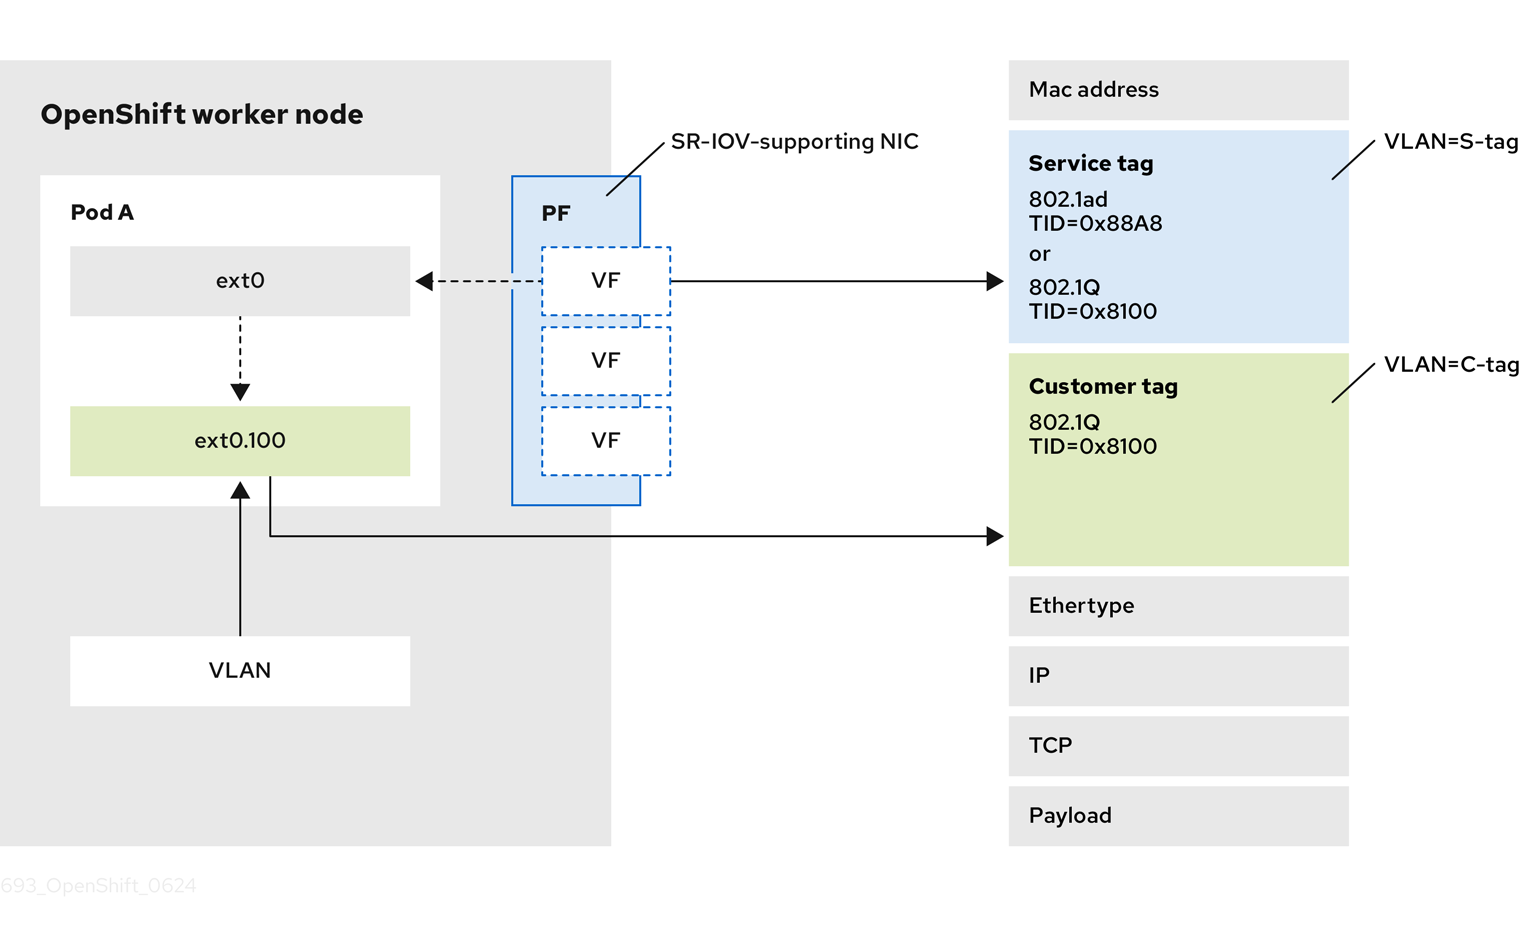
The OpenShift Container Platform SR-IOV solution already supports setting the VLAN protocol on the SriovNetwork custom resource (CR). The virtual function (VF) can use this protocol to set the VLAN tag, also known as the outer tag. Pods can then use the VLAN CNI plugin to configure the inner tag.
| NIC | 802.1ad/802.1Q | 802.1Q/802.1Q |
|---|---|---|
| Intel X710 | No | Supported |
| Intel E810 | Supported | Supported |
| Mellanox | No | Supported |
18.6.2. Configuring QinQ support for SR-IOV enabled workloads
Prerequisites
-
You have installed the OpenShift CLI (
oc). -
You have access to the cluster as a user with the
cluster-adminrole. - You have installed the SR-IOV Network Operator.
Procedure
Create a file named
sriovnetpolicy-810-sriov-node-network.yamlby using the following content:apiVersion: sriovnetwork.openshift.io/v1 kind: SriovNetworkNodePolicy metadata: name: sriovnetpolicy-810 namespace: openshift-sriov-network-operator spec: deviceType: netdevice nicSelector: pfNames: - ens5f0#0-9 nodeSelector: node-role.kubernetes.io/worker-cnf: "" numVfs: 10 priority: 99 resourceName: resource810Create the
SriovNetworkNodePolicyobject by running the following command:$ oc create -f sriovnetpolicy-810-sriov-node-network.yamlOpen a separate terminal window and monitor the synchronization status of the SR-IOV network node state for the node specified in the
openshift-sriov-network-operatornamespace by running the following command:$ watch -n 1 'oc get sriovnetworknodestates -n openshift-sriov-network-operator <node_name> -o jsonpath="{.status.syncStatus}"'The synchronization status indicates a change from
InProgresstoSucceeded.Create a
SriovNetworkobject, and set the outer VLAN called the S-tag, orService Tag, as it belongs to the infrastructure.ImportantYou must configure the VLAN on the trunk interface of the switch. In addition, you might need to further configure some switches to support QinQ tagging.
Create a file named
nad-sriovnetwork-1ad-810.yamlby using the following content:apiVersion: sriovnetwork.openshift.io/v1 kind: SriovNetwork metadata: name: sriovnetwork-1ad-810 namespace: openshift-sriov-network-operator spec: ipam: '{}' vlan: 1711 vlanProto: "802.1ad"2 networkNamespace: default resourceName: resource810Create the object by running the following command:
$ oc create -f nad-sriovnetwork-1ad-810.yaml
Create a
NetworkAttachmentDefinitionobject with an inner VLAN. The inner VLAN is often referred to as the C-tag, orCustomer Tag, as it belongs to the Network Function:Create a file named
nad-cvlan100.yamlby using the following content:apiVersion: k8s.cni.cncf.io/v1 kind: NetworkAttachmentDefinition metadata: name: nad-cvlan100 namespace: default spec: config: '{ "name": "vlan-100", "cniVersion": "0.3.1", "type": "vlan", "linkInContainer": true, "master": "net1",1 "vlanId": 100, "ipam": {"type": "static"} }'- 1
- Specifies the VF interface inside the pod. The default name is
net1as the name is not set in the pod annotation.
Apply the YAML file by running the following command:
$ oc apply -f nad-cvlan100.yaml
Verification
Verify QinQ is active on the node by following this procedure:
Create a file named
test-qinq-pod.yamlby using the following content:apiVersion: v1 kind: Pod metadata: name: test-pod annotations: k8s.v1.cni.cncf.io/networks: sriovnetwork-1ad-810, nad-cvlan100 spec: containers: - name: test-container image: quay.io/ocp-edge-qe/cnf-gotests-client:v4.10 imagePullPolicy: Always securityContext: privileged: trueCreate the test pod by running the following command:
$ oc create -f test-qinq-pod.yamlEnter into a debug session on the target node where the pod is present and display information about the network interface
ens5f0by running the following command:$ oc debug node/my-cluster-node -- bash -c "ip link show ens5f0"Example output
6: ens5f0: <BROADCAST,MULTICAST,UP,LOWER_UP> mtu 1500 qdisc mq state UP mode DEFAULT group default qlen 1000 link/ether b4:96:91:a5:22:10 brd ff:ff:ff:ff:ff:ff vf 0 link/ether a2:81:ba:d0:6f:f3 brd ff:ff:ff:ff:ff:ff, spoof checking on, link-state auto, trust off vf 1 link/ether 8a:bb:0a:36:f2:ed brd ff:ff:ff:ff:ff:ff, vlan 171, vlan protocol 802.1ad, spoof checking on, link-state auto, trust off vf 2 link/ether ca:0e:e1:5b:0c:d2 brd ff:ff:ff:ff:ff:ff, spoof checking on, link-state auto, trust off vf 3 link/ether ee:6c:e2:f5:2c:70 brd ff:ff:ff:ff:ff:ff, spoof checking on, link-state auto, trust off vf 4 link/ether 0a:d6:b7:66:5e:e8 brd ff:ff:ff:ff:ff:ff, spoof checking on, link-state auto, trust off vf 5 link/ether da:d5:e7:14:4f:aa brd ff:ff:ff:ff:ff:ff, spoof checking on, link-state auto, trust off vf 6 link/ether d6:8e:85:75:12:5c brd ff:ff:ff:ff:ff:ff, spoof checking on, link-state auto, trust off vf 7 link/ether d6:eb:ce:9c:ea:78 brd ff:ff:ff:ff:ff:ff, spoof checking on, link-state auto, trust off vf 8 link/ether 5e:c5:cc:05:93:3c brd ff:ff:ff:ff:ff:ff, spoof checking on, link-state auto, trust on vf 9 link/ether a6:5a:7c:1c:2a:16 brd ff:ff:ff:ff:ff:ff, spoof checking on, link-state auto, trust offThe
vlan protocol 802.1adID in the output indicates that the interface supports VLAN tagging with protocol 802.1ad (QinQ). The VLAN ID is 171.
18.7. Using high performance multicast
You can use multicast on your Single Root I/O Virtualization (SR-IOV) hardware network.
Before you perform any tasks in the following documentation, ensure that you installed the SR-IOV Network Operator.
18.7.1. High performance multicast
The OpenShift SDN network plugin supports multicast between pods on the default network. This is best used for low-bandwidth coordination or service discovery, and not high-bandwidth applications. For applications such as streaming media, like Internet Protocol television (IPTV) and multipoint videoconferencing, you can utilize Single Root I/O Virtualization (SR-IOV) hardware to provide near-native performance.
When using additional SR-IOV interfaces for multicast:
- Multicast packages must be sent or received by a pod through the additional SR-IOV interface.
- The physical network which connects the SR-IOV interfaces decides the multicast routing and topology, which is not controlled by OpenShift Container Platform.
18.7.2. Configuring an SR-IOV interface for multicast
The follow procedure creates an example SR-IOV interface for multicast.
Prerequisites
-
Install the OpenShift CLI (
oc). -
You must log in to the cluster with a user that has the
cluster-adminrole.
Procedure
Create a
SriovNetworkNodePolicyobject:apiVersion: sriovnetwork.openshift.io/v1 kind: SriovNetworkNodePolicy metadata: name: policy-example namespace: openshift-sriov-network-operator spec: resourceName: example nodeSelector: feature.node.kubernetes.io/network-sriov.capable: "true" numVfs: 4 nicSelector: vendor: "8086" pfNames: ['ens803f0'] rootDevices: ['0000:86:00.0']Create a
SriovNetworkobject:apiVersion: sriovnetwork.openshift.io/v1 kind: SriovNetwork metadata: name: net-example namespace: openshift-sriov-network-operator spec: networkNamespace: default ipam: |1 { "type": "host-local",2 "subnet": "10.56.217.0/24", "rangeStart": "10.56.217.171", "rangeEnd": "10.56.217.181", "routes": [ {"dst": "224.0.0.0/5"}, {"dst": "232.0.0.0/5"} ], "gateway": "10.56.217.1" } resourceName: exampleCreate a pod with multicast application:
apiVersion: v1 kind: Pod metadata: name: testpmd namespace: default annotations: k8s.v1.cni.cncf.io/networks: nic1 spec: containers: - name: example image: rhel7:latest securityContext: capabilities: add: ["NET_ADMIN"]1 command: [ "sleep", "infinity"]- 1
- The
NET_ADMINcapability is required only if your application needs to assign the multicast IP address to the SR-IOV interface. Otherwise, it can be omitted.
18.8. Using DPDK and RDMA
The containerized Data Plane Development Kit (DPDK) application is supported on OpenShift Container Platform. You can use Single Root I/O Virtualization (SR-IOV) network hardware with the Data Plane Development Kit (DPDK) and with remote direct memory access (RDMA).
Before you perform any tasks in the following documentation, ensure that you installed the SR-IOV Network Operator.
18.8.1. Example use of a virtual function in a pod
You can run a remote direct memory access (RDMA) or a Data Plane Development Kit (DPDK) application in a pod with SR-IOV VF attached.
This example shows a pod using a virtual function (VF) in RDMA mode:
Pod spec that uses RDMA mode
apiVersion: v1
kind: Pod
metadata:
name: rdma-app
annotations:
k8s.v1.cni.cncf.io/networks: sriov-rdma-mlnx
spec:
containers:
- name: testpmd
image: <RDMA_image>
imagePullPolicy: IfNotPresent
securityContext:
runAsUser: 0
capabilities:
add: ["IPC_LOCK","SYS_RESOURCE","NET_RAW"]
command: ["sleep", "infinity"]The following example shows a pod with a VF in DPDK mode:
Pod spec that uses DPDK mode
apiVersion: v1
kind: Pod
metadata:
name: dpdk-app
annotations:
k8s.v1.cni.cncf.io/networks: sriov-dpdk-net
spec:
containers:
- name: testpmd
image: <DPDK_image>
securityContext:
runAsUser: 0
capabilities:
add: ["IPC_LOCK","SYS_RESOURCE","NET_RAW"]
volumeMounts:
- mountPath: /dev/hugepages
name: hugepage
resources:
limits:
memory: "1Gi"
cpu: "2"
hugepages-1Gi: "4Gi"
requests:
memory: "1Gi"
cpu: "2"
hugepages-1Gi: "4Gi"
command: ["sleep", "infinity"]
volumes:
- name: hugepage
emptyDir:
medium: HugePages18.8.2. Using a virtual function in DPDK mode with an Intel NIC
Prerequisites
-
Install the OpenShift CLI (
oc). - Install the SR-IOV Network Operator.
-
Log in as a user with
cluster-adminprivileges.
Procedure
Create the following
SriovNetworkNodePolicyobject, and then save the YAML in theintel-dpdk-node-policy.yamlfile.apiVersion: sriovnetwork.openshift.io/v1 kind: SriovNetworkNodePolicy metadata: name: intel-dpdk-node-policy namespace: openshift-sriov-network-operator spec: resourceName: intelnics nodeSelector: feature.node.kubernetes.io/network-sriov.capable: "true" priority: <priority> numVfs: <num> nicSelector: vendor: "8086" deviceID: "158b" pfNames: ["<pf_name>", ...] rootDevices: ["<pci_bus_id>", "..."] deviceType: vfio-pci1 - 1
- Specify the driver type for the virtual functions to
vfio-pci.
NoteSee the
Configuring SR-IOV network devicessection for a detailed explanation on each option inSriovNetworkNodePolicy.When applying the configuration specified in a
SriovNetworkNodePolicyobject, the SR-IOV Operator may drain the nodes, and in some cases, reboot nodes. It may take several minutes for a configuration change to apply. Ensure that there are enough available nodes in your cluster to handle the evicted workload beforehand.After the configuration update is applied, all the pods in
openshift-sriov-network-operatornamespace will change to aRunningstatus.Create the
SriovNetworkNodePolicyobject by running the following command:$ oc create -f intel-dpdk-node-policy.yamlCreate the following
SriovNetworkobject, and then save the YAML in theintel-dpdk-network.yamlfile.apiVersion: sriovnetwork.openshift.io/v1 kind: SriovNetwork metadata: name: intel-dpdk-network namespace: openshift-sriov-network-operator spec: networkNamespace: <target_namespace> ipam: |- # ...1 vlan: <vlan> resourceName: intelnics- 1
- Specify a configuration object for the ipam CNI plugin as a YAML block scalar. The plugin manages IP address assignment for the attachment definition.
NoteSee the "Configuring SR-IOV additional network" section for a detailed explanation on each option in
SriovNetwork.An optional library, app-netutil, provides several API methods for gathering network information about a container’s parent pod.
Create the
SriovNetworkobject by running the following command:$ oc create -f intel-dpdk-network.yamlCreate the following
Podspec, and then save the YAML in theintel-dpdk-pod.yamlfile.apiVersion: v1 kind: Pod metadata: name: dpdk-app namespace: <target_namespace>1 annotations: k8s.v1.cni.cncf.io/networks: intel-dpdk-network spec: containers: - name: testpmd image: <DPDK_image>2 securityContext: runAsUser: 0 capabilities: add: ["IPC_LOCK","SYS_RESOURCE","NET_RAW"]3 volumeMounts: - mountPath: /mnt/huge4 name: hugepage resources: limits: openshift.io/intelnics: "1"5 memory: "1Gi" cpu: "4"6 hugepages-1Gi: "4Gi"7 requests: openshift.io/intelnics: "1" memory: "1Gi" cpu: "4" hugepages-1Gi: "4Gi" command: ["sleep", "infinity"] volumes: - name: hugepage emptyDir: medium: HugePages- 1
- Specify the same
target_namespacewhere theSriovNetworkobjectintel-dpdk-networkis created. If you would like to create the pod in a different namespace, changetarget_namespacein both thePodspec and theSriovNetworkobject. - 2
- Specify the DPDK image which includes your application and the DPDK library used by application.
- 3
- Specify additional capabilities required by the application inside the container for hugepage allocation, system resource allocation, and network interface access.
- 4
- Mount a hugepage volume to the DPDK pod under
/mnt/huge. The hugepage volume is backed by the emptyDir volume type with the medium beingHugepages. - 5
- Optional: Specify the number of DPDK devices allocated to DPDK pod. This resource request and limit, if not explicitly specified, will be automatically added by the SR-IOV network resource injector. The SR-IOV network resource injector is an admission controller component managed by the SR-IOV Operator. It is enabled by default and can be disabled by setting
enableInjectoroption tofalsein the defaultSriovOperatorConfigCR. - 6
- Specify the number of CPUs. The DPDK pod usually requires exclusive CPUs to be allocated from the kubelet. This is achieved by setting CPU Manager policy to
staticand creating a pod withGuaranteedQoS. - 7
- Specify hugepage size
hugepages-1Giorhugepages-2Miand the quantity of hugepages that will be allocated to the DPDK pod. Configure2Miand1Gihugepages separately. Configuring1Gihugepage requires adding kernel arguments to Nodes. For example, adding kernel argumentsdefault_hugepagesz=1GB,hugepagesz=1Gandhugepages=16will result in16*1Gihugepages be allocated during system boot.
Create the DPDK pod by running the following command:
$ oc create -f intel-dpdk-pod.yaml
18.8.3. Using a virtual function in DPDK mode with a Mellanox NIC
You can create a network node policy and create a Data Plane Development Kit (DPDK) pod using a virtual function in DPDK mode with a Mellanox NIC.
Prerequisites
-
You have installed the OpenShift CLI (
oc). - You have installed the Single Root I/O Virtualization (SR-IOV) Network Operator.
-
You have logged in as a user with
cluster-adminprivileges.
Procedure
Save the following
SriovNetworkNodePolicyYAML configuration to anmlx-dpdk-node-policy.yamlfile:apiVersion: sriovnetwork.openshift.io/v1 kind: SriovNetworkNodePolicy metadata: name: mlx-dpdk-node-policy namespace: openshift-sriov-network-operator spec: resourceName: mlxnics nodeSelector: feature.node.kubernetes.io/network-sriov.capable: "true" priority: <priority> numVfs: <num> nicSelector: vendor: "15b3" deviceID: "1015"1 pfNames: ["<pf_name>", ...] rootDevices: ["<pci_bus_id>", "..."] deviceType: netdevice2 isRdma: true3 - 1
- Specify the device hex code of the SR-IOV network device.
- 2
- Specify the driver type for the virtual functions to
netdevice. A Mellanox SR-IOV Virtual Function (VF) can work in DPDK mode without using thevfio-pcidevice type. The VF device appears as a kernel network interface inside a container. - 3
- Enable Remote Direct Memory Access (RDMA) mode. This is required for Mellanox cards to work in DPDK mode.
NoteSee Configuring an SR-IOV network device for a detailed explanation of each option in the
SriovNetworkNodePolicyobject.When applying the configuration specified in an
SriovNetworkNodePolicyobject, the SR-IOV Operator might drain the nodes, and in some cases, reboot nodes. It might take several minutes for a configuration change to apply. Ensure that there are enough available nodes in your cluster to handle the evicted workload beforehand.After the configuration update is applied, all the pods in the
openshift-sriov-network-operatornamespace will change to aRunningstatus.Create the
SriovNetworkNodePolicyobject by running the following command:$ oc create -f mlx-dpdk-node-policy.yamlSave the following
SriovNetworkYAML configuration to anmlx-dpdk-network.yamlfile:apiVersion: sriovnetwork.openshift.io/v1 kind: SriovNetwork metadata: name: mlx-dpdk-network namespace: openshift-sriov-network-operator spec: networkNamespace: <target_namespace> ipam: |-1 ... vlan: <vlan> resourceName: mlxnics- 1
- Specify a configuration object for the IP Address Management (IPAM) Container Network Interface (CNI) plugin as a YAML block scalar. The plugin manages IP address assignment for the attachment definition.
NoteSee Configuring an SR-IOV network device for a detailed explanation on each option in the
SriovNetworkobject.The
app-netutiloption library provides several API methods for gathering network information about the parent pod of a container.Create the
SriovNetworkobject by running the following command:$ oc create -f mlx-dpdk-network.yamlSave the following
PodYAML configuration to anmlx-dpdk-pod.yamlfile:apiVersion: v1 kind: Pod metadata: name: dpdk-app namespace: <target_namespace>1 annotations: k8s.v1.cni.cncf.io/networks: mlx-dpdk-network spec: containers: - name: testpmd image: <DPDK_image>2 securityContext: runAsUser: 0 capabilities: add: ["IPC_LOCK","SYS_RESOURCE","NET_RAW"]3 volumeMounts: - mountPath: /mnt/huge4 name: hugepage resources: limits: openshift.io/mlxnics: "1"5 memory: "1Gi" cpu: "4"6 hugepages-1Gi: "4Gi"7 requests: openshift.io/mlxnics: "1" memory: "1Gi" cpu: "4" hugepages-1Gi: "4Gi" command: ["sleep", "infinity"] volumes: - name: hugepage emptyDir: medium: HugePages- 1
- Specify the same
target_namespacewhereSriovNetworkobjectmlx-dpdk-networkis created. To create the pod in a different namespace, changetarget_namespacein both thePodspec andSriovNetworkobject. - 2
- Specify the DPDK image which includes your application and the DPDK library used by the application.
- 3
- Specify additional capabilities required by the application inside the container for hugepage allocation, system resource allocation, and network interface access.
- 4
- Mount the hugepage volume to the DPDK pod under
/mnt/huge. The hugepage volume is backed by theemptyDirvolume type with the medium beingHugepages. - 5
- Optional: Specify the number of DPDK devices allocated for the DPDK pod. If not explicitly specified, this resource request and limit is automatically added by the SR-IOV network resource injector. The SR-IOV network resource injector is an admission controller component managed by SR-IOV Operator. It is enabled by default and can be disabled by setting the
enableInjectoroption tofalsein the defaultSriovOperatorConfigCR. - 6
- Specify the number of CPUs. The DPDK pod usually requires that exclusive CPUs be allocated from the kubelet. To do this, set the CPU Manager policy to
staticand create a pod withGuaranteedQuality of Service (QoS). - 7
- Specify hugepage size
hugepages-1Giorhugepages-2Miand the quantity of hugepages that will be allocated to the DPDK pod. Configure2Miand1Gihugepages separately. Configuring1Gihugepages requires adding kernel arguments to Nodes.
Create the DPDK pod by running the following command:
$ oc create -f mlx-dpdk-pod.yaml
18.8.4. Using the TAP CNI to run a rootless DPDK workload with kernel access
DPDK applications can use virtio-user as an exception path to inject certain types of packets, such as log messages, into the kernel for processing. For more information about this feature, see Virtio_user as Exception Path.
In OpenShift Container Platform version 4.14 and later, you can use non-privileged pods to run DPDK applications alongside the tap CNI plugin. To enable this functionality, you need to mount the vhost-net device by setting the needVhostNet parameter to true within the SriovNetworkNodePolicy object.
Figure 18.1. DPDK and TAP example configuration
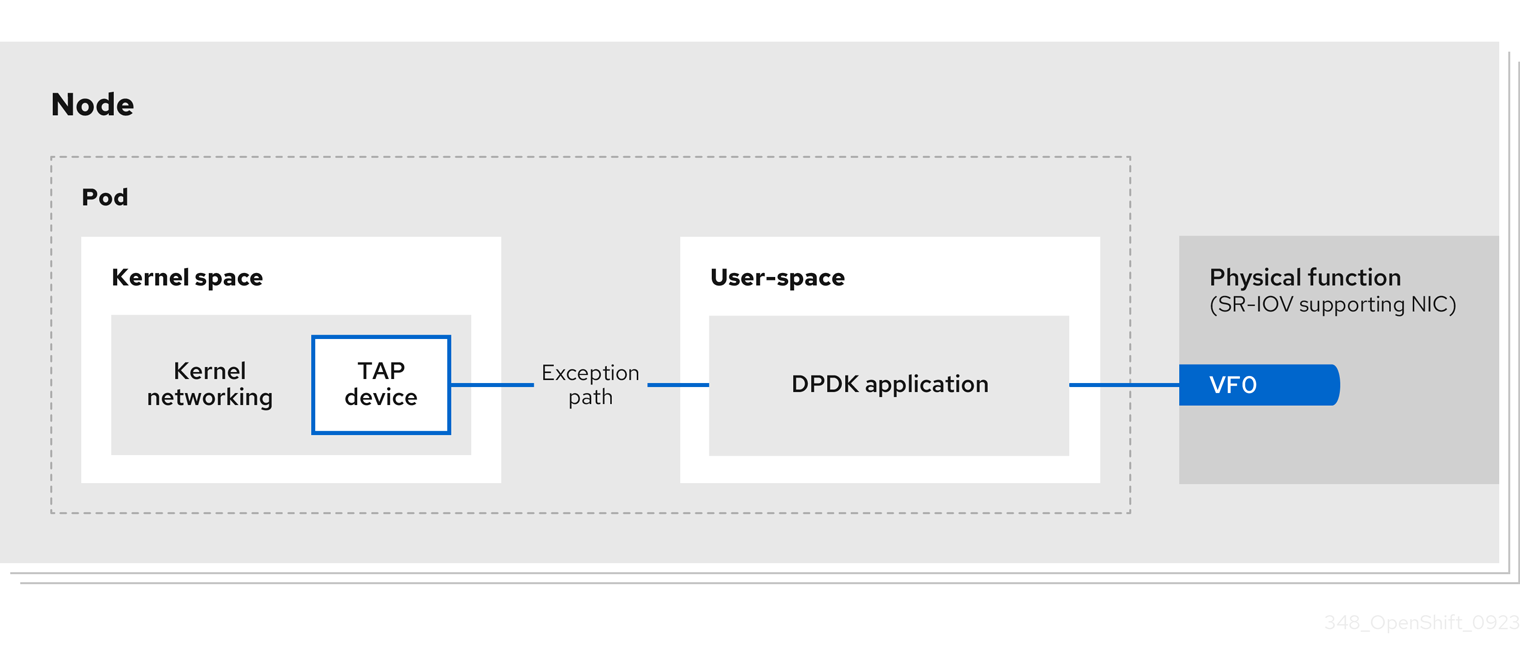
Prerequisites
-
You have installed the OpenShift CLI (
oc). - You have installed the SR-IOV Network Operator.
-
You are logged in as a user with
cluster-adminprivileges. Ensure that
setsebools container_use_devices=onis set as root on all nodes.NoteUse the Machine Config Operator to set this SELinux boolean.
Procedure
Create a file, such as
test-namespace.yaml, with content like the following example:apiVersion: v1 kind: Namespace metadata: name: test-namespace labels: pod-security.kubernetes.io/enforce: privileged pod-security.kubernetes.io/audit: privileged pod-security.kubernetes.io/warn: privileged security.openshift.io/scc.podSecurityLabelSync: "false"Create the new
Namespaceobject by running the following command:$ oc apply -f test-namespace.yamlCreate a file, such as
sriov-node-network-policy.yaml, with content like the following example::apiVersion: sriovnetwork.openshift.io/v1 kind: SriovNetworkNodePolicy metadata: name: sriovnic namespace: openshift-sriov-network-operator spec: deviceType: netdevice1 isRdma: true2 needVhostNet: true3 nicSelector: vendor: "15b3"4 deviceID: "101b"5 rootDevices: ["00:05.0"] numVfs: 10 priority: 99 resourceName: sriovnic nodeSelector: feature.node.kubernetes.io/network-sriov.capable: "true"- 1
- This indicates that the profile is tailored specifically for Mellanox Network Interface Controllers (NICs).
- 2
- Setting
isRdmatotrueis only required for a Mellanox NIC. - 3
- This mounts the
/dev/net/tunand/dev/vhost-netdevices into the container so the application can create a tap device and connect the tap device to the DPDK workload. - 4
- The vendor hexadecimal code of the SR-IOV network device. The value 15b3 is associated with a Mellanox NIC.
- 5
- The device hexadecimal code of the SR-IOV network device.
Create the
SriovNetworkNodePolicyobject by running the following command:$ oc create -f sriov-node-network-policy.yamlCreate the following
SriovNetworkobject, and then save the YAML in thesriov-network-attachment.yamlfile:apiVersion: sriovnetwork.openshift.io/v1 kind: SriovNetwork metadata: name: sriov-network namespace: openshift-sriov-network-operator spec: networkNamespace: test-namespace resourceName: sriovnic spoofChk: "off" trust: "on"NoteSee the "Configuring SR-IOV additional network" section for a detailed explanation on each option in
SriovNetwork.An optional library,
app-netutil, provides several API methods for gathering network information about a container’s parent pod.Create the
SriovNetworkobject by running the following command:$ oc create -f sriov-network-attachment.yamlCreate a file, such as
tap-example.yaml, that defines a network attachment definition, with content like the following example:apiVersion: "k8s.cni.cncf.io/v1" kind: NetworkAttachmentDefinition metadata: name: tap-one namespace: test-namespace1 spec: config: '{ "cniVersion": "0.4.0", "name": "tap", "plugins": [ { "type": "tap", "multiQueue": true, "selinuxcontext": "system_u:system_r:container_t:s0" }, { "type":"tuning", "capabilities":{ "mac":true } } ] }'- 1
- Specify the same
target_namespacewhere theSriovNetworkobject is created.
Create the
NetworkAttachmentDefinitionobject by running the following command:$ oc apply -f tap-example.yamlCreate a file, such as
dpdk-pod-rootless.yaml, with content like the following example:apiVersion: v1 kind: Pod metadata: name: dpdk-app namespace: test-namespace1 annotations: k8s.v1.cni.cncf.io/networks: '[ {"name": "sriov-network", "namespace": "test-namespace"}, {"name": "tap-one", "interface": "ext0", "namespace": "test-namespace"}]' spec: nodeSelector: kubernetes.io/hostname: "worker-0" securityContext: fsGroup: 10012 runAsGroup: 10013 seccompProfile: type: RuntimeDefault containers: - name: testpmd image: <DPDK_image>4 securityContext: capabilities: drop: ["ALL"]5 add:6 - IPC_LOCK - NET_RAW #for mlx only7 runAsUser: 10018 privileged: false9 allowPrivilegeEscalation: true10 runAsNonRoot: true11 volumeMounts: - mountPath: /mnt/huge12 name: hugepages resources: limits: openshift.io/sriovnic: "1"13 memory: "1Gi" cpu: "4"14 hugepages-1Gi: "4Gi"15 requests: openshift.io/sriovnic: "1" memory: "1Gi" cpu: "4" hugepages-1Gi: "4Gi" command: ["sleep", "infinity"] runtimeClassName: performance-cnf-performanceprofile16 volumes: - name: hugepages emptyDir: medium: HugePages- 1
- Specify the same
target_namespacein which theSriovNetworkobject is created. If you want to create the pod in a different namespace, changetarget_namespacein both thePodspec and theSriovNetworkobject. - 2
- Sets the group ownership of volume-mounted directories and files created in those volumes.
- 3
- Specify the primary group ID used for running the container.
- 4
- Specify the DPDK image that contains your application and the DPDK library used by application.
- 5
- Removing all capabilities (
ALL) from the container’s securityContext means that the container has no special privileges beyond what is necessary for normal operation. - 6
- Specify additional capabilities required by the application inside the container for hugepage allocation, system resource allocation, and network interface access. These capabilities must also be set in the binary file by using the
setcapcommand. - 7
- Mellanox network interface controller (NIC) requires the
NET_RAWcapability. - 8
- Specify the user ID used for running the container.
- 9
- This setting indicates that the container or containers within the pod should not be granted privileged access to the host system.
- 10
- This setting allows a container to escalate its privileges beyond the initial non-root privileges it might have been assigned.
- 11
- This setting ensures that the container runs with a non-root user. This helps enforce the principle of least privilege, limiting the potential impact of compromising the container and reducing the attack surface.
- 12
- Mount a hugepage volume to the DPDK pod under
/mnt/huge. The hugepage volume is backed by the emptyDir volume type with the medium beingHugepages. - 13
- Optional: Specify the number of DPDK devices allocated for the DPDK pod. If not explicitly specified, this resource request and limit is automatically added by the SR-IOV network resource injector. The SR-IOV network resource injector is an admission controller component managed by SR-IOV Operator. It is enabled by default and can be disabled by setting the
enableInjectoroption tofalsein the defaultSriovOperatorConfigCR. - 14
- Specify the number of CPUs. The DPDK pod usually requires exclusive CPUs to be allocated from the kubelet. This is achieved by setting CPU Manager policy to
staticand creating a pod withGuaranteedQoS. - 15
- Specify hugepage size
hugepages-1Giorhugepages-2Miand the quantity of hugepages that will be allocated to the DPDK pod. Configure2Miand1Gihugepages separately. Configuring1Gihugepage requires adding kernel arguments to Nodes. For example, adding kernel argumentsdefault_hugepagesz=1GB,hugepagesz=1Gandhugepages=16will result in16*1Gihugepages be allocated during system boot. - 16
- If your performance profile is not named
cnf-performance profile, replace that string with the correct performance profile name.
Create the DPDK pod by running the following command:
$ oc create -f dpdk-pod-rootless.yaml
18.8.5. Overview of achieving a specific DPDK line rate
To achieve a specific Data Plane Development Kit (DPDK) line rate, deploy a Node Tuning Operator and configure Single Root I/O Virtualization (SR-IOV). You must also tune the DPDK settings for the following resources:
- Isolated CPUs
- Hugepages
- The topology scheduler
In previous versions of OpenShift Container Platform, the Performance Addon Operator was used to implement automatic tuning to achieve low latency performance for OpenShift Container Platform applications. In OpenShift Container Platform 4.11 and later, this functionality is part of the Node Tuning Operator.
DPDK test environment
The following diagram shows the components of a traffic-testing environment:
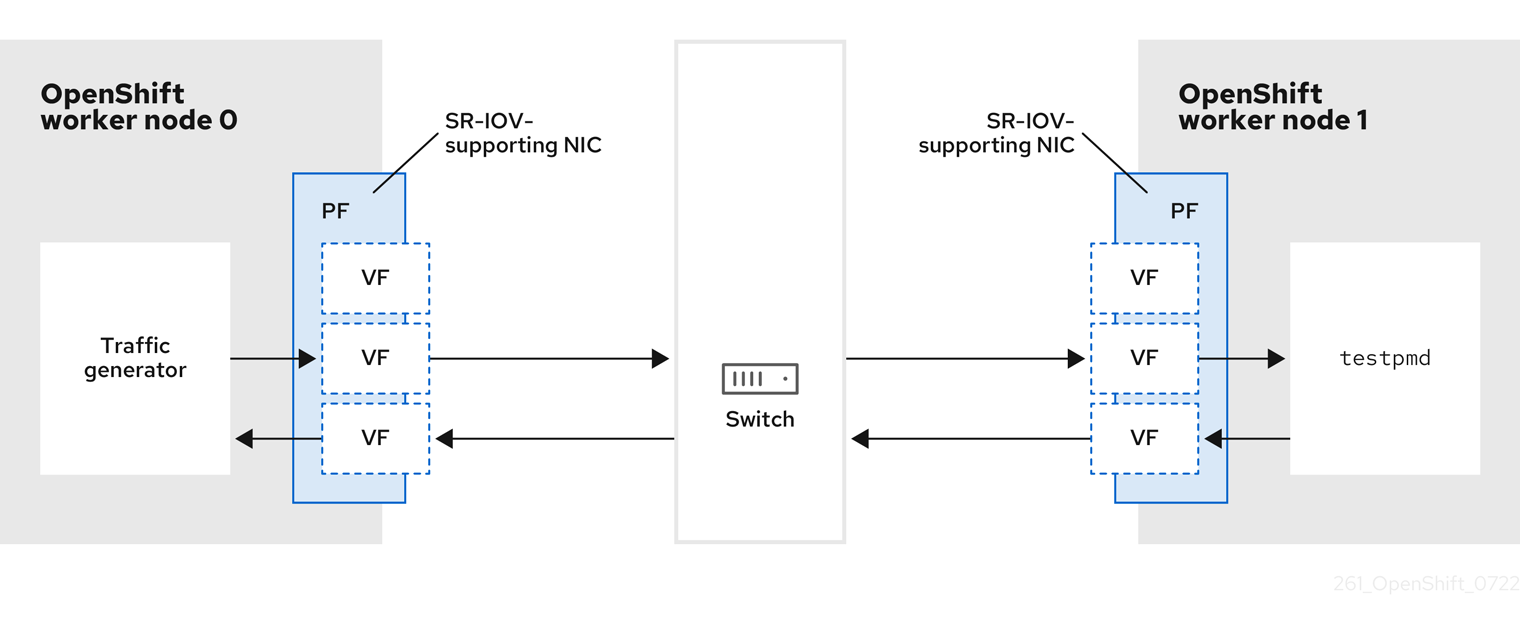
- Traffic generator: An application that can generate high-volume packet traffic.
- SR-IOV-supporting NIC: A network interface card compatible with SR-IOV. The card runs a number of virtual functions on a physical interface.
- Physical Function (PF): A PCI Express (PCIe) function of a network adapter that supports the SR-IOV interface.
- Virtual Function (VF): A lightweight PCIe function on a network adapter that supports SR-IOV. The VF is associated with the PCIe PF on the network adapter. The VF represents a virtualized instance of the network adapter.
- Switch: A network switch. Nodes can also be connected back-to-back.
-
testpmd: An example application included with DPDK. Thetestpmdapplication can be used to test the DPDK in a packet-forwarding mode. Thetestpmdapplication is also an example of how to build a fully-fledged application using the DPDK Software Development Kit (SDK). - worker 0 and worker 1: OpenShift Container Platform nodes.
18.8.6. Using SR-IOV and the Node Tuning Operator to achieve a DPDK line rate
You can use the Node Tuning Operator to configure isolated CPUs, hugepages, and a topology scheduler. You can then use the Node Tuning Operator with Single Root I/O Virtualization (SR-IOV) to achieve a specific Data Plane Development Kit (DPDK) line rate.
Prerequisites
-
You have installed the OpenShift CLI (
oc). - You have installed the SR-IOV Network Operator.
-
You have logged in as a user with
cluster-adminprivileges. You have deployed a standalone Node Tuning Operator.
NoteIn previous versions of OpenShift Container Platform, the Performance Addon Operator was used to implement automatic tuning to achieve low latency performance for OpenShift applications. In OpenShift Container Platform 4.11 and later, this functionality is part of the Node Tuning Operator.
Procedure
Create a
PerformanceProfileobject based on the following example:apiVersion: performance.openshift.io/v2 kind: PerformanceProfile metadata: name: performance spec: globallyDisableIrqLoadBalancing: true cpu: isolated: 21-51,73-1031 reserved: 0-20,52-722 hugepages: defaultHugepagesSize: 1G3 pages: - count: 32 size: 1G net: userLevelNetworking: true numa: topologyPolicy: "single-numa-node" nodeSelector: node-role.kubernetes.io/worker-cnf: ""- 1
- If hyperthreading is enabled on the system, allocate the relevant symbolic links to the
isolatedandreservedCPU groups. If the system contains multiple non-uniform memory access nodes (NUMAs), allocate CPUs from both NUMAs to both groups. You can also use the Performance Profile Creator for this task. For more information, see Creating a performance profile. - 2
- You can also specify a list of devices that will have their queues set to the reserved CPU count. For more information, see Reducing NIC queues using the Node Tuning Operator.
- 3
- Allocate the number and size of hugepages needed. You can specify the NUMA configuration for the hugepages. By default, the system allocates an even number to every NUMA node on the system. If needed, you can request the use of a realtime kernel for the nodes. See Provisioning a worker with real-time capabilities for more information.
-
Save the
yamlfile asmlx-dpdk-perfprofile-policy.yaml. Apply the performance profile using the following command:
$ oc create -f mlx-dpdk-perfprofile-policy.yaml
18.8.6.1. DPDK library for use with container applications
An optional library, app-netutil, provides several API methods for gathering network information about a pod from within a container running within that pod.
This library can assist with integrating SR-IOV virtual functions (VFs) in Data Plane Development Kit (DPDK) mode into the container. The library provides both a Golang API and a C API.
Currently there are three API methods implemented:
GetCPUInfo()- This function determines which CPUs are available to the container and returns the list.
GetHugepages()-
This function determines the amount of huge page memory requested in the
Podspec for each container and returns the values. GetInterfaces()- This function determines the set of interfaces in the container and returns the list. The return value includes the interface type and type-specific data for each interface.
The repository for the library includes a sample Dockerfile to build a container image, dpdk-app-centos. The container image can run one of the following DPDK sample applications, depending on an environment variable in the pod specification: l2fwd, l3wd or testpmd. The container image provides an example of integrating the app-netutil library into the container image itself. The library can also integrate into an init container. The init container can collect the required data and pass the data to an existing DPDK workload.
18.8.6.2. Example SR-IOV Network Operator for virtual functions
You can use the Single Root I/O Virtualization (SR-IOV) Network Operator to allocate and configure Virtual Functions (VFs) from SR-IOV-supporting Physical Function NICs on the nodes.
For more information on deploying the Operator, see Installing the SR-IOV Network Operator. For more information on configuring an SR-IOV network device, see Configuring an SR-IOV network device.
There are some differences between running Data Plane Development Kit (DPDK) workloads on Intel VFs and Mellanox VFs. This section provides object configuration examples for both VF types. The following is an example of an sriovNetworkNodePolicy object used to run DPDK applications on Intel NICs:
apiVersion: sriovnetwork.openshift.io/v1
kind: SriovNetworkNodePolicy
metadata:
name: dpdk-nic-1
namespace: openshift-sriov-network-operator
spec:
deviceType: vfio-pci
needVhostNet: true
nicSelector:
pfNames: ["ens3f0"]
nodeSelector:
node-role.kubernetes.io/worker-cnf: ""
numVfs: 10
priority: 99
resourceName: dpdk_nic_1
---
apiVersion: sriovnetwork.openshift.io/v1
kind: SriovNetworkNodePolicy
metadata:
name: dpdk-nic-1
namespace: openshift-sriov-network-operator
spec:
deviceType: vfio-pci
needVhostNet: true
nicSelector:
pfNames: ["ens3f1"]
nodeSelector:
node-role.kubernetes.io/worker-cnf: ""
numVfs: 10
priority: 99
resourceName: dpdk_nic_2
The following is an example of an sriovNetworkNodePolicy object for Mellanox NICs:
apiVersion: sriovnetwork.openshift.io/v1
kind: SriovNetworkNodePolicy
metadata:
name: dpdk-nic-1
namespace: openshift-sriov-network-operator
spec:
deviceType: netdevice
isRdma: true
nicSelector:
rootDevices:
- "0000:5e:00.1"
nodeSelector:
node-role.kubernetes.io/worker-cnf: ""
numVfs: 5
priority: 99
resourceName: dpdk_nic_1
---
apiVersion: sriovnetwork.openshift.io/v1
kind: SriovNetworkNodePolicy
metadata:
name: dpdk-nic-2
namespace: openshift-sriov-network-operator
spec:
deviceType: netdevice
isRdma: true
nicSelector:
rootDevices:
- "0000:5e:00.0"
nodeSelector:
node-role.kubernetes.io/worker-cnf: ""
numVfs: 5
priority: 99
resourceName: dpdk_nic_218.8.6.3. Example SR-IOV network operator
The following is an example definition of an sriovNetwork object. In this case, Intel and Mellanox configurations are identical:
apiVersion: sriovnetwork.openshift.io/v1
kind: SriovNetwork
metadata:
name: dpdk-network-1
namespace: openshift-sriov-network-operator
spec:
ipam: '{"type": "host-local","ranges": [[{"subnet": "10.0.1.0/24"}]],"dataDir":
"/run/my-orchestrator/container-ipam-state-1"}'
networkNamespace: dpdk-test
spoofChk: "off"
trust: "on"
resourceName: dpdk_nic_1
---
apiVersion: sriovnetwork.openshift.io/v1
kind: SriovNetwork
metadata:
name: dpdk-network-2
namespace: openshift-sriov-network-operator
spec:
ipam: '{"type": "host-local","ranges": [[{"subnet": "10.0.2.0/24"}]],"dataDir":
"/run/my-orchestrator/container-ipam-state-1"}'
networkNamespace: dpdk-test
spoofChk: "off"
trust: "on"
resourceName: dpdk_nic_2- 1
- You can use a different IP Address Management (IPAM) implementation, such as Whereabouts. For more information, see Dynamic IP address assignment configuration with Whereabouts.
- 2
- You must request the
networkNamespacewhere the network attachment definition will be created. You must create thesriovNetworkCR under theopenshift-sriov-network-operatornamespace. - 3
- The
resourceNamevalue must match that of theresourceNamecreated under thesriovNetworkNodePolicy.
18.8.6.4. Example DPDK base workload
The following is an example of a Data Plane Development Kit (DPDK) container:
apiVersion: v1
kind: Namespace
metadata:
name: dpdk-test
---
apiVersion: v1
kind: Pod
metadata:
annotations:
k8s.v1.cni.cncf.io/networks: '[
{
"name": "dpdk-network-1",
"namespace": "dpdk-test"
},
{
"name": "dpdk-network-2",
"namespace": "dpdk-test"
}
]'
irq-load-balancing.crio.io: "disable"
cpu-load-balancing.crio.io: "disable"
cpu-quota.crio.io: "disable"
labels:
app: dpdk
name: testpmd
namespace: dpdk-test
spec:
runtimeClassName: performance-performance
containers:
- command:
- /bin/bash
- -c
- sleep INF
image: registry.redhat.io/openshift4/dpdk-base-rhel8
imagePullPolicy: Always
name: dpdk
resources:
limits:
cpu: "16"
hugepages-1Gi: 8Gi
memory: 2Gi
requests:
cpu: "16"
hugepages-1Gi: 8Gi
memory: 2Gi
securityContext:
capabilities:
add:
- IPC_LOCK
- SYS_RESOURCE
- NET_RAW
- NET_ADMIN
runAsUser: 0
volumeMounts:
- mountPath: /mnt/huge
name: hugepages
terminationGracePeriodSeconds: 5
volumes:
- emptyDir:
medium: HugePages
name: hugepages- 1
- Request the SR-IOV networks you need. Resources for the devices will be injected automatically.
- 2
- Disable the CPU and IRQ load balancing base. See Disabling interrupt processing for individual pods for more information.
- 3
- Set the
runtimeClasstoperformance-performance. Do not set theruntimeClasstoHostNetworkorprivileged. - 4
- Request an equal number of resources for requests and limits to start the pod with
GuaranteedQuality of Service (QoS).
Do not start the pod with SLEEP and then exec into the pod to start the testpmd or the DPDK workload. This can add additional interrupts as the exec process is not pinned to any CPU.
18.8.6.5. Example testpmd script
The following is an example script for running testpmd:
#!/bin/bash
set -ex
export CPU=$(cat /sys/fs/cgroup/cpuset/cpuset.cpus)
echo ${CPU}
dpdk-testpmd -l ${CPU} -a ${PCIDEVICE_OPENSHIFT_IO_DPDK_NIC_1} -a ${PCIDEVICE_OPENSHIFT_IO_DPDK_NIC_2} -n 4 -- -i --nb-cores=15 --rxd=4096 --txd=4096 --rxq=7 --txq=7 --forward-mode=mac --eth-peer=0,50:00:00:00:00:01 --eth-peer=1,50:00:00:00:00:02
This example uses two different sriovNetwork CRs. The environment variable contains the Virtual Function (VF) PCI address that was allocated for the pod. If you use the same network in the pod definition, you must split the pciAddress. It is important to configure the correct MAC addresses of the traffic generator. This example uses custom MAC addresses.
18.8.7. Using a virtual function in RDMA mode with a Mellanox NIC
RDMA over Converged Ethernet (RoCE) is a Technology Preview feature only. Technology Preview features are not supported with Red Hat production service level agreements (SLAs) and might not be functionally complete. Red Hat does not recommend using them in production. These features provide early access to upcoming product features, enabling customers to test functionality and provide feedback during the development process.
For more information about the support scope of Red Hat Technology Preview features, see Technology Preview Features Support Scope.
RDMA over Converged Ethernet (RoCE) is the only supported mode when using RDMA on OpenShift Container Platform.
Prerequisites
-
Install the OpenShift CLI (
oc). - Install the SR-IOV Network Operator.
-
Log in as a user with
cluster-adminprivileges.
Procedure
Create the following
SriovNetworkNodePolicyobject, and then save the YAML in themlx-rdma-node-policy.yamlfile.apiVersion: sriovnetwork.openshift.io/v1 kind: SriovNetworkNodePolicy metadata: name: mlx-rdma-node-policy namespace: openshift-sriov-network-operator spec: resourceName: mlxnics nodeSelector: feature.node.kubernetes.io/network-sriov.capable: "true" priority: <priority> numVfs: <num> nicSelector: vendor: "15b3" deviceID: "1015"1 pfNames: ["<pf_name>", ...] rootDevices: ["<pci_bus_id>", "..."] deviceType: netdevice2 isRdma: true3 NoteSee the
Configuring SR-IOV network devicessection for a detailed explanation on each option inSriovNetworkNodePolicy.When applying the configuration specified in a
SriovNetworkNodePolicyobject, the SR-IOV Operator may drain the nodes, and in some cases, reboot nodes. It may take several minutes for a configuration change to apply. Ensure that there are enough available nodes in your cluster to handle the evicted workload beforehand.After the configuration update is applied, all the pods in the
openshift-sriov-network-operatornamespace will change to aRunningstatus.Create the
SriovNetworkNodePolicyobject by running the following command:$ oc create -f mlx-rdma-node-policy.yamlCreate the following
SriovNetworkobject, and then save the YAML in themlx-rdma-network.yamlfile.apiVersion: sriovnetwork.openshift.io/v1 kind: SriovNetwork metadata: name: mlx-rdma-network namespace: openshift-sriov-network-operator spec: networkNamespace: <target_namespace> ipam: |-1 # ... vlan: <vlan> resourceName: mlxnics- 1
- Specify a configuration object for the ipam CNI plugin as a YAML block scalar. The plugin manages IP address assignment for the attachment definition.
NoteSee the "Configuring SR-IOV additional network" section for a detailed explanation on each option in
SriovNetwork.An optional library, app-netutil, provides several API methods for gathering network information about a container’s parent pod.
Create the
SriovNetworkNodePolicyobject by running the following command:$ oc create -f mlx-rdma-network.yamlCreate the following
Podspec, and then save the YAML in themlx-rdma-pod.yamlfile.apiVersion: v1 kind: Pod metadata: name: rdma-app namespace: <target_namespace>1 annotations: k8s.v1.cni.cncf.io/networks: mlx-rdma-network spec: containers: - name: testpmd image: <RDMA_image>2 securityContext: runAsUser: 0 capabilities: add: ["IPC_LOCK","SYS_RESOURCE","NET_RAW"]3 volumeMounts: - mountPath: /mnt/huge4 name: hugepage resources: limits: memory: "1Gi" cpu: "4"5 hugepages-1Gi: "4Gi"6 requests: memory: "1Gi" cpu: "4" hugepages-1Gi: "4Gi" command: ["sleep", "infinity"] volumes: - name: hugepage emptyDir: medium: HugePages- 1
- Specify the same
target_namespacewhereSriovNetworkobjectmlx-rdma-networkis created. If you would like to create the pod in a different namespace, changetarget_namespacein bothPodspec andSriovNetworkobject. - 2
- Specify the RDMA image which includes your application and RDMA library used by application.
- 3
- Specify additional capabilities required by the application inside the container for hugepage allocation, system resource allocation, and network interface access.
- 4
- Mount the hugepage volume to RDMA pod under
/mnt/huge. The hugepage volume is backed by the emptyDir volume type with the medium beingHugepages. - 5
- Specify number of CPUs. The RDMA pod usually requires exclusive CPUs be allocated from the kubelet. This is achieved by setting CPU Manager policy to
staticand create pod withGuaranteedQoS. - 6
- Specify hugepage size
hugepages-1Giorhugepages-2Miand the quantity of hugepages that will be allocated to the RDMA pod. Configure2Miand1Gihugepages separately. Configuring1Gihugepage requires adding kernel arguments to Nodes.
Create the RDMA pod by running the following command:
$ oc create -f mlx-rdma-pod.yaml
18.8.8. A test pod template for clusters that use OVS-DPDK on OpenStack
The following testpmd pod demonstrates container creation with huge pages, reserved CPUs, and the SR-IOV port.
An example testpmd pod
apiVersion: v1
kind: Pod
metadata:
name: testpmd-dpdk
namespace: mynamespace
annotations:
cpu-load-balancing.crio.io: "disable"
cpu-quota.crio.io: "disable"
# ...
spec:
containers:
- name: testpmd
command: ["sleep", "99999"]
image: registry.redhat.io/openshift4/dpdk-base-rhel8:v4.9
securityContext:
capabilities:
add: ["IPC_LOCK","SYS_ADMIN"]
privileged: true
runAsUser: 0
resources:
requests:
memory: 1000Mi
hugepages-1Gi: 1Gi
cpu: '2'
openshift.io/dpdk1: 1
limits:
hugepages-1Gi: 1Gi
cpu: '2'
memory: 1000Mi
openshift.io/dpdk1: 1
volumeMounts:
- mountPath: /mnt/huge
name: hugepage
readOnly: False
runtimeClassName: performance-cnf-performanceprofile
volumes:
- name: hugepage
emptyDir:
medium: HugePages18.9. Using pod-level bonding
Bonding at the pod level is vital to enable workloads inside pods that require high availability and more throughput. With pod-level bonding, you can create a bond interface from multiple single root I/O virtualization (SR-IOV) virtual function interfaces in a kernel mode interface. The SR-IOV virtual functions are passed into the pod and attached to a kernel driver.
One scenario where pod level bonding is required is creating a bond interface from multiple SR-IOV virtual functions on different physical functions. Creating a bond interface from two different physical functions on the host can be used to achieve high availability and throughput at pod level.
Before you perform any tasks in the following documentation, ensure that you installed the SR-IOV Network Operator.
For guidance on tasks such as creating a SR-IOV network, network policies, network attachment definitions and pods, see Configuring an SR-IOV network device.
18.9.1. Configuring a bond interface from two SR-IOV interfaces
Bonding enables multiple network interfaces to be aggregated into a single logical "bonded" interface. Bond Container Network Interface (Bond-CNI) brings bond capability into containers.
Bond-CNI can be created using Single Root I/O Virtualization (SR-IOV) virtual functions and placing them in the container network namespace.
OpenShift Container Platform only supports Bond-CNI using SR-IOV virtual functions. The SR-IOV Network Operator provides the SR-IOV CNI plugin needed to manage the virtual functions. Other CNIs or types of interfaces are not supported.
Prerequisites
- The SR-IOV Network Operator must be installed and configured to obtain virtual functions in a container.
- To configure SR-IOV interfaces, an SR-IOV network and policy must be created for each interface.
- The SR-IOV Network Operator creates a network attachment definition for each SR-IOV interface, based on the SR-IOV network and policy defined.
-
The
linkStateis set to the default valueautofor the SR-IOV virtual function.
18.9.1.1. Creating a bond network attachment definition
Now that the SR-IOV virtual functions are available, you can create a bond network attachment definition.
apiVersion: "k8s.cni.cncf.io/v1"
kind: NetworkAttachmentDefinition
metadata:
name: bond-net1
namespace: demo
spec:
config: '{
"type": "bond",
"cniVersion": "0.3.1",
"name": "bond-net1",
"mode": "active-backup",
"failOverMac": 1,
"linksInContainer": true,
"miimon": "100",
"mtu": 1500,
"links": [
{"name": "net1"},
{"name": "net2"}
],
"ipam": {
"type": "host-local",
"subnet": "10.56.217.0/24",
"routes": [{
"dst": "0.0.0.0/0"
}],
"gateway": "10.56.217.1"
}
}'- 1
- The cni-type is always set to
bond. - 2
- The
modeattribute specifies the bonding mode.NoteThe bonding modes supported are:
-
balance-rr- 0 -
active-backup- 1 -
balance-xor- 2
For
balance-rrorbalance-xormodes, you must set thetrustmode toonfor the SR-IOV virtual function. -
- 3
- The
failoverattribute is mandatory for active-backup mode and must be set to 1. - 4
- The
linksInContainer=trueflag informs the Bond CNI that the required interfaces are to be found inside the container. By default, Bond CNI looks for these interfaces on the host which does not work for integration with SRIOV and Multus. - 5
- The
linkssection defines which interfaces will be used to create the bond. By default, Multus names the attached interfaces as: "net", plus a consecutive number, starting with one.
18.9.1.2. Creating a pod using a bond interface
Test the setup by creating a pod with a YAML file named for example
podbonding.yamlwith content similar to the following:apiVersion: v1 kind: Pod metadata: name: bondpod1 namespace: demo annotations: k8s.v1.cni.cncf.io/networks: demo/sriovnet1, demo/sriovnet2, demo/bond-net11 spec: containers: - name: podexample image: quay.io/openshift/origin-network-interface-bond-cni:4.11.0 command: ["/bin/bash", "-c", "sleep INF"]- 1
- Note the network annotation: it contains two SR-IOV network attachments, and one bond network attachment. The bond attachment uses the two SR-IOV interfaces as bonded port interfaces.
Apply the yaml by running the following command:
$ oc apply -f podbonding.yamlInspect the pod interfaces with the following command:
$ oc rsh -n demo bondpod1 sh-4.4# sh-4.4# ip a 1: lo: <LOOPBACK,UP,LOWER_UP> mtu 65536 qdisc noqueue state UNKNOWN qlen 1000 link/loopback 00:00:00:00:00:00 brd 00:00:00:00:00:00 inet 127.0.0.1/8 scope host lo valid_lft forever preferred_lft forever 3: eth0@if150: <BROADCAST,MULTICAST,UP,LOWER_UP,M-DOWN> mtu 1450 qdisc noqueue state UP link/ether 62:b1:b5:c8:fb:7a brd ff:ff:ff:ff:ff:ff inet 10.244.1.122/24 brd 10.244.1.255 scope global eth0 valid_lft forever preferred_lft forever 4: net3: <BROADCAST,MULTICAST,UP,LOWER_UP400> mtu 1500 qdisc noqueue state UP qlen 1000 link/ether 9e:23:69:42:fb:8a brd ff:ff:ff:ff:ff:ff1 inet 10.56.217.66/24 scope global bond0 valid_lft forever preferred_lft forever 43: net1: <BROADCAST,MULTICAST,UP,LOWER_UP800> mtu 1500 qdisc mq master bond0 state UP qlen 1000 link/ether 9e:23:69:42:fb:8a brd ff:ff:ff:ff:ff:ff2 44: net2: <BROADCAST,MULTICAST,UP,LOWER_UP800> mtu 1500 qdisc mq master bond0 state UP qlen 1000 link/ether 9e:23:69:42:fb:8a brd ff:ff:ff:ff:ff:ff3 NoteIf no interface names are configured in the pod annotation, interface names are assigned automatically as
net<n>, with<n>starting at1.Optional: If you want to set a specific interface name for example
bond0, edit thek8s.v1.cni.cncf.io/networksannotation and setbond0as the interface name as follows:annotations: k8s.v1.cni.cncf.io/networks: demo/sriovnet1, demo/sriovnet2, demo/bond-net1@bond0
18.10. Configuring hardware offloading
As a cluster administrator, you can configure hardware offloading on compatible nodes to increase data processing performance and reduce load on host CPUs.
Before you perform any tasks in the following documentation, ensure that you installed the SR-IOV Network Operator.
18.10.1. About hardware offloading
Open vSwitch hardware offloading is a method of processing network tasks by diverting them away from the CPU and offloading them to a dedicated processor on a network interface controller. As a result, clusters can benefit from faster data transfer speeds, reduced CPU workloads, and lower computing costs.
The key element for this feature is a modern class of network interface controllers known as SmartNICs. A SmartNIC is a network interface controller that is able to handle computationally-heavy network processing tasks. In the same way that a dedicated graphics card can improve graphics performance, a SmartNIC can improve network performance. In each case, a dedicated processor improves performance for a specific type of processing task.
In OpenShift Container Platform, you can configure hardware offloading for bare metal nodes that have a compatible SmartNIC. Hardware offloading is configured and enabled by the SR-IOV Network Operator.
Hardware offloading is not compatible with all workloads or application types. Only the following two communication types are supported:
- pod-to-pod
- pod-to-service, where the service is a ClusterIP service backed by a regular pod
In all cases, hardware offloading takes place only when those pods and services are assigned to nodes that have a compatible SmartNIC. Suppose, for example, that a pod on a node with hardware offloading tries to communicate with a service on a regular node. On the regular node, all the processing takes place in the kernel, so the overall performance of the pod-to-service communication is limited to the maximum performance of that regular node. Hardware offloading is not compatible with DPDK applications.
Enabling hardware offloading on a node, but not configuring pods to use, it can result in decreased throughput performance for pod traffic. You cannot configure hardware offloading for pods that are managed by OpenShift Container Platform.
18.10.2. Prerequisites
- Your cluster has at least one bare metal machine with a network interface controller that is supported for hardware offloading.
- You installed the SR-IOV Network Operator.
- Your cluster uses the OVN-Kubernetes network plugin.
-
In your OVN-Kubernetes network plugin configuration, the
gatewayConfig.routingViaHostfield is set tofalse.
18.10.3. Setting the SR-IOV Network Operator into systemd mode
To support hardware offloading, you must first set the SR-IOV Network Operator into systemd mode.
Prerequisites
-
You installed the OpenShift CLI (
oc). -
You have access to the cluster as a user that has the
cluster-adminrole.
Procedure
Create a
SriovOperatorConfigcustom resource (CR) to deploy all the SR-IOV Operator components:Create a file named
sriovOperatorConfig.yamlthat contains the following YAML:apiVersion: sriovnetwork.openshift.io/v1 kind: SriovOperatorConfig metadata: name: default1 namespace: openshift-sriov-network-operator spec: enableInjector: true enableOperatorWebhook: true configurationMode: "systemd"2 logLevel: 2Create the resource by running the following command:
$ oc apply -f sriovOperatorConfig.yaml
18.10.4. Configuring a machine config pool for hardware offloading
To enable hardware offloading, you now create a dedicated machine config pool and configure it to work with the SR-IOV Network Operator.
Prerequisites
-
SR-IOV Network Operator installed and set into
systemdmode.
Procedure
Create a machine config pool for machines you want to use hardware offloading on.
Create a file, such as
mcp-offloading.yaml, with content like the following example:apiVersion: machineconfiguration.openshift.io/v1 kind: MachineConfigPool metadata: name: mcp-offloading1 spec: machineConfigSelector: matchExpressions: - {key: machineconfiguration.openshift.io/role, operator: In, values: [worker,mcp-offloading]}2 nodeSelector: matchLabels: node-role.kubernetes.io/mcp-offloading: ""3 Apply the configuration for the machine config pool:
$ oc create -f mcp-offloading.yaml
Add nodes to the machine config pool. Label each node with the node role label of your pool:
$ oc label node worker-2 node-role.kubernetes.io/mcp-offloading=""Optional: To verify that the new pool is created, run the following command:
$ oc get nodesExample output
NAME STATUS ROLES AGE VERSION master-0 Ready master 2d v1.32.3 master-1 Ready master 2d v1.32.3 worker-0 Ready worker 2d v1.32.3 worker-1 Ready worker 2d v1.32.3 worker-2 Ready mcp-offloading,worker 47h v1.32.3Add this machine config pool to the
SriovNetworkPoolConfigcustom resource:Create a file, such as
sriov-pool-config.yaml, with content like the following example:apiVersion: sriovnetwork.openshift.io/v1 kind: SriovNetworkPoolConfig metadata: name: sriovnetworkpoolconfig-offload namespace: openshift-sriov-network-operator spec: ovsHardwareOffloadConfig: name: mcp-offloading1 - 1
- The name of your machine config pool for hardware offloading.
Apply the configuration:
$ oc create -f <SriovNetworkPoolConfig_name>.yamlNoteWhen you apply the configuration specified in a
SriovNetworkPoolConfigobject, the SR-IOV Operator drains and restarts the nodes in the machine config pool.It might take several minutes for a configuration changes to apply.
18.10.5. Configuring the SR-IOV network node policy
You can create an SR-IOV network device configuration for a node by creating an SR-IOV network node policy. To enable hardware offloading, you must define the .spec.eSwitchMode field with the value "switchdev".
The following procedure creates an SR-IOV interface for a network interface controller with hardware offloading.
Prerequisites
-
You installed the OpenShift CLI (
oc). -
You have access to the cluster as a user with the
cluster-adminrole.
Procedure
Create a file, such as
sriov-node-policy.yaml, with content like the following example:apiVersion: sriovnetwork.openshift.io/v1 kind: SriovNetworkNodePolicy metadata: name: sriov-node-policy1 namespace: openshift-sriov-network-operator spec: deviceType: netdevice2 eSwitchMode: "switchdev"3 nicSelector: deviceID: "1019" rootDevices: - 0000:d8:00.0 vendor: "15b3" pfNames: - ens8f0 nodeSelector: feature.node.kubernetes.io/network-sriov.capable: "true" numVfs: 6 priority: 5 resourceName: mlxnicsApply the configuration for the policy:
$ oc create -f sriov-node-policy.yamlNoteWhen you apply the configuration specified in a
SriovNetworkPoolConfigobject, the SR-IOV Operator drains and restarts the nodes in the machine config pool.It might take several minutes for a configuration change to apply.
18.10.5.1. An example SR-IOV network node policy for OpenStack
The following example describes an SR-IOV interface for a network interface controller (NIC) with hardware offloading on Red Hat OpenStack Platform (RHOSP).
An SR-IOV interface for a NIC with hardware offloading on RHOSP
apiVersion: sriovnetwork.openshift.io/v1
kind: SriovNetworkNodePolicy
metadata:
name: ${name}
namespace: openshift-sriov-network-operator
spec:
deviceType: switchdev
isRdma: true
nicSelector:
netFilter: openstack/NetworkID:${net_id}
nodeSelector:
feature.node.kubernetes.io/network-sriov.capable: 'true'
numVfs: 1
priority: 99
resourceName: ${name}18.10.6. Improving network traffic performance using a virtual function
Follow this procedure to assign a virtual function to the OVN-Kubernetes management port and increase its network traffic performance.
This procedure results in the creation of two pools: the first has a virtual function used by OVN-Kubernetes, and the second comprises the remaining virtual functions.
Prerequisites
-
You installed the OpenShift CLI (
oc). -
You have access to the cluster as a user with the
cluster-adminrole.
Procedure
Add the
network.operator.openshift.io/smart-niclabel to each worker node with a SmartNIC present by running the following command:$ oc label node <node-name> network.operator.openshift.io/smart-nic=Use the
oc get nodescommand to get a list of the available nodes.Create a policy named
sriov-node-mgmt-vf-policy.yamlfor the management port with content such as the following example:apiVersion: sriovnetwork.openshift.io/v1 kind: SriovNetworkNodePolicy metadata: name: sriov-node-mgmt-vf-policy namespace: openshift-sriov-network-operator spec: deviceType: netdevice eSwitchMode: "switchdev" nicSelector: deviceID: "1019" rootDevices: - 0000:d8:00.0 vendor: "15b3" pfNames: - ens8f0#0-01 nodeSelector: network.operator.openshift.io/smart-nic: "" numVfs: 62 priority: 5 resourceName: mgmtvf- 1
- Replace this device with the appropriate network device for your use case. The
#0-0part of thepfNamesvalue reserves a single virtual function used by OVN-Kubernetes. - 2
- The value provided here is an example. Replace this value with one that meets your requirements. For more information, see SR-IOV network node configuration object in the Additional resources section.
Create a policy named
sriov-node-policy.yamlwith content such as the following example:apiVersion: sriovnetwork.openshift.io/v1 kind: SriovNetworkNodePolicy metadata: name: sriov-node-policy namespace: openshift-sriov-network-operator spec: deviceType: netdevice eSwitchMode: "switchdev" nicSelector: deviceID: "1019" rootDevices: - 0000:d8:00.0 vendor: "15b3" pfNames: - ens8f0#1-51 nodeSelector: network.operator.openshift.io/smart-nic: "" numVfs: 62 priority: 5 resourceName: mlxnics- 1
- Replace this device with the appropriate network device for your use case.
- 2
- The value provided here is an example. Replace this value with the value specified in the
sriov-node-mgmt-vf-policy.yamlfile. For more information, see SR-IOV network node configuration object in the Additional resources section.
NoteThe
sriov-node-mgmt-vf-policy.yamlfile has different values for thepfNamesandresourceNamekeys than thesriov-node-policy.yamlfile.Apply the configuration for both policies:
$ oc create -f sriov-node-policy.yaml$ oc create -f sriov-node-mgmt-vf-policy.yamlCreate a Cluster Network Operator (CNO) ConfigMap in the cluster for the management configuration:
Create a ConfigMap named
hardware-offload-config.yamlwith the following contents:apiVersion: v1 kind: ConfigMap metadata: name: hardware-offload-config namespace: openshift-network-operator data: mgmt-port-resource-name: openshift.io/mgmtvfApply the configuration for the ConfigMap:
$ oc create -f hardware-offload-config.yaml
18.10.7. Creating a network attachment definition
After you define the machine config pool and the SR-IOV network node policy, you can create a network attachment definition for the network interface card you specified.
Prerequisites
-
You installed the OpenShift CLI (
oc). -
You have access to the cluster as a user with the
cluster-adminrole.
Procedure
Create a file, such as
net-attach-def.yaml, with content like the following example:apiVersion: "k8s.cni.cncf.io/v1" kind: NetworkAttachmentDefinition metadata: name: net-attach-def1 namespace: net-attach-def2 annotations: k8s.v1.cni.cncf.io/resourceName: openshift.io/mlxnics3 spec: config: '{"cniVersion":"0.3.1","name":"ovn-kubernetes","type":"ovn-k8s-cni-overlay","ipam":{},"dns":{}}'Apply the configuration for the network attachment definition:
$ oc create -f net-attach-def.yaml
Verification
Run the following command to check that the new definition exists:
$ oc get net-attach-def -AThe output shows the namespace, name, and age of the new definition.
18.10.8. Adding the network attachment definition to your pods
After you create the machine config pool, the SriovNetworkPoolConfig and SriovNetworkNodePolicy custom resources, and the network attachment definition, you can apply these configurations to your pods by adding the network attachment definition to your pod specifications.
Procedure
In the pod specification, add the
.metadata.annotations.k8s.v1.cni.cncf.io/networksfield and specify the network attachment definition you created for hardware offloading:.... metadata: annotations: v1.multus-cni.io/default-network: net-attach-def/net-attach-def1 - 1
- The value must be the name and namespace of the network attachment definition you created for hardware offloading.
18.11. Switching Bluefield-2 from DPU to NIC
You can switch the Bluefield-2 network device from data processing unit (DPU) mode to network interface controller (NIC) mode.
Before you perform any tasks in the following documentation, ensure that you installed the SR-IOV Network Operator.
18.11.1. Switching Bluefield-2 from DPU mode to NIC mode
Use the following procedure to switch Bluefield-2 from data processing units (DPU) mode to network interface controller (NIC) mode.
Currently, only switching Bluefield-2 from DPU to NIC mode is supported. Switching from NIC mode to DPU mode is unsupported.
Prerequisites
- You have installed the SR-IOV Network Operator. For more information, see "Installing SR-IOV Network Operator".
- You have updated Bluefield-2 to the latest firmware. For more information, see Firmware for NVIDIA BlueField-2.
Procedure
Add the following label to each of your compute nodes by entering the following command. You must run the command for each compute node.
$ oc label node <node_name> node-role.kubernetes.io/sriov=
where:
node_name- Refers to the name of a compute node.
Create a machine config pool for the SR-IOV Network Operator, for example:
apiVersion: machineconfiguration.openshift.io/v1 kind: MachineConfigPool metadata: name: sriov spec: machineConfigSelector: matchExpressions: - {key: machineconfiguration.openshift.io/role, operator: In, values: [worker,sriov]} nodeSelector: matchLabels: node-role.kubernetes.io/sriov: ""Apply the following
machineconfig.yamlfile to the compute nodes:apiVersion: machineconfiguration.openshift.io/v1 kind: MachineConfig metadata: labels: machineconfiguration.openshift.io/role: sriov name: 99-bf2-dpu spec: config: ignition: version: 3.2.0 storage: files: - contents: source: data:text/plain;charset=utf-8;base64,ZmluZF9jb250YWluZXIoKSB7CiAgY3JpY3RsIHBzIC1vIGpzb24gfCBqcSAtciAnLmNvbnRhaW5lcnNbXSB8IHNlbGVjdCgubWV0YWRhdGEubmFtZT09InNyaW92LW5ldHdvcmstY29uZmlnLWRhZW1vbiIpIHwgLmlkJwp9CnVudGlsIG91dHB1dD0kKGZpbmRfY29udGFpbmVyKTsgW1sgLW4gIiRvdXRwdXQiIF1dOyBkbwogIGVjaG8gIndhaXRpbmcgZm9yIGNvbnRhaW5lciB0byBjb21lIHVwIgogIHNsZWVwIDE7CmRvbmUKISBzdWRvIGNyaWN0bCBleGVjICRvdXRwdXQgL2JpbmRhdGEvc2NyaXB0cy9iZjItc3dpdGNoLW1vZGUuc2ggIiRAIgo= mode: 0755 overwrite: true path: /etc/default/switch_in_sriov_config_daemon.sh systemd: units: - name: dpu-switch.service enabled: true contents: | [Unit] Description=Switch BlueField2 card to NIC/DPU mode RequiresMountsFor=%t/containers Wants=network.target After=network-online.target kubelet.service [Service] SuccessExitStatus=0 120 RemainAfterExit=True ExecStart=/bin/bash -c '/etc/default/switch_in_sriov_config_daemon.sh nic || shutdown -r now'1 Type=oneshot [Install] WantedBy=multi-user.target- 1
- Optional: The PCI address of a specific card can optionally be specified, for example
ExecStart=/bin/bash -c '/etc/default/switch_in_sriov_config_daemon.sh nic 0000:5e:00.0 || echo done'. By default, the first device is selected. If there is more than one device, you must specify which PCI address to be used. The PCI address must be the same on all nodes that are switching Bluefield-2 from DPU mode to NIC mode.
- Wait for the compute nodes to restart. After restarting, the Bluefield-2 network device on the compute nodes is switched into NIC mode.
- Optional: You might need to restart the host hardware because most recent Bluefield-2 firmware releases require a hardware restart to switch into NIC mode.
Chapter 19. OVN-Kubernetes network plugin
19.1. About the OVN-Kubernetes network plugin
The OpenShift Container Platform cluster uses a virtualized network for pod and service networks.
Part of Red Hat OpenShift Networking, the OVN-Kubernetes network plugin is the default network provider for OpenShift Container Platform. OVN-Kubernetes is based on Open Virtual Network (OVN) and provides an overlay-based networking implementation. A cluster that uses the OVN-Kubernetes plugin also runs Open vSwitch (OVS) on each node. OVN configures OVS on each node to implement the declared network configuration.
OVN-Kubernetes is the default networking solution for OpenShift Container Platform and single-node OpenShift deployments.
OVN-Kubernetes, which arose from the OVS project, uses many of the same constructs, such as open flow rules, to decide how packets travel through the network. For more information, see the Open Virtual Network website.
OVN-Kubernetes is a series of daemons for OVS that transform virtual network configurations into OpenFlow rules. OpenFlow is a protocol for communicating with network switches and routers, providing a means for remotely controlling the flow of network traffic on a network device. This means that network administrators can configure, manage, and watch the flow of network traffic.
OVN-Kubernetes provides more of the advanced functionality not available with OpenFlow. OVN supports distributed virtual routing, distributed logical switches, access control, Dynamic Host Configuration Protocol (DHCP), and DNS. OVN implements distributed virtual routing within logic flows that equate to open flows. For example, if you have a pod that sends out a DHCP request to the DHCP server on the network, a logic flow rule in the request helps the OVN-Kubernetes handle the packet. This means that the server can respond with gateway, DNS server, IP address, and other information.
OVN-Kubernetes runs a daemon on each node. There are daemon sets for the databases and for the OVN controller that run on every node. The OVN controller programs the Open vSwitch daemon on the nodes to support the following network provider features:
- Egress IPs
- Firewalls
- Hardware offloading
- Hybrid networking
- Internet Protocol Security (IPsec) encryption
- IPv6
- Multicast.
- Network policy and network policy logs
- Routers
19.1.1. OVN-Kubernetes purpose
The OVN-Kubernetes network plugin is an open-source, fully-featured Kubernetes CNI plugin that uses Open Virtual Network (OVN) to manage network traffic flows. OVN is a community developed, vendor-agnostic network virtualization solution. The OVN-Kubernetes network plugin:
- Uses OVN (Open Virtual Network) to manage network traffic flows. OVN is a community developed, vendor-agnostic network virtualization solution.
- Implements Kubernetes network policy support, including ingress and egress rules.
- Uses the Geneve (Generic Network Virtualization Encapsulation) protocol rather than VXLAN to create an overlay network between nodes.
The OVN-Kubernetes network plugin provides the following advantages over OpenShift SDN.
- Full support for IPv6 single-stack and IPv4/IPv6 dual-stack networking on supported platforms
- Support for hybrid clusters with both Linux and Microsoft Windows workloads
- Optional IPsec encryption of intra-cluster communications
- Offload of network data processing from host CPU to compatible network cards and data processing units (DPUs)
19.1.2. Supported network plugin feature matrix
Red Hat OpenShift Networking offers two options for the network plugin, OpenShift SDN and OVN-Kubernetes, for the network plugin. The following table summarizes the current feature support for both network plugins:
| Feature | OpenShift SDN | OVN-Kubernetes |
|---|---|---|
| Egress IPs | Supported | Supported |
| Egress firewall | Supported | Supported [1] |
| Egress router | Supported | Supported [2] |
| Hybrid networking | Not supported | Supported |
| IPsec encryption for intra-cluster communication | Not supported | Supported |
| IPv4 single-stack | Supported | Supported |
| IPv6 single-stack | Not supported | Supported [3] |
| IPv4/IPv6 dual-stack | Not Supported | Supported [4] |
| IPv6/IPv4 dual-stack | Not supported | Supported [5] |
| Kubernetes network policy | Supported | Supported |
| Kubernetes network policy logs | Not supported | Supported |
| Hardware offloading | Not supported | Supported |
| Multicast | Supported | Supported |
- Egress firewall is also known as egress network policy in OpenShift SDN. This is not the same as network policy egress.
- Egress router for OVN-Kubernetes supports only redirect mode.
- IPv6 single-stack networking on a bare-metal platform.
- IPv4/IPv6 dual-stack networking on bare-metal, VMware vSphere (installer-provisioned infrastructure installations only), IBM Power®, IBM Z®, and RHOSP platforms.
- IPv6/IPv4 dual-stack networking on bare-metal, VMware vSphere (installer-provisioned infrastructure installations only), and IBM Power® platforms.
19.1.3. OVN-Kubernetes IPv6 and dual-stack limitations
IPv6 and dual-stack networking for the OVN-Kubernetes network plugin in {microshift-short} have specific limitations that affect gateway configuration, routing, and cluster stability.
For clusters configured for dual-stack networking, both IPv4 and IPv6 traffic must use the same network interface as the default gateway.
If this requirement is not met, pods on the host in the
ovnkube-nodedaemon set enter theCrashLoopBackOffstate.If you display a pod with a command such as
oc get pod -n openshift-ovn-kubernetes -l app=ovnkube-node -o yaml, thestatusfield has more than one message about the default gateway, as shown in the following output:I1006 16:09:50.985852 60651 helper_linux.go:73] Found default gateway interface br-ex 192.168.127.1 I1006 16:09:50.985923 60651 helper_linux.go:73] Found default gateway interface ens4 fe80::5054:ff:febe:bcd4 F1006 16:09:50.985939 60651 ovnkube.go:130] multiple gateway interfaces detected: br-ex ens4The only resolution is to reconfigure the host networking so that both IP families use the same network interface for the default gateway.
For clusters configured for dual-stack networking, both the IPv4 and IPv6 routing tables must contain the default gateway.
If this requirement is not met, pods on the host in the
ovnkube-nodedaemon set enter theCrashLoopBackOffstate.If you display a pod with a command such as
oc get pod -n openshift-ovn-kubernetes -l app=ovnkube-node -o yaml, thestatusfield has more than one message about the default gateway, as shown in the following output:I0512 19:07:17.589083 108432 helper_linux.go:74] Found default gateway interface br-ex 192.168.123.1 F0512 19:07:17.589141 108432 ovnkube.go:133] failed to get default gateway interfaceThe only resolution is to reconfigure the host networking so that both IP families contain the default gateway.
-
If you set the
ipv6.disableparameter to1in thekernelArgumentsection of theMachineConfigcustom resource (CR) for your cluster, OVN-Kubernetes pods enter aCrashLoopBackOffstate. Additionally, updating your cluster to a later version of OpenShift Container Platform fails because the Network Operator remains on aDegradedstate. Red Hat does not support disabling IPv6 addresses for your cluster so do not set theipv6.disableparameter to1.
19.1.4. Session affinity
Session affinity is a feature that applies to Kubernetes Service objects. You can use session affinity if you want to ensure that each time you connect to a <service_VIP>:<Port>, the traffic is always load balanced to the same back end. For more information, including how to set session affinity based on a client’s IP address, see Session affinity.
19.1.4.1. Stickiness timeout for session affinity
The OVN-Kubernetes network plugin for OpenShift Container Platform calculates the stickiness timeout for a session from a client based on the last packet. For example, if you run a curl command 10 times, the sticky session timer starts from the tenth packet not the first. As a result, if the client is continuously contacting the service, then the session never times out. The timeout starts when the service has not received a packet for the amount of time set by the timeoutSeconds parameter.
19.2. OVN-Kubernetes architecture
19.2.1. Introduction to OVN-Kubernetes architecture
The following diagram shows the OVN-Kubernetes architecture.
Figure 19.1. OVK-Kubernetes architecture

The key components are:
- Cloud Management System (CMS) - A platform specific client for OVN that provides a CMS specific plugin for OVN integration. The plugin translates the cloud management system’s concept of the logical network configuration, stored in the CMS configuration database in a CMS-specific format, into an intermediate representation understood by OVN.
-
OVN Northbound database (
nbdb) container - Stores the logical network configuration passed by the CMS plugin. -
OVN Southbound database (
sbdb) container - Stores the physical and logical network configuration state for Open vSwitch (OVS) system on each node, including tables that bind them. -
OVN north daemon (
ovn-northd) - This is the intermediary client betweennbdbcontainer andsbdbcontainer. It translates the logical network configuration in terms of conventional network concepts, taken from thenbdbcontainer, into logical data path flows in thesbdbcontainer. The container name forovn-northddaemon isnorthdand it runs in theovnkube-nodepods. -
ovn-controller - This is the OVN agent that interacts with OVS and hypervisors, for any information or update that is needed for
sbdbcontainer. Theovn-controllerreads logical flows from thesbdbcontainer, translates them intoOpenFlowflows and sends them to the node’s OVS daemon. The container name isovn-controllerand it runs in theovnkube-nodepods.
The OVN northd, northbound database, and southbound database run on each node in the cluster and mostly contain and process information that is local to that node.
The OVN northbound database has the logical network configuration passed down to it by the cloud management system (CMS). The OVN northbound database contains the current desired state of the network, presented as a collection of logical ports, logical switches, logical routers, and more. The ovn-northd (northd container) connects to the OVN northbound database and the OVN southbound database. It translates the logical network configuration in terms of conventional network concepts, taken from the OVN northbound database, into logical data path flows in the OVN southbound database.
The OVN southbound database has physical and logical representations of the network and binding tables that link them together. It contains the chassis information of the node and other constructs like remote transit switch ports that are required to connect to the other nodes in the cluster. The OVN southbound database also contains all the logic flows. The logic flows are shared with the ovn-controller process that runs on each node and the ovn-controller turns those into OpenFlow rules to program Open vSwitch(OVS).
The Kubernetes control plane nodes contain two ovnkube-control-plane pods on separate nodes, which perform the central IP address management (IPAM) allocation for each node in the cluster. At any given time, a single ovnkube-control-plane pod is the leader.
19.2.2. Listing all resources in the OVN-Kubernetes project
Finding the resources and containers that run in the OVN-Kubernetes project is important to help you understand the OVN-Kubernetes networking implementation.
Prerequisites
-
Access to the cluster as a user with the
cluster-adminrole. -
The OpenShift CLI (
oc) installed.
Procedure
Run the following command to get all resources, endpoints, and
ConfigMapsin the OVN-Kubernetes project:$ oc get all,ep,cm -n openshift-ovn-kubernetesExample output
Warning: apps.openshift.io/v1 DeploymentConfig is deprecated in v4.14+, unavailable in v4.10000+ NAME READY STATUS RESTARTS AGE pod/ovnkube-control-plane-65c6f55656-6d55h 2/2 Running 0 114m pod/ovnkube-control-plane-65c6f55656-fd7vw 2/2 Running 2 (104m ago) 114m pod/ovnkube-node-bcvts 8/8 Running 0 113m pod/ovnkube-node-drgvv 8/8 Running 0 113m pod/ovnkube-node-f2pxt 8/8 Running 0 113m pod/ovnkube-node-frqsb 8/8 Running 0 105m pod/ovnkube-node-lbxkk 8/8 Running 0 105m pod/ovnkube-node-tt7bx 8/8 Running 1 (102m ago) 105m NAME TYPE CLUSTER-IP EXTERNAL-IP PORT(S) AGE service/ovn-kubernetes-control-plane ClusterIP None <none> 9108/TCP 114m service/ovn-kubernetes-node ClusterIP None <none> 9103/TCP,9105/TCP 114m NAME DESIRED CURRENT READY UP-TO-DATE AVAILABLE NODE SELECTOR AGE daemonset.apps/ovnkube-node 6 6 6 6 6 beta.kubernetes.io/os=linux 114m NAME READY UP-TO-DATE AVAILABLE AGE deployment.apps/ovnkube-control-plane 3/3 3 3 114m NAME DESIRED CURRENT READY AGE replicaset.apps/ovnkube-control-plane-65c6f55656 3 3 3 114m NAME ENDPOINTS AGE endpoints/ovn-kubernetes-control-plane 10.0.0.3:9108,10.0.0.4:9108,10.0.0.5:9108 114m endpoints/ovn-kubernetes-node 10.0.0.3:9105,10.0.0.4:9105,10.0.0.5:9105 + 9 more... 114m NAME DATA AGE configmap/control-plane-status 1 113m configmap/kube-root-ca.crt 1 114m configmap/openshift-service-ca.crt 1 114m configmap/ovn-ca 1 114m configmap/ovnkube-config 1 114m configmap/signer-ca 1 114mThere is one
ovnkube-nodepod for each node in the cluster. Theovnkube-configconfig map has the OpenShift Container Platform OVN-Kubernetes configurations.List all of the containers in the
ovnkube-nodepods by running the following command:$ oc get pods ovnkube-node-bcvts -o jsonpath='{.spec.containers[*].name}' -n openshift-ovn-kubernetesExpected output
ovn-controller ovn-acl-logging kube-rbac-proxy-node kube-rbac-proxy-ovn-metrics northd nbdb sbdb ovnkube-controllerThe
ovnkube-nodepod is made up of several containers. It is responsible for hosting the northbound database (nbdbcontainer), the southbound database (sbdbcontainer), the north daemon (northdcontainer),ovn-controllerand theovnkube-controllercontainer. Theovnkube-controllercontainer watches for API objects like pods, egress IPs, namespaces, services, endpoints, egress firewall, and network policies. It is also responsible for allocating pod IP from the available subnet pool for that node.List all the containers in the
ovnkube-control-planepods by running the following command:$ oc get pods ovnkube-control-plane-65c6f55656-6d55h -o jsonpath='{.spec.containers[*].name}' -n openshift-ovn-kubernetesExpected output
kube-rbac-proxy ovnkube-cluster-managerThe
ovnkube-control-planepod has a container (ovnkube-cluster-manager) that resides on each OpenShift Container Platform node. Theovnkube-cluster-managercontainer allocates pod subnet, transit switch subnet IP and join switch subnet IP to each node in the cluster. Thekube-rbac-proxycontainer monitors metrics for theovnkube-cluster-managercontainer.
19.2.3. Listing the OVN-Kubernetes northbound database contents
Each node is controlled by the ovnkube-controller container running in the ovnkube-node pod on that node. To understand the OVN logical networking entities you need to examine the northbound database that is running as a container inside the ovnkube-node pod on that node to see what objects are in the node you wish to see.
Prerequisites
-
Access to the cluster as a user with the
cluster-adminrole. -
The OpenShift CLI (
oc) installed.
To run ovn nbctl or sbctl commands in a cluster you must open a remote shell into the nbdb or sbdb containers on the relevant node
List pods by running the following command:
$ oc get po -n openshift-ovn-kubernetesExample output
NAME READY STATUS RESTARTS AGE ovnkube-control-plane-8444dff7f9-4lh9k 2/2 Running 0 27m ovnkube-control-plane-8444dff7f9-5rjh9 2/2 Running 0 27m ovnkube-node-55xs2 8/8 Running 0 26m ovnkube-node-7r84r 8/8 Running 0 16m ovnkube-node-bqq8p 8/8 Running 0 17m ovnkube-node-mkj4f 8/8 Running 0 26m ovnkube-node-mlr8k 8/8 Running 0 26m ovnkube-node-wqn2m 8/8 Running 0 16mOptional: To list the pods with node information, run the following command:
$ oc get pods -n openshift-ovn-kubernetes -owideExample output
NAME READY STATUS RESTARTS AGE IP NODE NOMINATED NODE READINESS GATES ovnkube-control-plane-8444dff7f9-4lh9k 2/2 Running 0 27m 10.0.0.3 ci-ln-t487nnb-72292-mdcnq-master-1 <none> <none> ovnkube-control-plane-8444dff7f9-5rjh9 2/2 Running 0 27m 10.0.0.4 ci-ln-t487nnb-72292-mdcnq-master-2 <none> <none> ovnkube-node-55xs2 8/8 Running 0 26m 10.0.0.4 ci-ln-t487nnb-72292-mdcnq-master-2 <none> <none> ovnkube-node-7r84r 8/8 Running 0 17m 10.0.128.3 ci-ln-t487nnb-72292-mdcnq-worker-b-wbz7z <none> <none> ovnkube-node-bqq8p 8/8 Running 0 17m 10.0.128.2 ci-ln-t487nnb-72292-mdcnq-worker-a-lh7ms <none> <none> ovnkube-node-mkj4f 8/8 Running 0 27m 10.0.0.5 ci-ln-t487nnb-72292-mdcnq-master-0 <none> <none> ovnkube-node-mlr8k 8/8 Running 0 27m 10.0.0.3 ci-ln-t487nnb-72292-mdcnq-master-1 <none> <none> ovnkube-node-wqn2m 8/8 Running 0 17m 10.0.128.4 ci-ln-t487nnb-72292-mdcnq-worker-c-przlm <none> <none>Navigate into a pod to look at the northbound database by running the following command:
$ oc rsh -c nbdb -n openshift-ovn-kubernetes ovnkube-node-55xs2Run the following command to show all the objects in the northbound database:
$ ovn-nbctl showThe output is too long to list here. The list includes the NAT rules, logical switches, load balancers and so on.
You can narrow down and focus on specific components by using some of the following optional commands:
Run the following command to show the list of logical routers:
$ oc exec -n openshift-ovn-kubernetes -it ovnkube-node-55xs2 \ -c northd -- ovn-nbctl lr-listExample output
45339f4f-7d0b-41d0-b5f9-9fca9ce40ce6 (GR_ci-ln-t487nnb-72292-mdcnq-master-2) 96a0a0f0-e7ed-4fec-8393-3195563de1b8 (ovn_cluster_router)NoteFrom this output you can see there is router on each node plus an
ovn_cluster_router.Run the following command to show the list of logical switches:
$ oc exec -n openshift-ovn-kubernetes -it ovnkube-node-55xs2 \ -c nbdb -- ovn-nbctl ls-listExample output
bdd7dc3d-d848-4a74-b293-cc15128ea614 (ci-ln-t487nnb-72292-mdcnq-master-2) b349292d-ee03-4914-935f-1940b6cb91e5 (ext_ci-ln-t487nnb-72292-mdcnq-master-2) 0aac0754-ea32-4e33-b086-35eeabf0a140 (join) 992509d7-2c3f-4432-88db-c179e43592e5 (transit_switch)NoteFrom this output you can see there is an ext switch for each node plus switches with the node name itself and a join switch.
Run the following command to show the list of load balancers:
$ oc exec -n openshift-ovn-kubernetes -it ovnkube-node-55xs2 \ -c nbdb -- ovn-nbctl lb-listExample output
UUID LB PROTO VIP IPs 7c84c673-ed2a-4436-9a1f-9bc5dd181eea Service_default/ tcp 172.30.0.1:443 10.0.0.3:6443,169.254.169.2:6443,10.0.0.5:6443 4d663fd9-ddc8-4271-b333-4c0e279e20bb Service_default/ tcp 172.30.0.1:443 10.0.0.3:6443,10.0.0.4:6443,10.0.0.5:6443 292eb07f-b82f-4962-868a-4f541d250bca Service_openshif tcp 172.30.105.247:443 10.129.0.12:8443 034b5a7f-bb6a-45e9-8e6d-573a82dc5ee3 Service_openshif tcp 172.30.192.38:443 10.0.0.3:10259,10.0.0.4:10259,10.0.0.5:10259 a68bb53e-be84-48df-bd38-bdd82fcd4026 Service_openshif tcp 172.30.161.125:8443 10.129.0.32:8443 6cc21b3d-2c54-4c94-8ff5-d8e017269c2e Service_openshif tcp 172.30.3.144:443 10.129.0.22:8443 37996ffd-7268-4862-a27f-61cd62e09c32 Service_openshif tcp 172.30.181.107:443 10.129.0.18:8443 81d4da3c-f811-411f-ae0c-bc6713d0861d Service_openshif tcp 172.30.228.23:443 10.129.0.29:8443 ac5a4f3b-b6ba-4ceb-82d0-d84f2c41306e Service_openshif tcp 172.30.14.240:9443 10.129.0.36:9443 c88979fb-1ef5-414b-90ac-43b579351ac9 Service_openshif tcp 172.30.231.192:9001 10.128.0.5:9001,10.128.2.5:9001,10.129.0.5:9001,10.129.2.4:9001,10.130.0.3:9001,10.131.0.3:9001 fcb0a3fb-4a77-4230-a84a-be45dce757e8 Service_openshif tcp 172.30.189.92:443 10.130.0.17:8440 67ef3e7b-ceb9-4bf0-8d96-b43bde4c9151 Service_openshif tcp 172.30.67.218:443 10.129.0.9:8443 d0032fba-7d5e-424a-af25-4ab9b5d46e81 Service_openshif tcp 172.30.102.137:2379 10.0.0.3:2379,10.0.0.4:2379,10.0.0.5:2379 tcp 172.30.102.137:9979 10.0.0.3:9979,10.0.0.4:9979,10.0.0.5:9979 7361c537-3eec-4e6c-bc0c-0522d182abd4 Service_openshif tcp 172.30.198.215:9001 10.0.0.3:9001,10.0.0.4:9001,10.0.0.5:9001,10.0.128.2:9001,10.0.128.3:9001,10.0.128.4:9001 0296c437-1259-410b-a6fd-81c310ad0af5 Service_openshif tcp 172.30.198.215:9001 10.0.0.3:9001,169.254.169.2:9001,10.0.0.5:9001,10.0.128.2:9001,10.0.128.3:9001,10.0.128.4:9001 5d5679f5-45b8-479d-9f7c-08b123c688b8 Service_openshif tcp 172.30.38.253:17698 10.128.0.52:17698,10.129.0.84:17698,10.130.0.60:17698 2adcbab4-d1c9-447d-9573-b5dc9f2efbfa Service_openshif tcp 172.30.148.52:443 10.0.0.4:9202,10.0.0.5:9202 tcp 172.30.148.52:444 10.0.0.4:9203,10.0.0.5:9203 tcp 172.30.148.52:445 10.0.0.4:9204,10.0.0.5:9204 tcp 172.30.148.52:446 10.0.0.4:9205,10.0.0.5:9205 2a33a6d7-af1b-4892-87cc-326a380b809b Service_openshif tcp 172.30.67.219:9091 10.129.2.16:9091,10.131.0.16:9091 tcp 172.30.67.219:9092 10.129.2.16:9092,10.131.0.16:9092 tcp 172.30.67.219:9093 10.129.2.16:9093,10.131.0.16:9093 tcp 172.30.67.219:9094 10.129.2.16:9094,10.131.0.16:9094 f56f59d7-231a-4974-99b3-792e2741ec8d Service_openshif tcp 172.30.89.212:443 10.128.0.41:8443,10.129.0.68:8443,10.130.0.44:8443 08c2c6d7-d217-4b96-b5d8-c80c4e258116 Service_openshif tcp 172.30.102.137:2379 10.0.0.3:2379,169.254.169.2:2379,10.0.0.5:2379 tcp 172.30.102.137:9979 10.0.0.3:9979,169.254.169.2:9979,10.0.0.5:9979 60a69c56-fc6a-4de6-bd88-3f2af5ba5665 Service_openshif tcp 172.30.10.193:443 10.129.0.25:8443 ab1ef694-0826-4671-a22c-565fc2d282ec Service_openshif tcp 172.30.196.123:443 10.128.0.33:8443,10.129.0.64:8443,10.130.0.37:8443 b1fb34d3-0944-4770-9ee3-2683e7a630e2 Service_openshif tcp 172.30.158.93:8443 10.129.0.13:8443 95811c11-56e2-4877-be1e-c78ccb3a82a9 Service_openshif tcp 172.30.46.85:9001 10.130.0.16:9001 4baba1d1-b873-4535-884c-3f6fc07a50fd Service_openshif tcp 172.30.28.87:443 10.129.0.26:8443 6c2e1c90-f0ca-484e-8a8e-40e71442110a Service_openshif udp 172.30.0.10:53 10.128.0.13:5353,10.128.2.6:5353,10.129.0.39:5353,10.129.2.6:5353,10.130.0.11:5353,10.131.0.9:5353NoteFrom this truncated output you can see there are many OVN-Kubernetes load balancers. Load balancers in OVN-Kubernetes are representations of services.
Run the following command to display the options available with the command
ovn-nbctl:$ oc exec -n openshift-ovn-kubernetes -it ovnkube-node-55xs2 \ -c nbdb ovn-nbctl --help
19.2.4. Command-line arguments for ovn-nbctl to examine northbound database contents
The following table describes the command-line arguments that can be used with ovn-nbctl to examine the contents of the northbound database.
Open a remote shell in the pod you want to view the contents of and then run the ovn-nbctl commands.
| Argument | Description |
|---|---|
|
| An overview of the northbound database contents as seen from a specific node. |
|
| Show the details associated with the specified switch or router. |
|
| Show the logical routers. |
|
|
Using the router information from |
|
| Show network address translation details for the specified router. |
|
| Show the logical switches |
|
|
Using the switch information from |
|
| Get the type for the logical port. |
|
| Show the load balancers. |
19.2.5. Listing the OVN-Kubernetes southbound database contents
Each node is controlled by the ovnkube-controller container running in the ovnkube-node pod on that node. To understand the OVN logical networking entities you need to examine the northbound database that is running as a container inside the ovnkube-node pod on that node to see what objects are in the node you wish to see.
Prerequisites
-
Access to the cluster as a user with the
cluster-adminrole. -
The OpenShift CLI (
oc) installed.
To run ovn nbctl or sbctl commands in a cluster you must open a remote shell into the nbdb or sbdb containers on the relevant node
List the pods by running the following command:
$ oc get po -n openshift-ovn-kubernetesExample output
NAME READY STATUS RESTARTS AGE ovnkube-control-plane-8444dff7f9-4lh9k 2/2 Running 0 27m ovnkube-control-plane-8444dff7f9-5rjh9 2/2 Running 0 27m ovnkube-node-55xs2 8/8 Running 0 26m ovnkube-node-7r84r 8/8 Running 0 16m ovnkube-node-bqq8p 8/8 Running 0 17m ovnkube-node-mkj4f 8/8 Running 0 26m ovnkube-node-mlr8k 8/8 Running 0 26m ovnkube-node-wqn2m 8/8 Running 0 16mOptional: To list the pods with node information, run the following command:
$ oc get pods -n openshift-ovn-kubernetes -owideExample output
NAME READY STATUS RESTARTS AGE IP NODE NOMINATED NODE READINESS GATES ovnkube-control-plane-8444dff7f9-4lh9k 2/2 Running 0 27m 10.0.0.3 ci-ln-t487nnb-72292-mdcnq-master-1 <none> <none> ovnkube-control-plane-8444dff7f9-5rjh9 2/2 Running 0 27m 10.0.0.4 ci-ln-t487nnb-72292-mdcnq-master-2 <none> <none> ovnkube-node-55xs2 8/8 Running 0 26m 10.0.0.4 ci-ln-t487nnb-72292-mdcnq-master-2 <none> <none> ovnkube-node-7r84r 8/8 Running 0 17m 10.0.128.3 ci-ln-t487nnb-72292-mdcnq-worker-b-wbz7z <none> <none> ovnkube-node-bqq8p 8/8 Running 0 17m 10.0.128.2 ci-ln-t487nnb-72292-mdcnq-worker-a-lh7ms <none> <none> ovnkube-node-mkj4f 8/8 Running 0 27m 10.0.0.5 ci-ln-t487nnb-72292-mdcnq-master-0 <none> <none> ovnkube-node-mlr8k 8/8 Running 0 27m 10.0.0.3 ci-ln-t487nnb-72292-mdcnq-master-1 <none> <none> ovnkube-node-wqn2m 8/8 Running 0 17m 10.0.128.4 ci-ln-t487nnb-72292-mdcnq-worker-c-przlm <none> <none>Navigate into a pod to look at the southbound database:
$ oc rsh -c sbdb -n openshift-ovn-kubernetes ovnkube-node-55xs2Run the following command to show all the objects in the southbound database:
$ ovn-sbctl showExample output
Chassis "5db31703-35e9-413b-8cdf-69e7eecb41f7" hostname: ci-ln-9gp362t-72292-v2p94-worker-a-8bmwz Encap geneve ip: "10.0.128.4" options: {csum="true"} Port_Binding tstor-ci-ln-9gp362t-72292-v2p94-worker-a-8bmwz Chassis "070debed-99b7-4bce-b17d-17e720b7f8bc" hostname: ci-ln-9gp362t-72292-v2p94-worker-b-svmp6 Encap geneve ip: "10.0.128.2" options: {csum="true"} Port_Binding k8s-ci-ln-9gp362t-72292-v2p94-worker-b-svmp6 Port_Binding rtoe-GR_ci-ln-9gp362t-72292-v2p94-worker-b-svmp6 Port_Binding openshift-monitoring_alertmanager-main-1 Port_Binding rtoj-GR_ci-ln-9gp362t-72292-v2p94-worker-b-svmp6 Port_Binding etor-GR_ci-ln-9gp362t-72292-v2p94-worker-b-svmp6 Port_Binding cr-rtos-ci-ln-9gp362t-72292-v2p94-worker-b-svmp6 Port_Binding openshift-e2e-loki_loki-promtail-qcrcz Port_Binding jtor-GR_ci-ln-9gp362t-72292-v2p94-worker-b-svmp6 Port_Binding openshift-multus_network-metrics-daemon-mkd4t Port_Binding openshift-ingress-canary_ingress-canary-xtvj4 Port_Binding openshift-ingress_router-default-6c76cbc498-pvlqk Port_Binding openshift-dns_dns-default-zz582 Port_Binding openshift-monitoring_thanos-querier-57585899f5-lbf4f Port_Binding openshift-network-diagnostics_network-check-target-tn228 Port_Binding openshift-monitoring_prometheus-k8s-0 Port_Binding openshift-image-registry_image-registry-68899bd877-xqxjj Chassis "179ba069-0af1-401c-b044-e5ba90f60fea" hostname: ci-ln-9gp362t-72292-v2p94-master-0 Encap geneve ip: "10.0.0.5" options: {csum="true"} Port_Binding tstor-ci-ln-9gp362t-72292-v2p94-master-0 Chassis "68c954f2-5a76-47be-9e84-1cb13bd9dab9" hostname: ci-ln-9gp362t-72292-v2p94-worker-c-mjf9w Encap geneve ip: "10.0.128.3" options: {csum="true"} Port_Binding tstor-ci-ln-9gp362t-72292-v2p94-worker-c-mjf9w Chassis "2de65d9e-9abf-4b6e-a51d-a1e038b4d8af" hostname: ci-ln-9gp362t-72292-v2p94-master-2 Encap geneve ip: "10.0.0.4" options: {csum="true"} Port_Binding tstor-ci-ln-9gp362t-72292-v2p94-master-2 Chassis "1d371cb8-5e21-44fd-9025-c4b162cc4247" hostname: ci-ln-9gp362t-72292-v2p94-master-1 Encap geneve ip: "10.0.0.3" options: {csum="true"} Port_Binding tstor-ci-ln-9gp362t-72292-v2p94-master-1This detailed output shows the chassis and the ports that are attached to the chassis which in this case are all of the router ports and anything that runs like host networking. Any pods communicate out to the wider network using source network address translation (SNAT). Their IP address is translated into the IP address of the node that the pod is running on and then sent out into the network.
In addition to the chassis information the southbound database has all the logic flows and those logic flows are then sent to the
ovn-controllerrunning on each of the nodes. Theovn-controllertranslates the logic flows into open flow rules and ultimately programsOpenvSwitchso that your pods can then follow open flow rules and make it out of the network.Run the following command to display the options available with the command
ovn-sbctl:$ oc exec -n openshift-ovn-kubernetes -it ovnkube-node-55xs2 \ -c sbdb ovn-sbctl --help
19.2.6. Command-line arguments for ovn-sbctl to examine southbound database contents
The following table describes the command-line arguments that can be used with ovn-sbctl to examine the contents of the southbound database.
Open a remote shell in the pod you wish to view the contents of and then run the ovn-sbctl commands.
| Argument | Description |
|---|---|
|
| An overview of the southbound database contents as seen from a specific node. |
|
| List the contents of southbound database for a the specified port . |
|
| List the logical flows. |
19.2.7. OVN-Kubernetes logical architecture
OVN is a network virtualization solution. It creates logical switches and routers. These switches and routers are interconnected to create any network topologies. When you run ovnkube-trace with the log level set to 2 or 5 the OVN-Kubernetes logical components are exposed. The following diagram shows how the routers and switches are connected in OpenShift Container Platform.
Figure 19.2. OVN-Kubernetes router and switch components
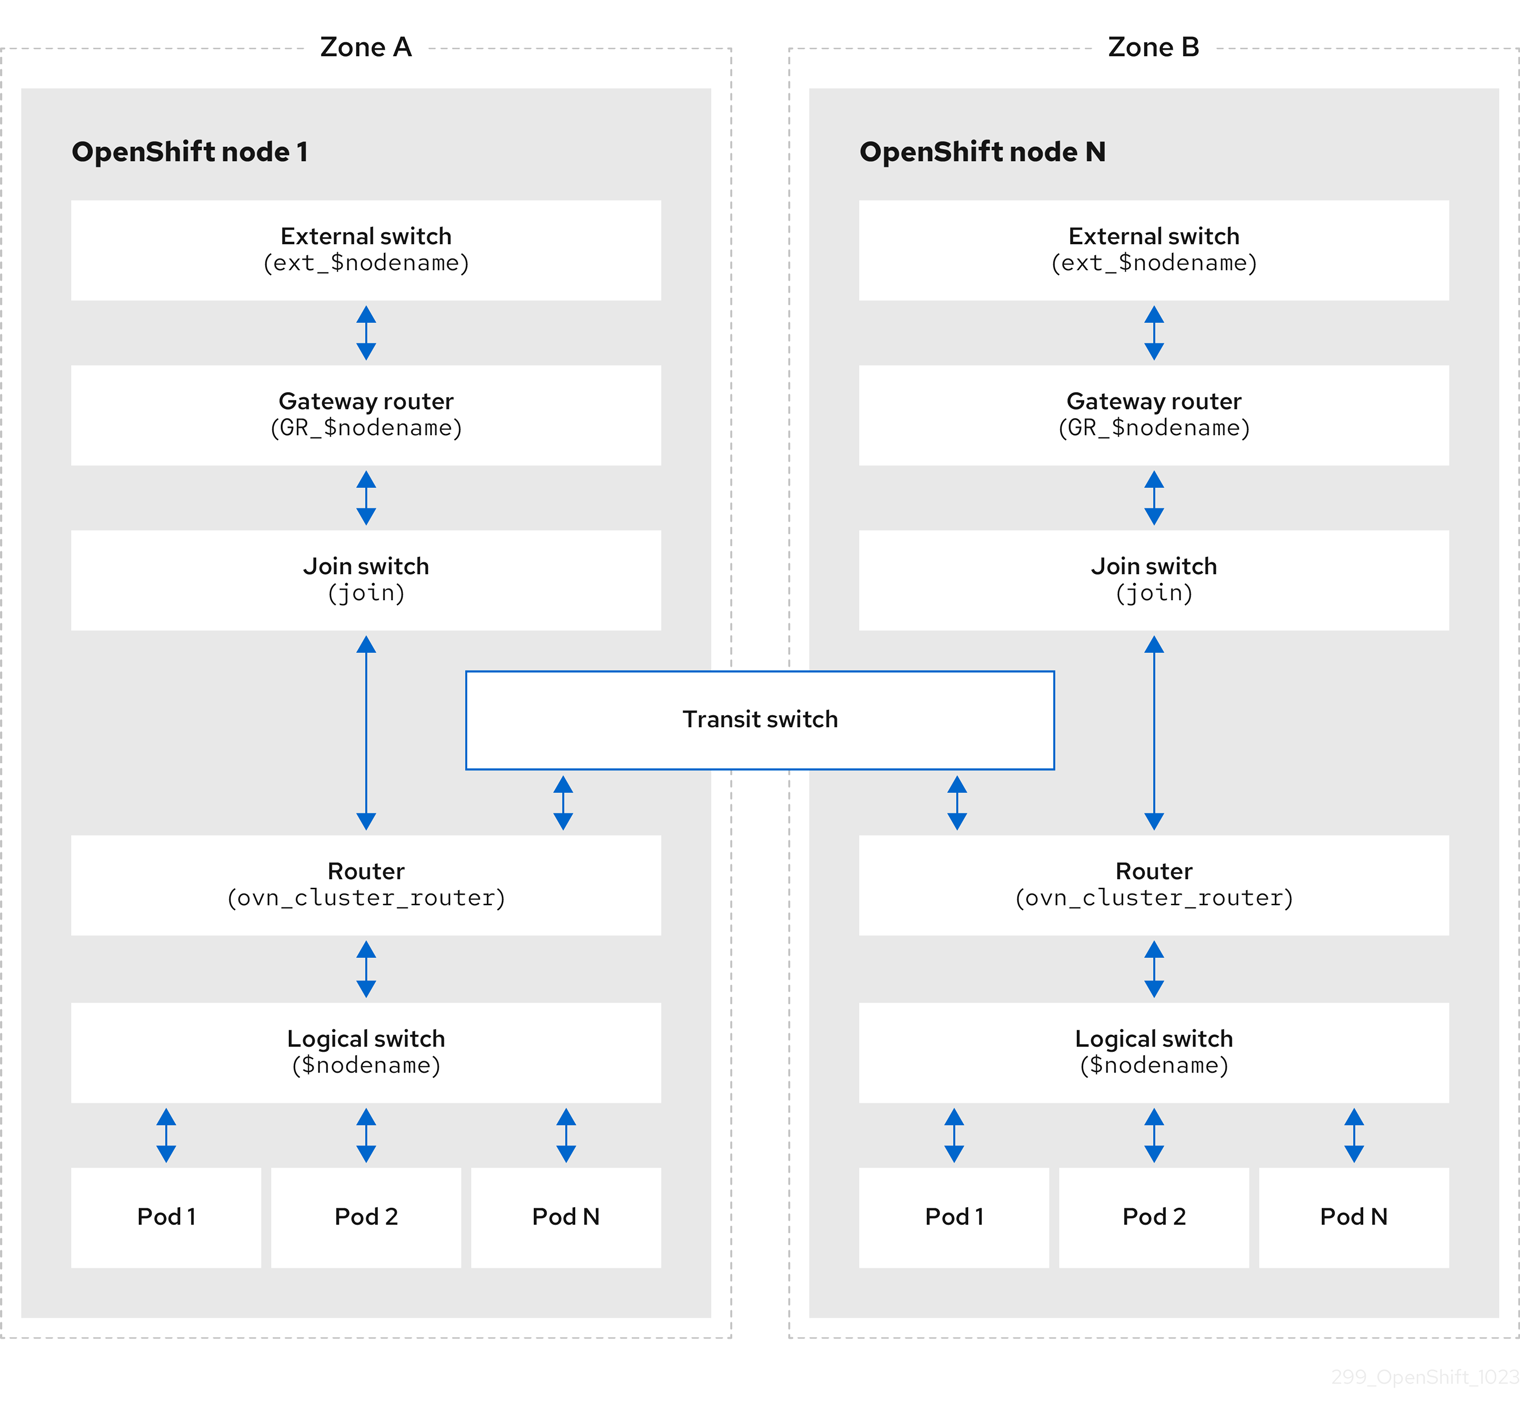
The key components involved in packet processing are:
- Gateway routers
-
Gateway routers sometimes called L3 gateway routers, are typically used between the distributed routers and the physical network. Gateway routers including their logical patch ports are bound to a physical location (not distributed), or chassis. The patch ports on this router are known as l3gateway ports in the ovn-southbound database (
ovn-sbdb). - Distributed logical routers
- Distributed logical routers and the logical switches behind them, to which virtual machines and containers attach, effectively reside on each hypervisor.
- Join local switch
- Join local switches are used to connect the distributed router and gateway routers. It reduces the number of IP addresses needed on the distributed router.
- Logical switches with patch ports
- Logical switches with patch ports are used to virtualize the network stack. They connect remote logical ports through tunnels.
- Logical switches with localnet ports
- Logical switches with localnet ports are used to connect OVN to the physical network. They connect remote logical ports by bridging the packets to directly connected physical L2 segments using localnet ports.
- Patch ports
- Patch ports represent connectivity between logical switches and logical routers and between peer logical routers. A single connection has a pair of patch ports at each such point of connectivity, one on each side.
- l3gateway ports
-
l3gateway ports are the port binding entries in the
ovn-sbdbfor logical patch ports used in the gateway routers. They are called l3gateway ports rather than patch ports just to portray the fact that these ports are bound to a chassis just like the gateway router itself. - localnet ports
-
localnet ports are present on the bridged logical switches that allows a connection to a locally accessible network from each
ovn-controllerinstance. This helps model the direct connectivity to the physical network from the logical switches. A logical switch can only have a single localnet port attached to it.
19.2.7.1. Installing network-tools on local host
Install network-tools on your local host to make a collection of tools available for debugging OpenShift Container Platform cluster network issues.
Procedure
Clone the
network-toolsrepository onto your workstation with the following command:$ git clone git@github.com:openshift/network-tools.gitChange into the directory for the repository you just cloned:
$ cd network-toolsOptional: List all available commands:
$ ./debug-scripts/network-tools -h
19.2.7.2. Running network-tools
Get information about the logical switches and routers by running network-tools.
Prerequisites
-
You installed the OpenShift CLI (
oc). -
You are logged in to the cluster as a user with
cluster-adminprivileges. -
You have installed
network-toolson local host.
Procedure
List the routers by running the following command:
$ ./debug-scripts/network-tools ovn-db-run-command ovn-nbctl lr-listExample output
944a7b53-7948-4ad2-a494-82b55eeccf87 (GR_ci-ln-54932yb-72292-kd676-worker-c-rzj99) 84bd4a4c-4b0b-4a47-b0cf-a2c32709fc53 (ovn_cluster_router)List the localnet ports by running the following command:
$ ./debug-scripts/network-tools ovn-db-run-command \ ovn-sbctl find Port_Binding type=localnetExample output
_uuid : d05298f5-805b-4838-9224-1211afc2f199 additional_chassis : [] additional_encap : [] chassis : [] datapath : f3c2c959-743b-4037-854d-26627902597c encap : [] external_ids : {} gateway_chassis : [] ha_chassis_group : [] logical_port : br-ex_ci-ln-54932yb-72292-kd676-worker-c-rzj99 mac : [unknown] mirror_rules : [] nat_addresses : [] options : {network_name=physnet} parent_port : [] port_security : [] requested_additional_chassis: [] requested_chassis : [] tag : [] tunnel_key : 2 type : localnet up : false virtual_parent : [] [...]List the
l3gatewayports by running the following command:$ ./debug-scripts/network-tools ovn-db-run-command \ ovn-sbctl find Port_Binding type=l3gatewayExample output
_uuid : 5207a1f3-1cf3-42f1-83e9-387bbb06b03c additional_chassis : [] additional_encap : [] chassis : ca6eb600-3a10-4372-a83e-e0d957c4cd92 datapath : f3c2c959-743b-4037-854d-26627902597c encap : [] external_ids : {} gateway_chassis : [] ha_chassis_group : [] logical_port : etor-GR_ci-ln-54932yb-72292-kd676-worker-c-rzj99 mac : ["42:01:0a:00:80:04"] mirror_rules : [] nat_addresses : ["42:01:0a:00:80:04 10.0.128.4"] options : {l3gateway-chassis="84737c36-b383-4c83-92c5-2bd5b3c7e772", peer=rtoe-GR_ci-ln-54932yb-72292-kd676-worker-c-rzj99} parent_port : [] port_security : [] requested_additional_chassis: [] requested_chassis : [] tag : [] tunnel_key : 1 type : l3gateway up : true virtual_parent : [] _uuid : 6088d647-84f2-43f2-b53f-c9d379042679 additional_chassis : [] additional_encap : [] chassis : ca6eb600-3a10-4372-a83e-e0d957c4cd92 datapath : dc9cea00-d94a-41b8-bdb0-89d42d13aa2e encap : [] external_ids : {} gateway_chassis : [] ha_chassis_group : [] logical_port : jtor-GR_ci-ln-54932yb-72292-kd676-worker-c-rzj99 mac : [router] mirror_rules : [] nat_addresses : [] options : {l3gateway-chassis="84737c36-b383-4c83-92c5-2bd5b3c7e772", peer=rtoj-GR_ci-ln-54932yb-72292-kd676-worker-c-rzj99} parent_port : [] port_security : [] requested_additional_chassis: [] requested_chassis : [] tag : [] tunnel_key : 2 type : l3gateway up : true virtual_parent : [] [...]List the patch ports by running the following command:
$ ./debug-scripts/network-tools ovn-db-run-command \ ovn-sbctl find Port_Binding type=patchExample output
_uuid : 785fb8b6-ee5a-4792-a415-5b1cb855dac2 additional_chassis : [] additional_encap : [] chassis : [] datapath : f1ddd1cc-dc0d-43b4-90ca-12651305acec encap : [] external_ids : {} gateway_chassis : [] ha_chassis_group : [] logical_port : stor-ci-ln-54932yb-72292-kd676-worker-c-rzj99 mac : [router] mirror_rules : [] nat_addresses : ["0a:58:0a:80:02:01 10.128.2.1 is_chassis_resident(\"cr-rtos-ci-ln-54932yb-72292-kd676-worker-c-rzj99\")"] options : {peer=rtos-ci-ln-54932yb-72292-kd676-worker-c-rzj99} parent_port : [] port_security : [] requested_additional_chassis: [] requested_chassis : [] tag : [] tunnel_key : 1 type : patch up : false virtual_parent : [] _uuid : c01ff587-21a5-40b4-8244-4cd0425e5d9a additional_chassis : [] additional_encap : [] chassis : [] datapath : f6795586-bf92-4f84-9222-efe4ac6a7734 encap : [] external_ids : {} gateway_chassis : [] ha_chassis_group : [] logical_port : rtoj-ovn_cluster_router mac : ["0a:58:64:40:00:01 100.64.0.1/16"] mirror_rules : [] nat_addresses : [] options : {peer=jtor-ovn_cluster_router} parent_port : [] port_security : [] requested_additional_chassis: [] requested_chassis : [] tag : [] tunnel_key : 1 type : patch up : false virtual_parent : [] [...]
19.3. Troubleshooting OVN-Kubernetes
OVN-Kubernetes has many sources of built-in health checks and logs. Follow the instructions in these sections to examine your cluster. If a support case is necessary, follow the support guide to collect additional information through a must-gather. Only use the -- gather_network_logs when instructed by support.
19.3.1. Monitoring OVN-Kubernetes health by using readiness probes
The ovnkube-control-plane and ovnkube-node pods have containers configured with readiness probes.
Prerequisites
-
Access to the OpenShift CLI (
oc). -
You have access to the cluster with
cluster-adminprivileges. -
You have installed
jq.
Procedure
Review the details of the
ovnkube-nodereadiness probe by running the following command:$ oc get pods -n openshift-ovn-kubernetes -l app=ovnkube-node \ -o json | jq '.items[0].spec.containers[] | .name,.readinessProbe'The readiness probe for the northbound and southbound database containers in the
ovnkube-nodepod checks for the health of the databases and theovnkube-controllercontainer.The
ovnkube-controllercontainer in theovnkube-nodepod has a readiness probe to verify the presence of the OVN-Kubernetes CNI configuration file, the absence of which would indicate that the pod is not running or is not ready to accept requests to configure pods.Show all events including the probe failures, for the namespace by using the following command:
$ oc get events -n openshift-ovn-kubernetesShow the events for just a specific pod:
$ oc describe pod ovnkube-node-9lqfk -n openshift-ovn-kubernetesShow the messages and statuses from the cluster network operator:
$ oc get co/network -o json | jq '.status.conditions[]'Show the
readystatus of each container inovnkube-nodepods by running the following script:$ for p in $(oc get pods --selector app=ovnkube-node -n openshift-ovn-kubernetes \ -o jsonpath='{range.items[*]}{" "}{.metadata.name}'); do echo === $p ===; \ oc get pods -n openshift-ovn-kubernetes $p -o json | jq '.status.containerStatuses[] | .name, .ready'; \ doneNoteThe expectation is all container statuses are reporting as
true. Failure of a readiness probe sets the status tofalse.
19.3.2. Viewing OVN-Kubernetes alerts in the console
The Alerting UI provides detailed information about alerts and their governing alerting rules and silences.
Prerequisites
- You have access to the cluster as a developer or as a user with view permissions for the project that you are viewing metrics for.
Procedure (UI)
- In the Administrator perspective, select Observe → Alerting. The three main pages in the Alerting UI in this perspective are the Alerts, Silences, and Alerting Rules pages.
- View the rules for OVN-Kubernetes alerts by selecting Observe → Alerting → Alerting Rules.
19.3.3. Viewing OVN-Kubernetes alerts in the CLI
You can get information about alerts and their governing alerting rules and silences from the command line.
Prerequisites
-
Access to the cluster as a user with the
cluster-adminrole. -
The OpenShift CLI (
oc) installed. -
You have installed
jq.
Procedure
View active or firing alerts by running the following commands.
Set the alert manager route environment variable by running the following command:
$ ALERT_MANAGER=$(oc get route alertmanager-main -n openshift-monitoring \ -o jsonpath='{@.spec.host}')Issue a
curlrequest to the alert manager route API by running the following command, replacing$ALERT_MANAGERwith the URL of yourAlertmanagerinstance:$ curl -s -k -H "Authorization: Bearer $(oc create token prometheus-k8s -n openshift-monitoring)" https://$ALERT_MANAGER/api/v1/alerts | jq '.data[] | "\(.labels.severity) \(.labels.alertname) \(.labels.pod) \(.labels.container) \(.labels.endpoint) \(.labels.instance)"'
View alerting rules by running the following command:
$ oc -n openshift-monitoring exec -c prometheus prometheus-k8s-0 -- curl -s 'http://localhost:9090/api/v1/rules' | jq '.data.groups[].rules[] | select(((.name|contains("ovn")) or (.name|contains("OVN")) or (.name|contains("Ovn")) or (.name|contains("North")) or (.name|contains("South"))) and .type=="alerting")'
19.3.4. Viewing the OVN-Kubernetes logs using the CLI
You can view the logs for each of the pods in the ovnkube-master and ovnkube-node pods using the OpenShift CLI (oc).
Prerequisites
-
Access to the cluster as a user with the
cluster-adminrole. -
Access to the OpenShift CLI (
oc). -
You have installed
jq.
Procedure
View the log for a specific pod:
$ oc logs -f <pod_name> -c <container_name> -n <namespace>where:
-f- Optional: Specifies that the output follows what is being written into the logs.
<pod_name>- Specifies the name of the pod.
<container_name>- Optional: Specifies the name of a container. When a pod has more than one container, you must specify the container name.
<namespace>- Specify the namespace the pod is running in.
For example:
$ oc logs ovnkube-node-5dx44 -n openshift-ovn-kubernetes$ oc logs -f ovnkube-node-5dx44 -c ovnkube-controller -n openshift-ovn-kubernetesThe contents of log files are printed out.
Examine the most recent entries in all the containers in the
ovnkube-nodepods:$ for p in $(oc get pods --selector app=ovnkube-node -n openshift-ovn-kubernetes \ -o jsonpath='{range.items[*]}{" "}{.metadata.name}'); \ do echo === $p ===; for container in $(oc get pods -n openshift-ovn-kubernetes $p \ -o json | jq -r '.status.containerStatuses[] | .name');do echo ---$container---; \ oc logs -c $container $p -n openshift-ovn-kubernetes --tail=5; done; doneView the last 5 lines of every log in every container in an
ovnkube-nodepod using the following command:$ oc logs -l app=ovnkube-node -n openshift-ovn-kubernetes --all-containers --tail 5
19.3.5. Viewing the OVN-Kubernetes logs using the web console
You can view the logs for each of the pods in the ovnkube-master and ovnkube-node pods in the web console.
Prerequisites
-
Access to the OpenShift CLI (
oc).
Procedure
- In the OpenShift Container Platform console, navigate to Workloads → Pods or navigate to the pod through the resource you want to investigate.
-
Select the
openshift-ovn-kubernetesproject from the drop-down menu. - Click the name of the pod you want to investigate.
-
Click Logs. By default for the
ovnkube-masterthe logs associated with thenorthdcontainer are displayed. - Use the down-down menu to select logs for each container in turn.
19.3.5.1. Changing the OVN-Kubernetes log levels
The default log level for OVN-Kubernetes is 4. To debug OVN-Kubernetes, set the log level to 5. Follow this procedure to increase the log level of the OVN-Kubernetes to help you debug an issue.
Prerequisites
-
You have access to the cluster with
cluster-adminprivileges. - You have access to the OpenShift Container Platform web console.
Procedure
Run the following command to get detailed information for all pods in the OVN-Kubernetes project:
$ oc get po -o wide -n openshift-ovn-kubernetesExample output
NAME READY STATUS RESTARTS AGE IP NODE NOMINATED NODE READINESS GATES ovnkube-control-plane-65497d4548-9ptdr 2/2 Running 2 (128m ago) 147m 10.0.0.3 ci-ln-3njdr9b-72292-5nwkp-master-0 <none> <none> ovnkube-control-plane-65497d4548-j6zfk 2/2 Running 0 147m 10.0.0.5 ci-ln-3njdr9b-72292-5nwkp-master-2 <none> <none> ovnkube-node-5dx44 8/8 Running 0 146m 10.0.0.3 ci-ln-3njdr9b-72292-5nwkp-master-0 <none> <none> ovnkube-node-dpfn4 8/8 Running 0 146m 10.0.0.4 ci-ln-3njdr9b-72292-5nwkp-master-1 <none> <none> ovnkube-node-kwc9l 8/8 Running 0 134m 10.0.128.2 ci-ln-3njdr9b-72292-5nwkp-worker-a-2fjcj <none> <none> ovnkube-node-mcrhl 8/8 Running 0 134m 10.0.128.4 ci-ln-3njdr9b-72292-5nwkp-worker-c-v9x5v <none> <none> ovnkube-node-nsct4 8/8 Running 0 146m 10.0.0.5 ci-ln-3njdr9b-72292-5nwkp-master-2 <none> <none> ovnkube-node-zrj9f 8/8 Running 0 134m 10.0.128.3 ci-ln-3njdr9b-72292-5nwkp-worker-b-v78h7 <none> <none>Create a
ConfigMapfile similar to the following example and use a filename such asenv-overrides.yaml:Example
ConfigMapfilekind: ConfigMap apiVersion: v1 metadata: name: env-overrides namespace: openshift-ovn-kubernetes data: ci-ln-3njdr9b-72292-5nwkp-master-0: |1 # This sets the log level for the ovn-kubernetes node process: OVN_KUBE_LOG_LEVEL=5 # You might also/instead want to enable debug logging for ovn-controller: OVN_LOG_LEVEL=dbg ci-ln-3njdr9b-72292-5nwkp-master-2: | # This sets the log level for the ovn-kubernetes node process: OVN_KUBE_LOG_LEVEL=5 # You might also/instead want to enable debug logging for ovn-controller: OVN_LOG_LEVEL=dbg _master: |2 # This sets the log level for the ovn-kubernetes master process as well as the ovn-dbchecker: OVN_KUBE_LOG_LEVEL=5 # You might also/instead want to enable debug logging for northd, nbdb and sbdb on all masters: OVN_LOG_LEVEL=dbgApply the
ConfigMapfile by using the following command:$ oc apply -n openshift-ovn-kubernetes -f env-overrides.yamlExample output
configmap/env-overrides.yaml createdRestart the
ovnkubepods to apply the new log level by using the following commands:$ oc delete pod -n openshift-ovn-kubernetes \ --field-selector spec.nodeName=ci-ln-3njdr9b-72292-5nwkp-master-0 -l app=ovnkube-node$ oc delete pod -n openshift-ovn-kubernetes \ --field-selector spec.nodeName=ci-ln-3njdr9b-72292-5nwkp-master-2 -l app=ovnkube-node$ oc delete pod -n openshift-ovn-kubernetes -l app=ovnkube-nodeTo verify that the `ConfigMap`file has been applied to all nodes for a specific pod, run the following command:
$ oc logs -n openshift-ovn-kubernetes --all-containers --prefix ovnkube-node-<xxxx> | grep -E -m 10 '(Logging config:|vconsole|DBG)'where:
<XXXX>Specifies the random sequence of letters for a pod from the previous step.
Example output
[pod/ovnkube-node-2cpjc/sbdb] + exec /usr/share/ovn/scripts/ovn-ctl --no-monitor '--ovn-sb-log=-vconsole:info -vfile:off -vPATTERN:console:%D{%Y-%m-%dT%H:%M:%S.###Z}|%05N|%c%T|%p|%m' run_sb_ovsdb [pod/ovnkube-node-2cpjc/ovnkube-controller] I1012 14:39:59.984506 35767 config.go:2247] Logging config: {File: CNIFile:/var/log/ovn-kubernetes/ovn-k8s-cni-overlay.log LibovsdbFile:/var/log/ovnkube/libovsdb.log Level:5 LogFileMaxSize:100 LogFileMaxBackups:5 LogFileMaxAge:0 ACLLoggingRateLimit:20} [pod/ovnkube-node-2cpjc/northd] + exec ovn-northd --no-chdir -vconsole:info -vfile:off '-vPATTERN:console:%D{%Y-%m-%dT%H:%M:%S.###Z}|%05N|%c%T|%p|%m' --pidfile /var/run/ovn/ovn-northd.pid --n-threads=1 [pod/ovnkube-node-2cpjc/nbdb] + exec /usr/share/ovn/scripts/ovn-ctl --no-monitor '--ovn-nb-log=-vconsole:info -vfile:off -vPATTERN:console:%D{%Y-%m-%dT%H:%M:%S.###Z}|%05N|%c%T|%p|%m' run_nb_ovsdb [pod/ovnkube-node-2cpjc/ovn-controller] 2023-10-12T14:39:54.552Z|00002|hmap|DBG|lib/shash.c:114: 1 bucket with 6+ nodes, including 1 bucket with 6 nodes (32 nodes total across 32 buckets) [pod/ovnkube-node-2cpjc/ovn-controller] 2023-10-12T14:39:54.553Z|00003|hmap|DBG|lib/shash.c:114: 1 bucket with 6+ nodes, including 1 bucket with 6 nodes (64 nodes total across 64 buckets) [pod/ovnkube-node-2cpjc/ovn-controller] 2023-10-12T14:39:54.553Z|00004|hmap|DBG|lib/shash.c:114: 1 bucket with 6+ nodes, including 1 bucket with 7 nodes (32 nodes total across 32 buckets) [pod/ovnkube-node-2cpjc/ovn-controller] 2023-10-12T14:39:54.553Z|00005|reconnect|DBG|unix:/var/run/openvswitch/db.sock: entering BACKOFF [pod/ovnkube-node-2cpjc/ovn-controller] 2023-10-12T14:39:54.553Z|00007|reconnect|DBG|unix:/var/run/openvswitch/db.sock: entering CONNECTING [pod/ovnkube-node-2cpjc/ovn-controller] 2023-10-12T14:39:54.553Z|00008|ovsdb_cs|DBG|unix:/var/run/openvswitch/db.sock: SERVER_SCHEMA_REQUESTED -> SERVER_SCHEMA_REQUESTED at lib/ovsdb-cs.c:423
Optional: Check the
ConfigMapfile has been applied by running the following command:for f in $(oc -n openshift-ovn-kubernetes get po -l 'app=ovnkube-node' --no-headers -o custom-columns=N:.metadata.name) ; do echo "---- $f ----" ; oc -n openshift-ovn-kubernetes exec -c ovnkube-controller $f -- pgrep -a -f init-ovnkube-controller | grep -P -o '^.*loglevel\s+\d' ; doneExample output
---- ovnkube-node-2dt57 ---- 60981 /usr/bin/ovnkube --init-ovnkube-controller xpst8-worker-c-vmh5n.c.openshift-qe.internal --init-node xpst8-worker-c-vmh5n.c.openshift-qe.internal --config-file=/run/ovnkube-config/ovnkube.conf --ovn-empty-lb-events --loglevel 4 ---- ovnkube-node-4zznh ---- 178034 /usr/bin/ovnkube --init-ovnkube-controller xpst8-master-2.c.openshift-qe.internal --init-node xpst8-master-2.c.openshift-qe.internal --config-file=/run/ovnkube-config/ovnkube.conf --ovn-empty-lb-events --loglevel 4 ---- ovnkube-node-548sx ---- 77499 /usr/bin/ovnkube --init-ovnkube-controller xpst8-worker-a-fjtnb.c.openshift-qe.internal --init-node xpst8-worker-a-fjtnb.c.openshift-qe.internal --config-file=/run/ovnkube-config/ovnkube.conf --ovn-empty-lb-events --loglevel 4 ---- ovnkube-node-6btrf ---- 73781 /usr/bin/ovnkube --init-ovnkube-controller xpst8-worker-b-p8rww.c.openshift-qe.internal --init-node xpst8-worker-b-p8rww.c.openshift-qe.internal --config-file=/run/ovnkube-config/ovnkube.conf --ovn-empty-lb-events --loglevel 4 ---- ovnkube-node-fkc9r ---- 130707 /usr/bin/ovnkube --init-ovnkube-controller xpst8-master-0.c.openshift-qe.internal --init-node xpst8-master-0.c.openshift-qe.internal --config-file=/run/ovnkube-config/ovnkube.conf --ovn-empty-lb-events --loglevel 5 ---- ovnkube-node-tk9l4 ---- 181328 /usr/bin/ovnkube --init-ovnkube-controller xpst8-master-1.c.openshift-qe.internal --init-node xpst8-master-1.c.openshift-qe.internal --config-file=/run/ovnkube-config/ovnkube.conf --ovn-empty-lb-events --loglevel 4
19.3.6. Checking the OVN-Kubernetes pod network connectivity
The connectivity check controller, in OpenShift Container Platform 4.10 and later, orchestrates connection verification checks in your cluster. These include Kubernetes API, OpenShift API and individual nodes. The results for the connection tests are stored in PodNetworkConnectivity objects in the openshift-network-diagnostics namespace. Connection tests are performed every minute in parallel.
Prerequisites
-
Access to the OpenShift CLI (
oc). -
Access to the cluster as a user with the
cluster-adminrole. -
You have installed
jq.
Procedure
To list the current
PodNetworkConnectivityCheckobjects, enter the following command:$ oc get podnetworkconnectivitychecks -n openshift-network-diagnosticsView the most recent success for each connection object by using the following command:
$ oc get podnetworkconnectivitychecks -n openshift-network-diagnostics \ -o json | jq '.items[]| .spec.targetEndpoint,.status.successes[0]'View the most recent failures for each connection object by using the following command:
$ oc get podnetworkconnectivitychecks -n openshift-network-diagnostics \ -o json | jq '.items[]| .spec.targetEndpoint,.status.failures[0]'View the most recent outages for each connection object by using the following command:
$ oc get podnetworkconnectivitychecks -n openshift-network-diagnostics \ -o json | jq '.items[]| .spec.targetEndpoint,.status.outages[0]'The connectivity check controller also logs metrics from these checks into Prometheus.
View all the metrics by running the following command:
$ oc exec prometheus-k8s-0 -n openshift-monitoring -- \ promtool query instant http://localhost:9090 \ '{component="openshift-network-diagnostics"}'View the latency between the source pod and the openshift api service for the last 5 minutes:
$ oc exec prometheus-k8s-0 -n openshift-monitoring -- \ promtool query instant http://localhost:9090 \ '{component="openshift-network-diagnostics"}'
19.4. Tracing Openflow with ovnkube-trace
OVN and OVS traffic flows can be simulated in a single utility called ovnkube-trace. The ovnkube-trace utility runs ovn-trace, ovs-appctl ofproto/trace and ovn-detrace and correlates that information in a single output.
You can execute the ovnkube-trace binary from a dedicated container. For releases after OpenShift Container Platform 4.7, you can also copy the binary to a local host and execute it from that host.
19.4.1. Installing the ovnkube-trace on local host
The ovnkube-trace tool traces packet simulations for arbitrary UDP or TCP traffic between points in an OVN-Kubernetes driven OpenShift Container Platform cluster. Copy the ovnkube-trace binary to your local host making it available to run against the cluster.
Prerequisites
-
You installed the OpenShift CLI (
oc). -
You are logged in to the cluster with a user with
cluster-adminprivileges.
Procedure
Create a pod variable by using the following command:
$ POD=$(oc get pods -n openshift-ovn-kubernetes -l app=ovnkube-control-plane -o name | head -1 | awk -F '/' '{print $NF}')Run the following command on your local host to copy the binary from the
ovnkube-control-planepods:$ oc cp -n openshift-ovn-kubernetes $POD:/usr/bin/ovnkube-trace -c ovnkube-cluster-manager ovnkube-traceNoteIf you are using Red Hat Enterprise Linux (RHEL) 8 to run the
ovnkube-tracetool, you must copy the file/usr/lib/rhel8/ovnkube-traceto your local host.Make
ovnkube-traceexecutable by running the following command:$ chmod +x ovnkube-traceDisplay the options available with
ovnkube-traceby running the following command:$ ./ovnkube-trace -helpExpected output
Usage of ./ovnkube-trace: -addr-family string Address family (ip4 or ip6) to be used for tracing (default "ip4") -dst string dest: destination pod name -dst-ip string destination IP address (meant for tests to external targets) -dst-namespace string k8s namespace of dest pod (default "default") -dst-port string dst-port: destination port (default "80") -kubeconfig string absolute path to the kubeconfig file -loglevel string loglevel: klog level (default "0") -ovn-config-namespace string namespace used by ovn-config itself -service string service: destination service name -skip-detrace skip ovn-detrace command -src string src: source pod name -src-namespace string k8s namespace of source pod (default "default") -tcp use tcp transport protocol -udp use udp transport protocolThe command-line arguments supported are familiar Kubernetes constructs, such as namespaces, pods, services so you do not need to find the MAC address, the IP address of the destination nodes, or the ICMP type.
The log levels are:
- 0 (minimal output)
- 2 (more verbose output showing results of trace commands)
- 5 (debug output)
19.4.2. Running ovnkube-trace
Run ovn-trace to simulate packet forwarding within an OVN logical network.
Prerequisites
-
You installed the OpenShift CLI (
oc). -
You are logged in to the cluster with a user with
cluster-adminprivileges. -
You have installed
ovnkube-traceon local host
Example: Testing that DNS resolution works from a deployed pod
This example illustrates how to test the DNS resolution from a deployed pod to the core DNS pod that runs in the cluster.
Procedure
Start a web service in the default namespace by entering the following command:
$ oc run web --namespace=default --image=quay.io/openshifttest/nginx --labels="app=web" --expose --port=80List the pods running in the
openshift-dnsnamespace:oc get pods -n openshift-dnsExample output
NAME READY STATUS RESTARTS AGE dns-default-8s42x 2/2 Running 0 5h8m dns-default-mdw6r 2/2 Running 0 4h58m dns-default-p8t5h 2/2 Running 0 4h58m dns-default-rl6nk 2/2 Running 0 5h8m dns-default-xbgqx 2/2 Running 0 5h8m dns-default-zv8f6 2/2 Running 0 4h58m node-resolver-62jjb 1/1 Running 0 5h8m node-resolver-8z4cj 1/1 Running 0 4h59m node-resolver-bq244 1/1 Running 0 5h8m node-resolver-hc58n 1/1 Running 0 4h59m node-resolver-lm6z4 1/1 Running 0 5h8m node-resolver-zfx5k 1/1 Running 0 5hRun the following
ovnkube-tracecommand to verify DNS resolution is working:$ ./ovnkube-trace \ -src-namespace default \1 -src web \2 -dst-namespace openshift-dns \3 -dst dns-default-p8t5h \4 -udp -dst-port 53 \5 -loglevel 06 Example output if the
src&dstpod lands on the same nodeovn-trace source pod to destination pod indicates success from web to dns-default-p8t5h ovn-trace destination pod to source pod indicates success from dns-default-p8t5h to web ovs-appctl ofproto/trace source pod to destination pod indicates success from web to dns-default-p8t5h ovs-appctl ofproto/trace destination pod to source pod indicates success from dns-default-p8t5h to web ovn-detrace source pod to destination pod indicates success from web to dns-default-p8t5h ovn-detrace destination pod to source pod indicates success from dns-default-p8t5h to webExample output if the
src&dstpod lands on a different nodeovn-trace source pod to destination pod indicates success from web to dns-default-8s42x ovn-trace (remote) source pod to destination pod indicates success from web to dns-default-8s42x ovn-trace destination pod to source pod indicates success from dns-default-8s42x to web ovn-trace (remote) destination pod to source pod indicates success from dns-default-8s42x to web ovs-appctl ofproto/trace source pod to destination pod indicates success from web to dns-default-8s42x ovs-appctl ofproto/trace destination pod to source pod indicates success from dns-default-8s42x to web ovn-detrace source pod to destination pod indicates success from web to dns-default-8s42x ovn-detrace destination pod to source pod indicates success from dns-default-8s42x to webThe ouput indicates success from the deployed pod to the DNS port and also indicates that it is successful going back in the other direction. So you know bi-directional traffic is supported on UDP port 53 if my web pod wants to do dns resolution from core DNS.
If for example that did not work and you wanted to get the ovn-trace, the ovs-appctl of proto/trace and ovn-detrace, and more debug type information increase the log level to 2 and run the command again as follows:
$ ./ovnkube-trace \
-src-namespace default \
-src web \
-dst-namespace openshift-dns \
-dst dns-default-467qw \
-udp -dst-port 53 \
-loglevel 2The output from this increased log level is too much to list here. In a failure situation the output of this command shows which flow is dropping that traffic. For example an egress or ingress network policy may be configured on the cluster that does not allow that traffic.
Example: Verifying by using debug output a configured default deny
This example illustrates how to identify by using the debug output that an ingress default deny policy blocks traffic.
Procedure
Create the following YAML that defines a
deny-by-defaultpolicy to deny ingress from all pods in all namespaces. Save the YAML in thedeny-by-default.yamlfile:kind: NetworkPolicy apiVersion: networking.k8s.io/v1 metadata: name: deny-by-default namespace: default spec: podSelector: {} ingress: []Apply the policy by entering the following command:
$ oc apply -f deny-by-default.yamlExample output
networkpolicy.networking.k8s.io/deny-by-default createdStart a web service in the
defaultnamespace by entering the following command:$ oc run web --namespace=default --image=quay.io/openshifttest/nginx --labels="app=web" --expose --port=80Run the following command to create the
prodnamespace:$ oc create namespace prodRun the following command to label the
prodnamespace:$ oc label namespace/prod purpose=productionRun the following command to deploy an
alpineimage in theprodnamespace and start a shell:$ oc run test-6459 --namespace=prod --rm -i -t --image=alpine -- sh- Open another terminal session.
In this new terminal session run
ovn-traceto verify the failure in communication between the source podtest-6459running in namespaceprodand destination pod running in thedefaultnamespace:$ ./ovnkube-trace \ -src-namespace prod \ -src test-6459 \ -dst-namespace default \ -dst web \ -tcp -dst-port 80 \ -loglevel 0Example output
ovn-trace source pod to destination pod indicates failure from test-6459 to webIncrease the log level to 2 to expose the reason for the failure by running the following command:
$ ./ovnkube-trace \ -src-namespace prod \ -src test-6459 \ -dst-namespace default \ -dst web \ -tcp -dst-port 80 \ -loglevel 2Example output
... ------------------------------------------------ 3. ls_out_acl_hint (northd.c:7454): !ct.new && ct.est && !ct.rpl && ct_mark.blocked == 0, priority 4, uuid 12efc456 reg0[8] = 1; reg0[10] = 1; next; 5. ls_out_acl_action (northd.c:7835): reg8[30..31] == 0, priority 500, uuid 69372c5d reg8[30..31] = 1; next(4); 5. ls_out_acl_action (northd.c:7835): reg8[30..31] == 1, priority 500, uuid 2fa0af89 reg8[30..31] = 2; next(4); 4. ls_out_acl_eval (northd.c:7691): reg8[30..31] == 2 && reg0[10] == 1 && (outport == @a16982411286042166782_ingressDefaultDeny), priority 2000, uuid 447d0dab reg8[17] = 1; ct_commit { ct_mark.blocked = 1; };1 next; ...- 1
- Ingress traffic is blocked due to the default deny policy being in place.
Create a policy that allows traffic from all pods in a particular namespaces with a label
purpose=production. Save the YAML in theweb-allow-prod.yamlfile:kind: NetworkPolicy apiVersion: networking.k8s.io/v1 metadata: name: web-allow-prod namespace: default spec: podSelector: matchLabels: app: web policyTypes: - Ingress ingress: - from: - namespaceSelector: matchLabels: purpose: productionApply the policy by entering the following command:
$ oc apply -f web-allow-prod.yamlRun
ovnkube-traceto verify that traffic is now allowed by entering the following command:$ ./ovnkube-trace \ -src-namespace prod \ -src test-6459 \ -dst-namespace default \ -dst web \ -tcp -dst-port 80 \ -loglevel 0Expected output
ovn-trace source pod to destination pod indicates success from test-6459 to web ovn-trace destination pod to source pod indicates success from web to test-6459 ovs-appctl ofproto/trace source pod to destination pod indicates success from test-6459 to web ovs-appctl ofproto/trace destination pod to source pod indicates success from web to test-6459 ovn-detrace source pod to destination pod indicates success from test-6459 to web ovn-detrace destination pod to source pod indicates success from web to test-6459Run the following command in the shell that was opened in step six to connect nginx to the web-server:
wget -qO- --timeout=2 http://web.defaultExpected output
<!DOCTYPE html> <html> <head> <title>Welcome to nginx!</title> <style> body { width: 35em; margin: 0 auto; font-family: Tahoma, Verdana, Arial, sans-serif; } </style> </head> <body> <h1>Welcome to nginx!</h1> <p>If you see this page, the nginx web server is successfully installed and working. Further configuration is required.</p> <p>For online documentation and support please refer to <a href="http://nginx.org/">nginx.org</a>.<br/> Commercial support is available at <a href="http://nginx.com/">nginx.com</a>.</p> <p><em>Thank you for using nginx.</em></p> </body> </html>
19.5. Migrating from the OpenShift SDN network plugin
As a cluster administrator, you can migrate to the OVN-Kubernetes network plugin from the OpenShift software-defined networking (SDN) plugin.
If your cluster uses the OpenShift SDN network plugin, you cannot upgrade your cluster to OpenShift Container Platform 4.17. You must initially migrate your cluster to the OVN-Kubernetes plugin and then upgrade your cluster to OpenShift Container Platform 4.17.
Additionally, if your cluster uses a third-party container network interface (CNI) plugin, you cannot migrate your cluster to the OVN-Kubernetes network plugin. For a complete list of these CNI plugins, see Certified OpenShift CNI Plug-ins (Red Hat Knowledgebase).
The following methods exist for migrating from the OpenShift SDN network plugin to the OVN-Kubernetes plugin:
- Ansible playbook
- The Ansible playbook method automates the offline migration method steps. This method has the same usage scenarios as the manual offline migration method.
- Offline migration
- This is a manual process that includes some downtime. This method is primarily used for self-managed OpenShift Container Platform deployments, and consider using this method when you cannot perform a limited live migration to the OVN-Kubernetes network plugin.
- Limited live migration (Preferred method)
- This is an automated process that migrates your cluster from OpenShift SDN to OVN-Kubernetes.
For the limited live migration method only, do not automate the migration from OpenShift SDN to OVN-Kubernetes with a script or another tool such as Red Hat Ansible Automation Platform. This might cause outages or crash your OpenShift Container Platform cluster.
19.5.1. Limited live migration to the OVN-Kubernetes network plugin overview
The limited live migration method is the process in which the OpenShift SDN network plugin and its network configurations, connections, and associated resources, are migrated to the OVN-Kubernetes network plugin without service interruption. It is available for OpenShift Container Platform, and is the preferred method for migrating from OpenShift SDN to OVN-Kubernetes. If you cannot perform a limited live migration, you can use the offline migration method.
Before you migrate your OpenShift Container Platform cluster to use the OVN-Kubernetes network plugin, update your cluster to the latest z-stream release so that all the latest bug fixes apply to your cluster.
It is not available for hosted control plane deployment types. This migration method is valuable for deployment types that require constant service availability and offers the following benefits:
- Continuous service availability
- Minimized downtime
- Automatic node rebooting
- Seamless transition from the OpenShift SDN network plugin to the OVN-Kubernetes network plugin
Although a rollback procedure is provided, the limited live migration is intended to be a one-way process.
OpenShift SDN CNI is deprecated as of OpenShift Container Platform 4.14. As of OpenShift Container Platform 4.15, the network plugin is not an option for new installations. In a subsequent future release, the OpenShift SDN network plugin is planned to be removed and no longer supported. Red Hat will provide bug fixes and support for this feature until it is removed, but this feature will no longer receive enhancements. As an alternative to OpenShift SDN CNI, you can use OVN Kubernetes CNI instead. For more information, see OpenShift SDN CNI removal.
The following sections provide more information about the limited live migration method.
19.5.1.1. Supported platforms when using the limited live migration method
The following table provides information about the supported platforms for the limited live migration type.
| Platform | Limited Live Migration |
|---|---|
| Bare-metal hardware | ✓ |
| Amazon Web Services (AWS) | ✓ |
| Google Cloud | ✓ |
| IBM Cloud® | ✓ |
| IBM Power® | ✓ |
| Microsoft Azure | ✓ |
| Red Hat OpenStack Platform (RHOSP) | ✓ |
| VMware vSphere | ✓ |
| Nutanix | ✓ |
Each listed platform supports installing an OpenShift Container Platform cluster on installer-provisioned infrastructure and user-provisioned infrastructure.
19.5.1.2. Best practices for limited live migration to the OVN-Kubernetes network plugin
For a list of best practices when migrating to the OVN-Kubernetes network plugin with the limited live migration method, see Limited Live Migration from OpenShift SDN to OVN-Kubernetes.
19.5.1.3. Considerations for limited live migration to the OVN-Kubernetes network plugin
Before using the limited live migration method to the OVN-Kubernetes network plugin, cluster administrators should consider the following information:
- The limited live migration procedure is unsupported for clusters with OpenShift SDN multitenant mode enabled.
- Egress router pods block the limited live migration process. They must be removed before beginning the limited live migration process.
- During the migration, when the cluster is running with both OVN-Kubernetes and OpenShift SDN, multicast and egress IP addresses are temporarily disabled for both CNIs. Egress firewalls remains functional.
- The migration is intended to be a one-way process. However, for users that want to rollback to OpenShift-SDN, migration from OpenShift-SDN to OVN-Kubernetes must have succeeded. Users can follow the same procedure below to migrate to the OpenShift SDN network plugin from the OVN-Kubernetes network plugin.
- The limited live migration is not supported on HyperShift clusters.
- OpenShift SDN does not support IPsec. After the migration, cluster administrators can enable IPsec.
- OpenShift SDN does not support IPv6. After the migration, cluster administrators can enable dual-stack.
-
The OpenShift SDN plugin allows application of the
NodeNetworkConfigurationPolicy(NNCP) custom resource (CR) to the primary interface on a node. The OVN-Kubernetes network plugin does not have this capability. The cluster MTU is the MTU value for pod interfaces. It is always less than your hardware MTU to account for the cluster network overlay overhead. The overhead is 100 bytes for OVN-Kubernetes and 50 bytes for OpenShift SDN.
During the limited live migration, both OVN-Kubernetes and OpenShift SDN run in parallel. OVN-Kubernetes manages the cluster network of some nodes, while OpenShift SDN manages the cluster network of others. To ensure that cross-CNI traffic remains functional, the Cluster Network Operator updates the routable MTU to ensure that both CNIs share the same overlay MTU. As a result, after the migration has completed, the cluster MTU is 50 bytes less.
-
OVN-Kubernetes reserves the
100.64.0.0/16and100.88.0.0/16IP address ranges. These subnets cannot be overlapped with any other internal or external network. If these IP addresses have been used by OpenShift SDN or any external networks that might communicate with this cluster, you must patch them to use a different IP address range before starting the limited live migration. See "Patching OVN-Kubernetes address ranges" for more information. -
If your
openshift-sdncluster with Precision Time Protocol (PTP) uses the User Datagram Protocol (UDP) for hardware time stamping and you migrate to the OVN-Kubernetes plugin, the hardware time stamping cannot be applied to primary interface devices, such as an Open vSwitch (OVS) bridge. As a result, UDP version 4 configurations cannot work with abr-exinterface. - In most cases, the limited live migration is independent of the secondary interfaces of pods created by the Multus CNI plugin. However, if these secondary interfaces were set up on the default network interface controller (NIC) of the host, for example, using MACVLAN, IPVLAN, SR-IOV, or bridge interfaces with the default NIC as the control node, OVN-Kubernetes might encounter malfunctions. Users should remove such configurations before proceeding with the limited live migration.
- When there are multiple NICs inside of the host, and the default route is not on the interface that has the Kubernetes NodeIP, you must use the offline migration instead.
-
All
DaemonSetobjects in theopenshift-sdnnamespace, which are not managed by the Cluster Network Operator (CNO), must be removed before initiating the limited live migration. These unmanaged daemon sets can cause the migration status to remain incomplete if not properly handled. -
If you run an Operator or you have configured any application with the pod disruption budget, you might experience an interruption during the update process. If
minAvailableis set to 1 inPodDisruptionBudget, the nodes are drained to apply pending machine configs which might block the eviction process. If several nodes are rebooted, all the pods might run on only one node, and thePodDisruptionBudgetfield can prevent the node drain. Like OpenShift SDN, OVN-Kubernetes resources such as
EgressFirewallresources requireClusterAdminprivileges. Migrating from OpenShift SDN to OVN-Kubernetes does not automatically update role-base access control (RBAC) resources. OpenShift SDN resources granted to a project administrator through theaggregate-to-adminClusterRolemust be manually reviewed and adjusted, as these changes are not included in the migration process.After migration, manual verification of RBAC resources is required. For information about setting the
aggregate-to-adminClusterRole after migration, see the example in How to allow project admins to manage Egressfirewall resources in RHOCP4.-
When a cluster depends on static routes or routing policies in the host network so that pods can reach some destinations, users should set
routingViaHostspec totrueandipForwardingtoGlobalin thegatewayConfigobject before the migration. This will offload routing decision to host kernel. For more information, see Recommended practice to follow before Openshift SDN network plugin migration to OVNKubernetes plugin (Red Hat Knowledgebase) and, see step five in "Checking cluster resources before initiating the limited live migration". -
To prevent traffic flow issues, check existing network policies in any namespaces that host applications that rely on system components. If a policy exists, enable traffic that originates from
openshift-ingressoropenshift-kube-apiserversystem services to prevent the default setting from blocking this traffic.
19.5.1.4. How the limited live migration process works
The following table summarizes the limited live migration process by segmenting between the user-initiated steps in the process and the actions that the migration script performs in response.
| User-initiated steps | Migration activity |
|---|---|
|
Patch the cluster-level networking configuration by changing the |
|
19.5.1.5. Migrating to the OVN-Kubernetes network plugin by using the limited live migration method
Migrating to the OVN-Kubernetes network plugin by using the limited live migration method is a multiple step process that requires users to check the behavior of egress IP resources, egress firewall resources, and multicast enabled namespaces. Administrators must also review any network policies in their deployment and remove egress router resources before initiating the limited live migration process. The following procedures should be used in succession.
19.5.1.5.1. Checking cluster resources before initiating the limited live migration
Before migrating to OVN-Kubernetes by using the limited live migration, you should check for egress IP resources, egress firewall resources, and multicast-enabled namespaces on your OpenShift SDN deployment. You should also review any network policies in your deployment. If you find that your cluster has these resources before migration, you should check their behavior after migration to ensure that they are working as intended.
The following procedure shows you how to check for egress IP resources, egress firewall resources, multicast-enabled namespaces, network policies, and an NNCP. No action is necessary after checking for these resources.
Prerequisites
-
You have access to the cluster as a user with the
cluster-adminrole.
Procedure
As an OpenShift Container Platform cluster administrator, check for egress firewall resources. You can do this by using the
ocCLI, or by using the OpenShift Container Platform web console.To check for egress firewall resource by using the
ocCLI tool:To check for egress firewall resources, enter the following command:
$ oc get egressnetworkpolicies.network.openshift.io -AExample output
NAMESPACE NAME AGE <namespace> <example_egressfirewall> 5dYou can check the intended behavior of an egress firewall resource by using the
-o yamlflag. For example:$ oc get egressnetworkpolicy <example_egressfirewall> -n <namespace> -o yamlExample output
apiVersion: network.openshift.io/v1 kind: EgressNetworkPolicy metadata: name: <example_egress_policy> namespace: <namespace> spec: egress: - type: Allow to: cidrSelector: 0.0.0.0/0 - type: Deny to: cidrSelector: 10.0.0.0/8
To check for egress firewall resources by using the OpenShift Container Platform web console:
- On the OpenShift Container Platform web console, click Observe → Metrics.
-
In the Expression box, type
sdn_controller_num_egress_firewallsand click Run queries. If you have egress firewall resources, they are returned in the Expression box.
Check your cluster for egress IP resources. You can do this by using the
ocCLI, or by using the OpenShift Container Platform web console.To check for egress IPs by using the
ocCLI tool:To list namespaces with egress IP resources, enter the following command
$ oc get netnamespace -A | awk '$3 != ""'Example output
NAME NETID EGRESS IPS namespace1 14173093 ["10.0.158.173"] namespace2 14173020 ["10.0.158.173"]
To check for egress IPs by using the OpenShift Container Platform web console:
- On the OpenShift Container Platform web console, click Observe → Metrics.
-
In the Expression box, type
sdn_controller_num_egress_ipsand click Run queries. If you have egress firewall resources, they are returned in the Expression box.
Check your cluster for multicast enabled namespaces. You can do this by using the
ocCLI, or by using the OpenShift Container Platform web console.To check for multicast enabled namespaces by using the
ocCLI tool:To locate namespaces with multicast enabled, enter the following command:
$ oc get netnamespace -o json | jq -r '.items[] | select(.metadata.annotations."netnamespace.network.openshift.io/multicast-enabled" == "true") | .metadata.name'Example output
namespace1 namespace3
To check for multicast enabled namespaces by using the OpenShift Container Platform web console:
- On the OpenShift Container Platform web console, click Observe → Metrics.
-
In the Expression box, type
sdn_controller_num_multicast_enabled_namespacesand click Run queries. If you have multicast enabled namespaces, they are returned in the Expression box.
Check your cluster for any network policies. You can do this by using the
ocCLI.To check for network policies by using the
ocCLI tool, enter the following command:$ oc get networkpolicy -n <namespace>Example output
NAME POD-SELECTOR AGE allow-multicast app=my-app 11m
Optional: If your cluster uses static routes or routing policies in the host network, set
routingViaHostspec totrueand theipForwardingspec toGlobalin thegatewayConfigobject during migration.$ oc patch Network.operator.openshift.io cluster --type=merge \ --patch '{ "spec":{ "defaultNetwork":{ "ovnKubernetesConfig":{ "gatewayConfig": { "ipForwarding": "Global", "routingViaHost": true }}}}}'Verify that the
ipForwardingspec has been set toGlobaland theroutingViaHostspec totrueby running the following command:$ oc get networks.operator.openshift.io cluster -o yaml | grep -A 5 "gatewayConfig"Example output
apiVersion: operator.openshift.io/v1 kind: Network metadata: name: cluster # ... gatewayConfig: ipForwarding: Global ipv4: {} ipv6: {} routingViaHost: true genevePort: 6081 # ...
19.5.1.5.2. Removing egress router pods before initiating the limited live migration
Before initiating the limited live migration, you must check for, and remove, any egress router pods. If there is an egress router pod on the cluster when performing a limited live migration, the Network Operator blocks the migration and returns the following error:
The cluster configuration is invalid (network type limited live migration is not supported for pods with `pod.network.openshift.io/assign-macvlan` annotation.
Please remove all egress router pods). Use `oc edit network.config.openshift.io cluster` to fix.Prerequisites
-
You have access to the cluster as a user with the
cluster-adminrole.
Procedure
To locate egress router pods on your cluster, enter the following command:
$ oc get pods --all-namespaces -o json | jq '.items[] | select(.metadata.annotations."pod.network.openshift.io/assign-macvlan" == "true") | {name: .metadata.name, namespace: .metadata.namespace}'Example output
{ "name": "egress-multi", "namespace": "egress-router-project" }Alternatively, you can query metrics on the OpenShift Container Platform web console.
- On the OpenShift Container Platform web console, click Observe → Metrics.
-
In the Expression box, enter
network_attachment_definition_instances{networks="egress-router"}. Then, click Add.
To remove an egress router pod, enter the following command:
$ oc delete pod <egress_pod_name> -n <egress_router_project>
19.5.1.5.3. Removing the NodeNetworkConfigurationPolicy (NNCP) custom resource (CR)
The OpenShift SDN plugin allows application of the NodeNetworkConfigurationPolicy (NNCP) custom resource (CR) to the primary interface on a node. The OVN-Kubernetes network plugin does not have this capability.
If you have an NNCP applied to the primary interface, you must delete the NNCP before migrating to the OVN-Kubernetes network plugin. Deleting the NNCP does not remove the configuration from the primary interface, but the Kubernetes-NMState cannot manage this configuration. Instead, the configure-ovs.sh shell script manages the primary interface and the configuration attached to it.
Prerequisites
- You created an NNCP CR and applied it to the primary interface of your network.
Procedure
Remove the configuration from the Cluster Network Operator (CNO) configuration object by running the following command:
$ oc patch Network.operator.openshift.io cluster --type='merge' \ --patch '{"spec":{"migration":null}}'Delete the
NodeNetworkConfigurationPolicy(NNCP) custom resource (CR) that defines the primary network interface for the OpenShift SDN network plugin by completing the following steps:Check that the existing NNCP CR bonded the primary interface to your cluster by entering the following command:
$ oc get nncpExample output
NAME STATUS REASON bondmaster0 Available SuccessfullyConfiguredNetwork Manager stores the connection profile for the bonded primary interface in the
/etc/NetworkManager/system-connectionssystem path.Remove the NNCP from your cluster:
$ oc delete nncp <nncp_manifest_filename>
19.5.1.5.4. Initiating the limited live migration process
After you have checked the behavior of egress IP resources, egress firewall resources, and multicast enabled namespaces, and removed any egress router resources, you can initiate the limited live migration process.
Prerequisites
- A cluster has been configured with the OpenShift SDN CNI network plugin in the network policy isolation mode.
-
You have installed the OpenShift CLI (
oc). -
You have access to the cluster as a user with the
cluster-adminrole. - You have created a recent backup of the etcd database.
- The cluster is in a known good state without any errors.
-
Before migration to OVN-Kubernetes, a security group rule must be in place to allow UDP packets on port
6081for all nodes on all cloud platforms. -
If the
100.64.0.0/16and100.88.0.0/16address ranges were previously in use by OpenShift-SDN, you have patched them. A step in the procedure checks whether these address ranges are in use. If they are in use, see "Patching OVN-Kubernetes address ranges". - You have checked for egress IP resources, egress firewall resources, and multicast enabled namespaces.
- You have removed any egress router pods before beginning the limited live migration. For more information about egress router pods, see "Deploying an egress router pod in redirect mode".
- You have reviewed the "Considerations for limited live migration to the OVN-Kubernetes network plugin" section of this document.
Procedure
To patch the cluster-level networking configuration and initiate the migration from OpenShift SDN to OVN-Kubernetes, enter the following command:
$ oc patch Network.config.openshift.io cluster --type='merge' --patch '{"metadata":{"annotations":{"network.openshift.io/network-type-migration":""}},"spec":{"networkType":"OVNKubernetes"}}'After running this command, the migration process begins. During this process, the Machine Config Operator reboots the nodes in your cluster twice. The migration takes approximately twice as long as a cluster upgrade.
ImportantThis
oc patchcommand checks for overlapping CIDRs in use by OpenShift SDN. If overlapping CIDRs are detected, you must patch them before the limited live migration process can start. For more information, see "Patching OVN-Kubernetes address ranges".Optional: To ensure that the migration process has completed, and to check the status of the
network.config, you can enter the following commands:$ oc get network.config.openshift.io cluster -o jsonpath='{.status.networkType}'$ oc get network.config cluster -o=jsonpath='{.status.conditions}' | jq .You can check limited live migration metrics for troubleshooting issues. For more information, see "Checking limited live migration metrics".
After a successful migration operation, remove the
network.openshift.io/network-type-migration-annotation from thenetwork.configcustom resource by entering the following command:$ oc annotate network.config cluster network.openshift.io/network-type-migration-
19.5.1.5.5. Patching OVN-Kubernetes address ranges
OVN-Kubernetes reserves the following IP address ranges:
-
100.64.0.0/16. This IP address range is used for theinternalJoinSubnetparameter of OVN-Kubernetes by default. -
100.88.0.0/16. This IP address range is used for theinternalTransSwitchSubnetparameter of OVN-Kubernetes by default.
If these IP addresses have been used by OpenShift SDN or any external networks that might communicate with this cluster, you must patch them to use a different IP address range before initiating the limited live migration.
The following procedure can be used to patch CIDR ranges that are in use by OpenShift SDN if the migration was initially blocked.
Only use this optional procedure if your cluster or network environment overlaps with the 100.64.0.0/16 subnet or the 100.88.0.0/16 subnet. Ensure that you run the steps in the procedure before you start the limited live migration operation.
Prerequisites
-
You have access to the cluster as a user with the
cluster-adminrole.
Procedure
If the
100.64.0.0/16IP address range is already in use, enter the following command to patch it to a different range. The following example uses100.70.0.0/16.$ oc patch network.operator.openshift.io cluster --type='merge' -p='{"spec":{"defaultNetwork":{"ovnKubernetesConfig":{"ipv4":{"internalJoinSubnet": "100.70.0.0/16"}}}}}'If the
100.88.0.0/16IP address range is already in use, enter the following command to patch it to a different range. The following example uses100.99.0.0/16.$ oc patch network.operator.openshift.io cluster --type='merge' -p='{"spec":{"defaultNetwork":{"ovnKubernetesConfig":{"ipv4":{"internalTransitSwitchSubnet": "100.99.0.0/16"}}}}}'
After patching the 100.64.0.0/16 and 100.88.0.0/16 IP address ranges, you can initiate the limited live migration.
19.5.1.5.6. Checking cluster resources after initiating the limited live migration
The following procedure shows you how to check for egress IP resources, egress firewall resources, multicast enabled namespaces, and network policies when your deploying is using OVN-Kubernetes. If you had these resources on OpenShift SDN, you should check them after migration to ensure that they are working properly.
Prerequisites
-
You have access to the cluster as a user with the
cluster-adminrole. - You have successfully migrated from OpenShift SDN to OVN-Kubernetes by using the limited live migration.
Procedure
As an OpenShift Container Platform cluster administrator, check for egress firewall resources. You can do this by using the
ocCLI, or by using the OpenShift Container Platform web console.To check for egress firewall resource by using the
ocCLI tool:To check for egress firewall resources, enter the following command:
$ oc get egressfirewalls.k8s.ovn.org -AExample output
NAMESPACE NAME AGE <namespace> <example_egressfirewall> 5dYou can check the intended behavior of an egress firewall resource by using the
-o yamlflag. For example:$ oc get egressfirewall <example_egressfirewall> -n <namespace> -o yamlExample output
apiVersion: k8s.ovn.org/v1 kind: EgressFirewall metadata: name: <example_egress_policy> namespace: <namespace> spec: egress: - type: Allow to: cidrSelector: 192.168.0.0/16 - type: Deny to: cidrSelector: 0.0.0.0/0Ensure that the behavior of this resource is intended because it could have changed after migration. For more information about egress firewalls, see "Configuring an egress firewall for a project".
To check for egress firewall resources by using the OpenShift Container Platform web console:
- On the OpenShift Container Platform web console, click Observe → Metrics.
-
In the Expression box, type
ovnkube_controller_num_egress_firewall_rulesand click Run queries. If you have egress firewall resources, they are returned in the Expression box.
Check your cluster for egress IP resources. You can do this by using the
ocCLI, or by using the OpenShift Container Platform web console.To check for egress IPs by using the
ocCLI tool:To list the namespace with egress IP resources, enter the following command:
$ oc get egressipExample output
NAME EGRESSIPS ASSIGNED NODE ASSIGNED EGRESSIPS egress-sample 192.0.2.10 ip-10-0-42-79.us-east-2.compute.internal 192.0.2.10 egressip-sample-2 192.0.2.14 ip-10-0-42-79.us-east-2.compute.internal 192.0.2.14To provide detailed information about an egress IP, enter the following command:
$ oc get egressip <egressip_name> -o yamlExample output
apiVersion: k8s.ovn.org/v1 kind: EgressIP metadata: annotations: kubectl.kubernetes.io/last-applied-configuration: | {"apiVersion":"k8s.ovn.org/v1","kind":"EgressIP","metadata":{"annotations":{},"name":"egressip-sample"},"spec":{"egressIPs":["192.0.2.12","192.0.2.13"],"namespaceSelector":{"matchLabels":{"name":"my-namespace"}}}} creationTimestamp: "2024-06-27T15:48:36Z" generation: 7 name: egressip-sample resourceVersion: "125511578" uid: b65833c8-781f-4cc9-bc96-d970259a7631 spec: egressIPs: - 192.0.2.12 - 192.0.2.13 namespaceSelector: matchLabels: name: my-namespaceRepeat this for all egress IPs. Ensure that the behavior of each resource is intended because it could have changed after migration. For more information about EgressIPs, see "Configuring an EgressIP address".
To check for egress IPs by using the OpenShift Container Platform web console:
- On the OpenShift Container Platform web console, click Observe → Metrics.
-
In the Expression box, type
ovnkube_clustermanager_num_egress_ipsand click Run queries. If you have egress firewall resources, they are returned in the Expression box.
Check your cluster for multicast enabled namespaces. You can only do this by using the
ocCLI.To locate namespaces with multicast enabled, enter the following command:
$ oc get namespace -o json | jq -r '.items[] | select(.metadata.annotations."k8s.ovn.org/multicast-enabled" == "true") | .metadata.name'Example output
namespace1 namespace3To describe each multicast enabled namespace, enter the following command:
$ oc describe namespace <namespace>Example output
Name: my-namespace Labels: kubernetes.io/metadata.name=my-namespace pod-security.kubernetes.io/audit=restricted pod-security.kubernetes.io/audit-version=v1.24 pod-security.kubernetes.io/warn=restricted pod-security.kubernetes.io/warn-version=v1.24 Annotations: k8s.ovn.org/multicast-enabled: true openshift.io/sa.scc.mcs: s0:c25,c0 openshift.io/sa.scc.supplemental-groups: 1000600000/10000 openshift.io/sa.scc.uid-range: 1000600000/10000 Status: ActiveEnsure that multicast functionality is correctly configured and working as expected in each namespace. For more information, see "Enabling multicast for a project".
Check your cluster’s network policies. You can only do this by using the
ocCLI.To obtain information about network policies within a namespace, enter the following command:
$ oc get networkpolicy -n <namespace>Example output
NAME POD-SELECTOR AGE allow-multicast app=my-app 11mTo provide detailed information about the network policy, enter the following command:
$ oc describe networkpolicy allow-multicast -n <namespace>Example output
Name: allow-multicast Namespace: my-namespace Created on: 2024-07-24 14:55:03 -0400 EDT Labels: <none> Annotations: <none> Spec: PodSelector: app=my-app Allowing ingress traffic: To Port: <any> (traffic allowed to all ports) From: IPBlock: CIDR: 224.0.0.0/4 Except: Allowing egress traffic: To Port: <any> (traffic allowed to all ports) To: IPBlock: CIDR: 224.0.0.0/4 Except: Policy Types: Ingress, EgressEnsure that the behavior of the network policy is as intended. Optimization for network policies differ between SDN and OVN-K, so users might need to adjust their policies to achieve optimal performance for different CNIs. For more information, see "About network policy".
19.5.1.6. Checking limited live migration metrics
Metrics are available to monitor the progress of the limited live migration. Metrics can be viewed on the OpenShift Container Platform web console, or by using the oc CLI.
Prerequisites
- You have initiated a limited live migration to OVN-Kubernetes.
Procedure
To view limited live migration metrics on the OpenShift Container Platform web console:
- Click Observe → Metrics.
- In the Expression box, type openshift_network and click the openshift_network_operator_live_migration_condition option.
To view metrics by using the
ocCLI:Enter the following command to generate a token for the
prometheus-k8sservice account in theopenshift-monitoringnamespace:$ token=`oc create token prometheus-k8s -n openshift-monitoring`Enter the following command to request information about the
openshift_network_operator_live_migration_conditionmetric:$ oc -n openshift-monitoring exec -c prometheus prometheus-k8s-0 -- curl -k -H "Authorization: Bearer $token" 'https://thanos-querier.openshift-monitoring.svc:9091/api/v1/query?' --data-urlencode 'query=openshift_network_operator_live_migration_condition' | jqExample output
"status": "success", "data": { "resultType": "vector", "result": [ { "metric": { "__name__": "openshift_network_operator_live_migration_condition", "container": "network-operator", "endpoint": "metrics", "instance": "10.0.83.62:9104", "job": "metrics", "namespace": "openshift-network-operator", "pod": "network-operator-6c87754bc6-c8qld", "prometheus": "openshift-monitoring/k8s", "service": "metrics", "type": "NetworkTypeMigrationInProgress" }, "value": [ 1717653579.587, "1" ] }, ...
The table in "Information about limited live migration metrics" shows you the available metrics and the label values populated from the openshift_network_operator_live_migration_condition expression. Use this information to monitor progress or to troubleshoot the migration.
19.5.1.6.1. Information about limited live migration metrics
The following table shows you the available metrics and the label values populated from the openshift_network_operator_live_migration_condition expression. Use this information to monitor progress or to troubleshoot the migration.
| Metric | Label values |
|---|---|
|
|
|
|
19.5.3. Offline migration to the OVN-Kubernetes network plugin overview
The offline migration method is a manual process that includes some downtime, during which your cluster is unreachable. You can use an Ansible playbook that automates the offline migration steps so that you can save time. These methods are primarily used for self-managed OpenShift Container Platform deployments, and are an alternative to the limited live migration procedure. Use these methods only when you cannot perform a limited live migration to the OVN-Kubernetes network plugin.
Before you migrate your OpenShift Container Platform cluster to use the OVN-Kubernetes network plugin, update your cluster to the latest z-stream release so that all the latest bug fixes apply to your cluster.
Although a rollback procedure is provided, the offline migration methods are intended as one-way processes.
OpenShift SDN CNI is deprecated as of OpenShift Container Platform 4.14. As of OpenShift Container Platform 4.15, the network plugin is not an option for new installations. In a subsequent future release, the OpenShift SDN network plugin is planned to be removed and no longer supported. Red Hat will provide bug fixes and support for this feature until it is removed, but this feature will no longer receive enhancements. As an alternative to OpenShift SDN CNI, you can use OVN Kubernetes CNI instead. For more information, see OpenShift SDN CNI removal.
The following sections provide more information about the offline migration method.
19.5.3.1. Supported platforms when using the offline migration methods
The following table provides information about the supported platforms for the manual offline migration type.
| Platform | Offline migration |
|---|---|
| Bare-metal hardware | ✓ |
| Amazon Web Services (AWS) | ✓ |
| Google Cloud | ✓ |
| IBM Cloud® | ✓ |
| Microsoft Azure | ✓ |
| Red Hat OpenStack Platform (RHOSP) | ✓ |
| VMware vSphere | ✓ |
| Nutanix | ✓ |
The following table provides information about the supported platforms for the manual offline migration type.
| Platform | Ansible playbook offline migration |
|---|---|
| Bare-metal hardware | ✓ |
| Amazon Web Services (AWS) | ✓ |
| Google Cloud | ✓ |
| IBM Cloud® | ✓ |
| Microsoft Azure | ✓ |
| VMware vSphere | ✓ |
For each listed platform in these tables, the platform supports installing an OpenShift Container Platform cluster on installer-provisioned infrastructure and user-provisioned infrastructure.
19.5.3.2. Best practices for manual offline migration and the Ansible playbook offline migration methods
For a list of best practices when migrating to the OVN-Kubernetes network plugin with the offline migration method, see Best practices for OpenShift SDN to OVN Kubernetes CNI Offline migration.
19.5.3.3. Considerations for the offline migration methods to the OVN-Kubernetes network plugin
If you have more than 150 nodes in your OpenShift Container Platform cluster, then open a support case for consultation on your migration to the OVN-Kubernetes network plugin.
The subnets assigned to nodes and the IP addresses assigned to individual pods are not preserved during the migration.
While the OVN-Kubernetes network plugin implements many of the capabilities present in the OpenShift SDN network plugin, the configuration is not the same.
If your cluster uses any of the following OpenShift SDN network plugin capabilities, you must manually configure the same capability in the OVN-Kubernetes network plugin:
- Namespace isolation
- Egress router pods
-
Before migrating to OVN-Kubernetes, ensure that the following IP address ranges are not in use:
100.64.0.0/16,169.254.169.0/29,100.88.0.0/16,fd98::/64,fd69::/125, andfd97::/64. OVN-Kubernetes uses these ranges internally. Do not include any of these ranges in any other CIDR definitions in your cluster or infrastructure. -
If your
openshift-sdncluster with Precision Time Protocol (PTP) uses the User Datagram Protocol (UDP) for hardware time stamping and you migrate to the OVN-Kubernetes plugin, the hardware time stamping cannot be applied to primary interface devices, such as an Open vSwitch (OVS) bridge. As a result, UDP version 4 configurations cannot work with abr-exinterface. -
Similar to OpenShift SDN, OVN-Kubernetes resources require
ClusterAdminprivileges. Migrating from OpenShift SDN to OVN-Kubernetes does not automatically update role-base access control (RBAC) resources. OpenShift SDN resources granted to a project administrator through theaggregate-to-adminClusterRolemust be manually reviewed and adjusted, as these changes are not included in the migration process. After migration, manual verification of RBAC resources is required. -
To prevent traffic flow issues, check existing network policies in any namespaces that host applications that rely on system components. If a policy exists, enable traffic that originates from
openshift-ingressoropenshift-kube-apiserversystem services to prevent the default setting from blocking this traffic.
The following sections highlight the differences in configuration between the aforementioned capabilities in OVN-Kubernetes and OpenShift SDN network plugins.
19.5.3.3.1. Primary network interface
The OpenShift SDN plugin allows application of the NodeNetworkConfigurationPolicy (NNCP) custom resource (CR) to the primary interface on a node. The OVN-Kubernetes network plugin does not have this capability.
If you have an NNCP applied to the primary interface, you must delete the NNCP before migrating to the OVN-Kubernetes network plugin. Deleting the NNCP does not remove the configuration from the primary interface, but with OVN-Kubernetes, the Kubernetes NMState cannot manage this configuration. Instead, the configure-ovs.sh shell script manages the primary interface and the configuration attached to this interface.
19.5.3.3.2. Namespace isolation
OVN-Kubernetes supports only the network policy isolation mode.
For a cluster using OpenShift SDN that is configured in either the multitenant or subnet isolation mode, you can still migrate to the OVN-Kubernetes network plugin. Note that after the migration operation, multitenant isolation mode is dropped, so you must manually configure network policies to achieve the same level of project-level isolation for pods and services.
19.5.3.3.3. Egress IP addresses
OpenShift SDN supports two different Egress IP modes:
- In the automatically assigned approach, an egress IP address range is assigned to a node.
- In the manually assigned approach, a list of one or more egress IP addresses is assigned to a node.
The migration process supports migrating Egress IP configurations that use the automatically assigned mode.
The differences in configuring an egress IP address between OVN-Kubernetes and OpenShift SDN is described in the following table:
| OVN-Kubernetes | OpenShift SDN |
|---|---|
|
|
For more information on using egress IP addresses in OVN-Kubernetes, see "Configuring an egress IP address".
19.5.3.3.4. Egress network policies
The difference in configuring an egress network policy, also known as an egress firewall, between OVN-Kubernetes and OpenShift SDN is described in the following table:
| OVN-Kubernetes | OpenShift SDN |
|---|---|
|
|
Because the name of an EgressFirewall object can only be set to default, after the migration all migrated EgressNetworkPolicy objects are named default, regardless of what the name was under OpenShift SDN.
If you subsequently rollback to OpenShift SDN, all EgressNetworkPolicy objects are named default as the prior name is lost.
For more information on using an egress firewall in OVN-Kubernetes, see "Configuring an egress firewall for a project".
19.5.3.3.5. Egress router pods
OVN-Kubernetes supports egress router pods in redirect mode. OVN-Kubernetes does not support egress router pods in HTTP proxy mode or DNS proxy mode.
When you deploy an egress router with the Cluster Network Operator, you cannot specify a node selector to control which node is used to host the egress router pod.
19.5.3.3.6. Multicast
The difference between enabling multicast traffic on OVN-Kubernetes and OpenShift SDN is described in the following table:
| OVN-Kubernetes | OpenShift SDN |
|---|---|
|
|
For more information on using multicast in OVN-Kubernetes, see "Enabling multicast for a project".
19.5.3.3.7. Network policies
OVN-Kubernetes fully supports the Kubernetes NetworkPolicy API in the networking.k8s.io/v1 API group. No changes are necessary in your network policies when migrating from OpenShift SDN.
19.5.3.4. How the offline migration process works
The following table summarizes the migration process by segmenting between the user-initiated steps in the process and the actions that the migration performs in response.
| User-initiated steps | Migration activity |
|---|---|
|
Set the |
|
|
Update the |
|
| Reboot each node in the cluster. |
|
19.5.3.5. Using an Ansible playbook to migrate to the OVN-Kubernetes network plugin
As a cluster administrator, you can use an Ansible collection, network.offline_migration_sdn_to_ovnk, to migrate from the OpenShift SDN Container Network Interface (CNI) network plugin to the OVN-Kubernetes plugin for your cluster. The Ansible collection includes the following playbooks:
-
playbooks/playbook-migration.yml: Includes playbooks that execute in a sequence where each playbook represents a step in the migration process. -
playbooks/playbook-rollback.yml: Includes playbooks that execute in a sequence where each playbook represents a step in the rollback process.
Prerequisites
-
You installed the
python3package, minimum version 3.10. -
You installed the
jmespathandjqpackages. - You logged in to the Red Hat Hybrid Cloud Console and opened the Ansible Automation Platform web console.
-
You created a security group rule that allows User Datagram Protocol (UDP) packets on port
6081for all nodes on all cloud platforms. If you do not do this task, your cluster might fail to schedule pods. Check if your cluster uses static routes or routing policies in the host network.
-
If true, a later procedure step requires that you set the
routingViaHostparameter totrueand theipForwardingparameter toGlobalin thegatewayConfigsection of theplaybooks/playbook-migration.ymlfile.
-
If true, a later procedure step requires that you set the
-
If the OpenShift-SDN plugin uses the
100.64.0.0/16and100.88.0.0/16address ranges, you patched the address ranges. For more information, see "Patching OVN-Kubernetes address ranges" in the Additional resources section.
Procedure
Install the
ansible-corepackage, minimum version 2.15. The following example command shows how to install theansible-corepackage on Red Hat Enterprise Linux (RHEL):$ sudo dnf install -y ansible-coreCreate an
ansible.cfgfile and add information similar to the following example to the file. Ensure that file exists in the same directory as where theansible-galaxycommands and the playbooks run.$ cat << EOF >> ansible.cfg [galaxy] server_list = automation_hub, validated [galaxy_server.automation_hub] url=https://console.redhat.com/api/automation-hub/content/published/ auth_url=https://sso.redhat.com/auth/realms/redhat-external/protocol/openid-connect/token token= #[galaxy_server.release_galaxy] #url=https://galaxy.ansible.com/ [galaxy_server.validated] url=https://console.redhat.com/api/automation-hub/content/validated/ auth_url=https://sso.redhat.com/auth/realms/redhat-external/protocol/openid-connect/token token= EOFFrom the Ansible Automation Platform web console, go to the Connect to Hub page and complete the following steps:
- In the Offline token section of the page, click the Load token button.
- After the token loads, click the Copy to clipboard icon.
-
Open the
ansible.cfgfile and paste the API token in thetoken=parameter. The API token is required for authenticating against the server URL specified in theansible.cfgfile.
Install the
network.offline_migration_sdn_to_ovnkAnsible collection by entering the followingansible-galaxycommand:$ ansible-galaxy collection install network.offline_migration_sdn_to_ovnkVerify that the
network.offline_migration_sdn_to_ovnkAnsible collection is installed on your system:$ ansible-galaxy collection list | grep network.offline_migration_sdn_to_ovnkExample output
network.offline_migration_sdn_to_ovnk 1.0.2The
network.offline_migration_sdn_to_ovnkAnsible collection is saved in the default path of~/.ansible/collections/ansible_collections/network/offline_migration_sdn_to_ovnk/.Configure migration features in the
playbooks/playbook-migration.ymlfile:# ... migration_interface_name: eth0 migration_disable_auto_migration: true migration_egress_ip: false migration_egress_firewall: false migration_multicast: false migration_routing_via_host: true migration_ip_forwarding: Global migration_cidr: "10.240.0.0/14" migration_prefix: 23 migration_mtu: 1400 migration_geneve_port: 6081 migration_ipv4_subnet: "100.64.0.0/16" # ...migration_interface_name-
If you use an
NodeNetworkConfigurationPolicy(NNCP) resource on a primary interface, specify the interface name in themigration-playbook.ymlfile so that the NNCP resource gets deleted on the primary interface during the migration process. migration_disable_auto_migration-
Disables the auto-migration of OpenShift SDN CNI plug-in features to the OVN-Kubernetes plugin. If you disable auto-migration of features, you must also set the
migration_egress_ip,migration_egress_firewall, andmigration_multicastparameters tofalse. If you need to enable auto-migration of features, set the parameter tofalse. migration_routing_via_host-
Set to
trueto configure local gateway mode orfalseto configure shared gateway mode for nodes in your cluster. The default value isfalse. In local gateway mode, traffic is routed through the host network stack. In shared gateway mode, traffic is not routed through the host network stack. migration_ip_forwarding-
If you configured local gateway mode, set IP forwarding to
Globalif you need the host network of the node to act as a router for traffic not related to OVN-Kubernetes. migration_cidr-
Specifies a Classless Inter-Domain Routing (CIDR) IP address block for your cluster. You cannot use any CIDR block that overlaps the
100.64.0.0/16CIDR block, because the OVN-Kubernetes network provider uses this block internally. migration_prefix- Ensure that you specify a prefix value, which is the slice of the CIDR block apportioned to each node in your cluster.
migration_mtu- Optional parameter that sets a specific maximum transmission unit (MTU) to your cluster network after the migration process.
migration_geneve_port-
Optional parameter that sets a Geneve port for OVN-Kubernetes. The default port is
6081. migration_ipv4_subnet-
Optional parameter that sets an IPv4 address range for internal use by OVN-Kubernetes. The default value for the parameter is
100.64.0.0/16.
To run the
playbooks/playbook-migration.ymlfile, enter the following command:$ ansible-playbook -v playbooks/playbook-migration.yml
19.5.3.6. Migrating to the OVN-Kubernetes network plugin by using the offline migration method
As a cluster administrator, you can change the network plugin for your cluster to OVN-Kubernetes. During the migration, you must reboot every node in your cluster.
While performing the migration, your cluster is unavailable and workloads might be interrupted. Perform the migration only when an interruption in service is acceptable.
Prerequisites
You have a cluster configured with the OpenShift SDN CNI network plugin in the network policy isolation mode.
ImportantFor a cluster that uses OpenShift SDN that is configured in either the multitenant or subnet isolation mode, you can still migrate to the OVN-Kubernetes network plugin by using the offline migration method. Note that after the migration operation, multitenant isolation mode is dropped, so you must manually configure network policies to achieve the same level of project-level isolation for pods and services.
-
You installed the OpenShift CLI (
oc). -
You have access to the cluster as a user with the
cluster-adminrole. - You have a recent backup of the etcd database.
- You can manually reboot each node.
- You checked that your cluster is in a known good state without any errors.
-
You created a security group rule that allows User Datagram Protocol (UDP) packets on port
6081for all nodes on all cloud platforms. - You removed webhooks. Alternatively, you can set a timeout value for each webhook, which is detailed in the procedure. If you did not complete one of these tasks, your cluster might fail to schedule pods.
Procedure
If you did not remove webhooks, set the timeout value for each webhook to
3seconds by creating aValidatingWebhookConfigurationcustom resource and then specify the timeout value for thetimeoutSecondsparameter:oc patch ValidatingWebhookConfiguration <webhook_name> --type='json' \1 -p '[{"op": "replace", "path": "/webhooks/0/timeoutSeconds", "value": 3}]'- 1
- Where
<webhook_name>is the name of your webhook.
To backup the configuration for the cluster network, enter the following command:
$ oc get Network.config.openshift.io cluster -o yaml > cluster-openshift-sdn.yamlVerify that the
OVN_SDN_MIGRATION_TIMEOUTenvironment variable is set and is equal to0sby running the following command:#!/bin/bash if [ -n "$OVN_SDN_MIGRATION_TIMEOUT" ] && [ "$OVN_SDN_MIGRATION_TIMEOUT" = "0s" ]; then unset OVN_SDN_MIGRATION_TIMEOUT fi #loops the timeout command of the script to repeatedly check the cluster Operators until all are available. co_timeout=${OVN_SDN_MIGRATION_TIMEOUT:-1200s} timeout "$co_timeout" bash <<EOT until oc wait co --all --for='condition=AVAILABLE=True' --timeout=10s && \ oc wait co --all --for='condition=PROGRESSING=False' --timeout=10s && \ oc wait co --all --for='condition=DEGRADED=False' --timeout=10s; do sleep 10 echo "Some ClusterOperators Degraded=False,Progressing=True,or Available=False"; done EOTRemove the configuration from the Cluster Network Operator (CNO) configuration object by running the following command:
$ oc patch Network.operator.openshift.io cluster --type='merge' \ --patch '{"spec":{"migration":null}}'Delete the
NodeNetworkConfigurationPolicy(NNCP) custom resource (CR) that defines the primary network interface for the OpenShift SDN network plugin by completing the following steps:Check that the existing NNCP CR bonded the primary interface to your cluster by entering the following command:
$ oc get nncpExample output
NAME STATUS REASON bondmaster0 Available SuccessfullyConfiguredNetwork Manager stores the connection profile for the bonded primary interface in the
/etc/NetworkManager/system-connectionssystem path.Remove the NNCP from your cluster:
$ oc delete nncp <nncp_manifest_filename>
To prepare all the nodes for the migration, set the
migrationfield on the CNO configuration object by running the following command:$ oc patch Network.operator.openshift.io cluster --type='merge' \ --patch '{ "spec": { "migration": { "networkType": "OVNKubernetes" } } }'NoteThis step does not deploy OVN-Kubernetes immediately. Instead, specifying the
migrationfield triggers the Machine Config Operator (MCO) to apply new machine configs to all the nodes in the cluster in preparation for the OVN-Kubernetes deployment.Check that the reboot is finished by running the following command:
$ oc get mcpCheck that all cluster Operators are available by running the following command:
$ oc get coAlternatively: You can disable automatic migration of several OpenShift SDN capabilities to the OVN-Kubernetes equivalents:
- Egress IPs
- Egress firewall
- Multicast
To disable automatic migration of the configuration for any of the previously noted OpenShift SDN features, specify the following keys:
$ oc patch Network.operator.openshift.io cluster --type='merge' \ --patch '{ "spec": { "migration": { "networkType": "OVNKubernetes", "features": { "egressIP": <bool>, "egressFirewall": <bool>, "multicast": <bool> } } } }'where:
bool: Specifies whether to enable migration of the feature. The default istrue.
Optional: You can customize the following settings for OVN-Kubernetes to meet your network infrastructure requirements:
Maximum transmission unit (MTU). Consider the following before customizing the MTU for this optional step:
- If you use the default MTU, and you want to keep the default MTU during migration, this step can be ignored.
- If you used a custom MTU, and you want to keep the custom MTU during migration, you must declare the custom MTU value in this step.
This step does not work if you want to change the MTU value during migration. Instead, you must first follow the instructions for "Changing the cluster MTU". You can then keep the custom MTU value by performing this procedure and declaring the custom MTU value in this step.
NoteOpenShift-SDN and OVN-Kubernetes have different overlay overhead. MTU values should be selected by following the guidelines found on the "MTU value selection" page.
- Geneve (Generic Network Virtualization Encapsulation) overlay network port
- OVN-Kubernetes IPv4 internal subnet
The gateway mode and IP forwarding
-
If your cluster uses static routes or routing policies in the host network, set the
routingViaHostspec totrueand theipForwardingspec toGlobalin thegatewayConfigobject.
-
If your cluster uses static routes or routing policies in the host network, set the
To customize any of the previously noted settings, enter and customize the following command. If you do not need to change the default value, omit the key from the patch.
$ oc patch Network.operator.openshift.io cluster --type=merge \ --patch '{ "spec": { "defaultNetwork": { "ovnKubernetesConfig": { "mtu": <mtu>, "genevePort": <port>, "ipv4": "InternalJoinSubnet": "<ipv4_subnet>", "gatewayConfig": { "ipForwarding": "<ip_forwarding>", "routingViaHost": <gateway_mode> }}}}}'where:
mtu-
The MTU for the Geneve overlay network. This value is normally configured automatically, but if the nodes in your cluster do not all use the same MTU, then you must set this explicitly to
100less than the smallest node MTU value. port-
The UDP port for the Geneve overlay network. If a value is not specified, the default is
6081. The port cannot be the same as the VXLAN port that is used by OpenShift SDN. The default value for the VXLAN port is4789. ipv4_subnet-
An IPv4 address range for internal use by OVN-Kubernetes. You must ensure that the IP address range does not overlap with any other subnet used by your OpenShift Container Platform installation. The IP address range must be larger than the maximum number of nodes that can be added to the cluster. The default value is
100.64.0.0/16. routingViaHost-
A value of
truesets local gateway mode and a value offalsesets shared gateway mode. The default value isfalse. In local gateway mode, traffic is routed through the host network stack. In shared gateway mode, traffic is not routed through the host network stack. ipForwarding:-
Set IP forwarding to
Globalalongside the local gateway mode if you need the host network of the node to act as a router for traffic not related to OVN-Kubernetes.
Example
oc patchcommand to updatemtufield$ oc patch Network.operator.openshift.io cluster --type=merge \ --patch '{ "spec":{ "defaultNetwork":{ "ovnKubernetesConfig":{ "mtu":1200 }}}}'Example
oc patchcommand to update thegatewayConfigobject$ oc patch Network.operator.openshift.io cluster --type=merge \ --patch '{ "spec":{ "defaultNetwork":{ "ovnKubernetesConfig":{ "gatewayConfig": { "ipForwarding": "Global", "routingViaHost": true }}}}}'As the MCO updates machines in each machine config pool, it reboots each node one by one. You must wait until all the nodes are updated. Check the machine config pool status by entering the following command:
$ oc get mcpA successfully updated node has the following status:
UPDATED=true,UPDATING=false,DEGRADED=false.NoteBy default, the MCO updates one machine per pool at a time, causing the total time the migration takes to increase with the size of the cluster.
Confirm the status of the new machine configuration on the hosts:
To list the machine configuration state and the name of the applied machine configuration, enter the following command:
$ oc describe node | egrep "hostname|machineconfig"Example output
kubernetes.io/hostname=master-0 machineconfiguration.openshift.io/currentConfig: rendered-master-c53e221d9d24e1c8bb6ee89dd3d8ad7b machineconfiguration.openshift.io/desiredConfig: rendered-master-c53e221d9d24e1c8bb6ee89dd3d8ad7b machineconfiguration.openshift.io/reason: machineconfiguration.openshift.io/state: DoneVerify that the following statements are true:
-
The value of
machineconfiguration.openshift.io/statefield isDone. -
The value of the
machineconfiguration.openshift.io/currentConfigfield is equal to the value of themachineconfiguration.openshift.io/desiredConfigfield.
-
The value of
To confirm that the machine config is correct, enter the following command:
$ oc get machineconfig <config_name> -o yaml | grep ExecStartwhere
<config_name>is the name of the machine config from themachineconfiguration.openshift.io/currentConfigfield.The machine config can include the following update to the systemd configuration:
ExecStart=/usr/local/bin/configure-ovs.sh OVNKubernetesIf a node is stuck in the
NotReadystate, investigate the machine config daemon pod logs and resolve any errors.To list the pods, enter the following command:
$ oc get pod -n openshift-machine-config-operatorExample output
NAME READY STATUS RESTARTS AGE machine-config-controller-75f756f89d-sjp8b 1/1 Running 0 37m machine-config-daemon-5cf4b 2/2 Running 0 43h machine-config-daemon-7wzcd 2/2 Running 0 43h machine-config-daemon-fc946 2/2 Running 0 43h machine-config-daemon-g2v28 2/2 Running 0 43h machine-config-daemon-gcl4f 2/2 Running 0 43h machine-config-daemon-l5tnv 2/2 Running 0 43h machine-config-operator-79d9c55d5-hth92 1/1 Running 0 37m machine-config-server-bsc8h 1/1 Running 0 43h machine-config-server-hklrm 1/1 Running 0 43h machine-config-server-k9rtx 1/1 Running 0 43hThe names for the config daemon pods are in the following format:
machine-config-daemon-<seq>. The<seq>value is a random five character alphanumeric sequence.Display the pod log for the first machine config daemon pod shown in the previous output by enter the following command:
$ oc logs <pod> -n openshift-machine-config-operatorwhere
podis the name of a machine config daemon pod.- Resolve any errors in the logs shown by the output from the previous command.
To start the migration, configure the OVN-Kubernetes network plugin by using one of the following commands:
To specify the network provider without changing the cluster network IP address block, enter the following command:
$ oc patch Network.config.openshift.io cluster \ --type='merge' --patch '{ "spec": { "networkType": "OVNKubernetes" } }'To specify a different cluster network IP address block, enter the following command:
$ oc patch Network.config.openshift.io cluster \ --type='merge' --patch '{ "spec": { "clusterNetwork": [ { "cidr": "<cidr>", "hostPrefix": <prefix> } ], "networkType": "OVNKubernetes" } }'where
cidris a CIDR block andprefixis the slice of the CIDR block apportioned to each node in your cluster. You cannot use any CIDR block that overlaps with the100.64.0.0/16CIDR block because the OVN-Kubernetes network provider uses this block internally.ImportantYou cannot change the service network address block during the migration.
Verify that the Multus daemon set rollout is complete before continuing with subsequent steps:
$ oc -n openshift-multus rollout status daemonset/multusThe name of the Multus pods is in the form of
multus-<xxxxx>where<xxxxx>is a random sequence of letters. It might take several moments for the pods to restart.Example output
Waiting for daemon set "multus" rollout to finish: 1 out of 6 new pods have been updated... ... Waiting for daemon set "multus" rollout to finish: 5 of 6 updated pods are available... daemon set "multus" successfully rolled outTo complete changing the network plugin, reboot each node in your cluster. You can reboot the nodes in your cluster with either of the following approaches:
ImportantThe following scripts reboot all of the nodes in the cluster at the same time. This can cause your cluster to be unstable. Another option is to reboot your nodes manually one at a time. Rebooting nodes one-by-one causes considerable downtime in a cluster with many nodes.
Cluster Operators will not work correctly before you reboot the nodes.
With the
oc rshcommand, you can use a bash script similar to the following:#!/bin/bash readarray -t POD_NODES <<< "$(oc get pod -n openshift-machine-config-operator -o wide| grep daemon|awk '{print $1" "$7}')" for i in "${POD_NODES[@]}" do read -r POD NODE <<< "$i" until oc rsh -n openshift-machine-config-operator "$POD" chroot /rootfs shutdown -r +1 do echo "cannot reboot node $NODE, retry" && sleep 3 done doneWith the
sshcommand, you can use a bash script similar to the following. The script assumes that you have configured sudo to not prompt for a password.#!/bin/bash for ip in $(oc get nodes -o jsonpath='{.items[*].status.addresses[?(@.type=="InternalIP")].address}') do echo "reboot node $ip" ssh -o StrictHostKeyChecking=no core@$ip sudo shutdown -r -t 3 done
Confirm that the migration succeeded:
To confirm that the network plugin is OVN-Kubernetes, enter the following command. The value of
status.networkTypemust beOVNKubernetes.$ oc get network.config/cluster -o jsonpath='{.status.networkType}{"\n"}'To confirm that the cluster nodes are in the
Readystate, enter the following command:$ oc get nodesTo confirm that your pods are not in an error state, enter the following command:
$ oc get pods --all-namespaces -o wide --sort-by='{.spec.nodeName}'If pods on a node are in an error state, reboot that node.
To confirm that all of the cluster Operators are not in an abnormal state, enter the following command:
$ oc get coThe status of every cluster Operator must be the following:
AVAILABLE="True",PROGRESSING="False",DEGRADED="False". If a cluster Operator is not available or degraded, check the logs for the cluster Operator for more information.
Complete the following steps only if the migration succeeds and your cluster is in a good state:
To remove the migration configuration from the CNO configuration object, enter the following command:
$ oc patch Network.operator.openshift.io cluster --type='merge' \ --patch '{ "spec": { "migration": null } }'To remove custom configuration for the OpenShift SDN network provider, enter the following command:
$ oc patch Network.operator.openshift.io cluster --type='merge' \ --patch '{ "spec": { "defaultNetwork": { "openshiftSDNConfig": null } } }'To remove the OpenShift SDN network provider namespace, enter the following command:
$ oc delete namespace openshift-sdnAfter a successful migration operation, remove the
network.openshift.io/network-type-migration-annotation from thenetwork.configcustom resource by entering the following command:$ oc annotate network.config cluster network.openshift.io/network-type-migration-
Next steps
- Optional: After cluster migration, you can convert your IPv4 single-stack cluster to a dual-network cluster network that supports IPv4 and IPv6 address families. For more information, see "Converting to IPv4/IPv6 dual-stack networking".
19.5.4. Understanding changes to external IP behavior in OVN-Kubernetes
When migrating from OpenShift SDN to OVN-Kubernetes (OVN-K), services that use external IPs might become inaccessible across namespaces due to network policy enforcement.
In OpenShift SDN, external IPs were accessible across namespaces by default. However, in OVN-K, network policies strictly enforce multitenant isolation, preventing access to services exposed via external IPs from other namespaces.
To ensure access, consider the following alternatives:
- Use an ingress or route: Instead of exposing services by using external IPs, configure an ingress or route to allow external access while maintaining security controls.
-
Adjust the
NetworkPolicycustom resource (CR): Modify aNetworkPolicyCR to explicitly allow access from required namespaces and ensure that traffic is allowed to the designated service ports. Without explicitly allowing traffic to the required ports, access might still be blocked, even if the namespace is allowed. -
Use a
LoadBalancerservice: If applicable, deploy aLoadBalancerservice instead of relying on external IPs. For more information about configuring see "NetworkPolicy and external IPs in OVN-Kubernetes".
19.6. Rolling back to the OpenShift SDN network provider
As a cluster administrator, you can roll back to the OpenShift SDN network plugin from the OVN-Kubernetes network plugin using either the offline migration method, or the limited live migration method. This can only be done after the migration to the OVN-Kubernetes network plugin has successfully completed.
- If you used the offline migration method to migrate to the OpenShift SDN network plugin from the OVN-Kubernetes network plugin, you should use the offline migration rollback method.
- If you used the limited live migration method to migrate to the OpenShift SDN network plugin from the OVN-Kubernetes network plugin, you should use the limited live migration rollback method.
OpenShift SDN CNI is deprecated as of OpenShift Container Platform 4.14. As of OpenShift Container Platform 4.15, the network plugin is not an option for new installations. In a subsequent future release, the OpenShift SDN network plugin is planned to be removed and no longer supported. Red Hat will provide bug fixes and support for this feature until it is removed, but this feature will no longer receive enhancements. As an alternative to OpenShift SDN CNI, you can use OVN Kubernetes CNI instead. For more information, see OpenShift SDN CNI removal.
19.6.1. Using the offline migration method to roll back to the OpenShift SDN network plugin
Cluster administrators can roll back to the OpenShift SDN Container Network Interface (CNI) network plugin by using the offline migration method. During the migration you must manually reboot every node in your cluster. With the offline migration method, there is some downtime, during which your cluster is unreachable.
You must wait until the migration process from OpenShift SDN to OVN-Kubernetes network plugin is successful before initiating a rollback.
If a rollback to OpenShift SDN is required, the following table describes the process.
| User-initiated steps | Migration activity |
|---|---|
| Suspend the MCO to ensure that it does not interrupt the migration. | The MCO stops. |
|
Set the |
|
|
Update the |
|
| Reboot each node in the cluster. |
|
| Enable the MCO after all nodes in the cluster reboot. |
|
Prerequisites
-
The OpenShift CLI (
oc) is installed. - Access to the cluster as a user with the cluster-admin role is available.
- The cluster is installed on infrastructure configured with the OVN-Kubernetes network plugin.
- A recent backup of the etcd database is available.
- A manual reboot can be triggered for each node.
- The cluster is in a known good state, without any errors.
Procedure
Stop all of the machine configuration pools managed by the Machine Config Operator (MCO):
Stop the
masterconfiguration pool by entering the following command in your CLI:$ oc patch MachineConfigPool master --type='merge' --patch \ '{ "spec": { "paused": true } }'Stop the
workermachine configuration pool by entering the following command in your CLI:$ oc patch MachineConfigPool worker --type='merge' --patch \ '{ "spec":{ "paused": true } }'
To prepare for the migration, set the migration field to
nullby entering the following command in your CLI:$ oc patch Network.operator.openshift.io cluster --type='merge' \ --patch '{ "spec": { "migration": null } }'Check that the migration status is empty for the
Network.config.openshift.ioobject by entering the following command in your CLI. Empty command output indicates that the object is not in a migration operation.$ oc get Network.config cluster -o jsonpath='{.status.migration}'Apply the patch to the
Network.operator.openshift.ioobject to set the network plugin back to OpenShift SDN by entering the following command in your CLI:$ oc patch Network.operator.openshift.io cluster --type='merge' \ --patch '{ "spec": { "migration": { "networkType": "OpenShiftSDN" } } }'ImportantIf you applied the patch to the
Network.config.openshift.ioobject before the patch operation finalizes on theNetwork.operator.openshift.ioobject, the Cluster Network Operator (CNO) enters into a degradation state and this causes a slight delay until the CNO recovers from the degraded state.Confirm that the migration status of the network plugin for the
Network.config.openshift.io clusterobject isOpenShiftSDNby entering the following command in your CLI:$ oc get Network.config cluster -o jsonpath='{.status.migration.networkType}'Apply the patch to the
Network.config.openshift.ioobject to set the network plugin back to OpenShift SDN by entering the following command in your CLI:$ oc patch Network.config.openshift.io cluster --type='merge' \ --patch '{ "spec": { "networkType": "OpenShiftSDN" } }'Optional: Disable automatic migration of several OVN-Kubernetes capabilities to the OpenShift SDN equivalents:
- Egress IPs
- Egress firewall
- Multicast
To disable automatic migration of the configuration for any of the previously noted OpenShift SDN features, specify the following keys:
$ oc patch Network.operator.openshift.io cluster --type='merge' \ --patch '{ "spec": { "migration": { "networkType": "OpenShiftSDN", "features": { "egressIP": <bool>, "egressFirewall": <bool>, "multicast": <bool> } } } }'where:
bool: Specifies whether to enable migration of the feature. The default istrue.Optional: You can customize the following settings for OpenShift SDN to meet your network infrastructure requirements:
- Maximum transmission unit (MTU)
- VXLAN port
To customize either or both of the previously noted settings, customize and enter the following command in your CLI. If you do not need to change the default value, omit the key from the patch.
$ oc patch Network.operator.openshift.io cluster --type=merge \ --patch '{ "spec":{ "defaultNetwork":{ "openshiftSDNConfig":{ "mtu":<mtu>, "vxlanPort":<port> }}}}'mtu-
The MTU for the VXLAN overlay network. This value is normally configured automatically, but if the nodes in your cluster do not all use the same MTU, then you must set this explicitly to
50less than the smallest node MTU value. port-
The UDP port for the VXLAN overlay network. If a value is not specified, the default is
4789. The port cannot be the same as the Geneve port that is used by OVN-Kubernetes. The default value for the Geneve port is6081.
Example patch command
$ oc patch Network.operator.openshift.io cluster --type=merge \ --patch '{ "spec":{ "defaultNetwork":{ "openshiftSDNConfig":{ "mtu":1200 }}}}'Reboot each node in your cluster. You can reboot the nodes in your cluster with either of the following approaches:
With the
oc rshcommand, you can use a bash script similar to the following:#!/bin/bash readarray -t POD_NODES <<< "$(oc get pod -n openshift-machine-config-operator -o wide| grep daemon|awk '{print $1" "$7}')" for i in "${POD_NODES[@]}" do read -r POD NODE <<< "$i" until oc rsh -n openshift-machine-config-operator "$POD" chroot /rootfs shutdown -r +1 do echo "cannot reboot node $NODE, retry" && sleep 3 done doneWith the
sshcommand, you can use a bash script similar to the following. The script assumes that you have configured sudo to not prompt for a password.#!/bin/bash for ip in $(oc get nodes -o jsonpath='{.items[*].status.addresses[?(@.type=="InternalIP")].address}') do echo "reboot node $ip" ssh -o StrictHostKeyChecking=no core@$ip sudo shutdown -r -t 3 done
Wait until the Multus daemon set rollout completes. Run the following command to see your rollout status:
$ oc -n openshift-multus rollout status daemonset/multusThe name of the Multus pods is in the form of
multus-<xxxxx>where<xxxxx>is a random sequence of letters. It might take several moments for the pods to restart.Example output
Waiting for daemon set "multus" rollout to finish: 1 out of 6 new pods have been updated... ... Waiting for daemon set "multus" rollout to finish: 5 of 6 updated pods are available... daemon set "multus" successfully rolled outAfter the nodes in your cluster have rebooted and the multus pods are rolled out, start all of the machine configuration pools by running the following commands::
Start the master configuration pool:
$ oc patch MachineConfigPool master --type='merge' --patch \ '{ "spec": { "paused": false } }'Start the worker configuration pool:
$ oc patch MachineConfigPool worker --type='merge' --patch \ '{ "spec": { "paused": false } }'
As the MCO updates machines in each config pool, it reboots each node.
By default the MCO updates a single machine per pool at a time, so the time that the migration requires to complete grows with the size of the cluster.
Confirm the status of the new machine configuration on the hosts:
To list the machine configuration state and the name of the applied machine configuration, enter the following command in your CLI:
$ oc describe node | egrep "hostname|machineconfig"Example output
kubernetes.io/hostname=master-0 machineconfiguration.openshift.io/currentConfig: rendered-master-c53e221d9d24e1c8bb6ee89dd3d8ad7b machineconfiguration.openshift.io/desiredConfig: rendered-master-c53e221d9d24e1c8bb6ee89dd3d8ad7b machineconfiguration.openshift.io/reason: machineconfiguration.openshift.io/state: DoneVerify that the following statements are true:
-
The value of
machineconfiguration.openshift.io/statefield isDone. -
The value of the
machineconfiguration.openshift.io/currentConfigfield is equal to the value of themachineconfiguration.openshift.io/desiredConfigfield.
-
The value of
To confirm that the machine config is correct, enter the following command in your CLI:
$ oc get machineconfig <config_name> -o yamlwhere
<config_name>is the name of the machine config from themachineconfiguration.openshift.io/currentConfigfield.
Confirm that the migration succeeded:
To confirm that the network plugin is OpenShift SDN, enter the following command in your CLI. The value of
status.networkTypemust beOpenShiftSDN.$ oc get Network.config/cluster -o jsonpath='{.status.networkType}{"\n"}'To confirm that the cluster nodes are in the
Readystate, enter the following command in your CLI:$ oc get nodesIf a node is stuck in the
NotReadystate, investigate the machine config daemon pod logs and resolve any errors.To list the pods, enter the following command in your CLI:
$ oc get pod -n openshift-machine-config-operatorExample output
NAME READY STATUS RESTARTS AGE machine-config-controller-75f756f89d-sjp8b 1/1 Running 0 37m machine-config-daemon-5cf4b 2/2 Running 0 43h machine-config-daemon-7wzcd 2/2 Running 0 43h machine-config-daemon-fc946 2/2 Running 0 43h machine-config-daemon-g2v28 2/2 Running 0 43h machine-config-daemon-gcl4f 2/2 Running 0 43h machine-config-daemon-l5tnv 2/2 Running 0 43h machine-config-operator-79d9c55d5-hth92 1/1 Running 0 37m machine-config-server-bsc8h 1/1 Running 0 43h machine-config-server-hklrm 1/1 Running 0 43h machine-config-server-k9rtx 1/1 Running 0 43hThe names for the config daemon pods are in the following format:
machine-config-daemon-<seq>. The<seq>value is a random five character alphanumeric sequence.To display the pod log for each machine config daemon pod shown in the previous output, enter the following command in your CLI:
$ oc logs <pod> -n openshift-machine-config-operatorwhere
podis the name of a machine config daemon pod.- Resolve any errors in the logs shown by the output from the previous command.
To confirm that your pods are not in an error state, enter the following command in your CLI:
$ oc get pods --all-namespaces -o wide --sort-by='{.spec.nodeName}'If pods on a node are in an error state, reboot that node.
Complete the following steps only if the migration succeeds and your cluster is in a good state:
To remove the migration configuration from the Cluster Network Operator configuration object, enter the following command in your CLI:
$ oc patch Network.operator.openshift.io cluster --type='merge' \ --patch '{ "spec": { "migration": null } }'To remove the OVN-Kubernetes configuration, enter the following command in your CLI:
$ oc patch Network.operator.openshift.io cluster --type='merge' \ --patch '{ "spec": { "defaultNetwork": { "ovnKubernetesConfig":null } } }'To remove the OVN-Kubernetes network provider namespace, enter the following command in your CLI:
$ oc delete namespace openshift-ovn-kubernetes
19.6.2. Using an Ansible playbook to roll back to the OpenShift SDN network plugin
As a cluster administrator, you can use the playbooks/playbook-rollback.yml from the network.offline_migration_sdn_to_ovnk Ansible collection to roll back from the OVN-Kubernetes plugin to the OpenShift SDN Container Network Interface (CNI) network plugin.
Prerequisites
-
You installed the
python3package, minimum version 3.10. -
You installed the
jmespathandjqpackages. - You logged in to the Red Hat Hybrid Cloud Console and opened the Ansible Automation Platform web console.
-
You created a security group rule that allows User Datagram Protocol (UDP) packets on port
6081for all nodes on all cloud platforms. If you do not do this task, your cluster might fail to schedule pods.
Procedure
Install the
ansible-corepackage, minimum version 2.15. The following example command shows how to install theansible-corepackage on Red Hat Enterprise Linux (RHEL):$ sudo dnf install -y ansible-coreCreate an
ansible.cfgfile and add information similar to the following example to the file. Ensure that file exists in the same directory as where theansible-galaxycommands and the playbooks run.$ cat << EOF >> ansible.cfg [galaxy] server_list = automation_hub, validated [galaxy_server.automation_hub] url=https://console.redhat.com/api/automation-hub/content/published/ auth_url=https://sso.redhat.com/auth/realms/redhat-external/protocol/openid-connect/token token= #[galaxy_server.release_galaxy] #url=https://galaxy.ansible.com/ [galaxy_server.validated] url=https://console.redhat.com/api/automation-hub/content/validated/ auth_url=https://sso.redhat.com/auth/realms/redhat-external/protocol/openid-connect/token token= EOFFrom the Ansible Automation Platform web console, go to the Connect to Hub page and complete the following steps:
- In the Offline token section of the page, click the Load token button.
- After the token loads, click the Copy to clipboard icon.
-
Open the
ansible.cfgfile and paste the API token in thetoken=parameter. The API token is required for authenticating against the server URL specified in theansible.cfgfile.
Install the
network.offline_migration_sdn_to_ovnkAnsible collection by entering the followingansible-galaxycommand:$ ansible-galaxy collection install network.offline_migration_sdn_to_ovnkVerify that the
network.offline_migration_sdn_to_ovnkAnsible collection is installed on your system:$ ansible-galaxy collection list | grep network.offline_migration_sdn_to_ovnkExample output
network.offline_migration_sdn_to_ovnk 1.0.2The
network.offline_migration_sdn_to_ovnkAnsible collection is saved in the default path of~/.ansible/collections/ansible_collections/network/offline_migration_sdn_to_ovnk/.Configure rollback features in the
playbooks/playbook-migration.ymlfile:# ... rollback_disable_auto_migration: true rollback_egress_ip: false rollback_egress_firewall: false rollback_multicast: false rollback_mtu: 1400 rollback_vxlanPort: 4790 # ...rollback_disable_auto_migration-
Disables the auto-migration of OVN-Kubernetes plug-in features to the OpenShift SDN CNI plug-in. If you disable auto-migration of features, you must also set the
rollback_egress_ip,rollback_egress_firewall, androllback_multicastparameters tofalse. If you need to enable auto-migration of features, set the parameter tofalse. rollback_mtu- Optional parameter that sets a specific maximum transmission unit (MTU) to your cluster network after the migration process.
rollback_vxlanPort-
Optional parameter that sets a VXLAN (Virtual Extensible LAN) port for use by OpenShift SDN CNI plug-in. The default value for the parameter is
4790.
To run the
playbooks/playbook-rollback.ymlfile, enter the following command:$ ansible-playbook -v playbooks/playbook-rollback.yml
19.6.3. Using the limited live migration method to roll back to the OpenShift SDN network plugin
As a cluster administrator, you can roll back to the OpenShift SDN Container Network Interface (CNI) network plugin by using the limited live migration method. During the migration with this method, nodes are automatically rebooted and service to the cluster is not interrupted.
You must wait until the migration process from OpenShift SDN to OVN-Kubernetes network plugin is successful before initiating a rollback.
If a rollback to OpenShift SDN is required, the following table describes the process.
| User-initiated steps | Migration activity |
|---|---|
|
Patch the cluster-level networking configuration by changing the |
|
Prerequisites
-
The OpenShift CLI (
oc) is installed. - Access to the cluster as a user with the cluster-admin role is available.
- The cluster is installed on infrastructure configured with the OVN-Kubernetes network plugin.
- A recent backup of the etcd database is available.
- A manual reboot can be triggered for each node.
- The cluster is in a known good state, without any errors.
Procedure
To initiate the rollback to OpenShift SDN, enter the following command:
$ oc patch Network.config.openshift.io cluster --type='merge' --patch '{"metadata":{"annotations":{"network.openshift.io/network-type-migration":""}},"spec":{"networkType":"OpenShiftSDN"}}'To watch the progress of your migration, enter the following command:
$ watch -n1 'oc get network.config/cluster -o json | jq ".status.conditions[]|\"\\(.type) \\(.status) \\(.reason) \\(.message)\"" -r | column --table --table-columns NAME,STATUS,REASON,MESSAGE --table-columns-limit 4; echo; oc get mcp -o wide; echo; oc get node -o "custom-columns=NAME:metadata.name,STATE:metadata.annotations.machineconfiguration\\.openshift\\.io/state,DESIRED:metadata.annotations.machineconfiguration\\.openshift\\.io/desiredConfig,CURRENT:metadata.annotations.machineconfiguration\\.openshift\\.io/currentConfig,REASON:metadata.annotations.machineconfiguration\\.openshift\\.io/reason"'The command prints the following information every second:
-
The conditions on the status of the
network.config.openshift.io/clusterobject, reporting the progress of the migration. -
The status of different nodes with respect to the
machine-config-operatorresource, including whether they are upgrading or have been upgraded, as well as their current and desired configurations.
-
The conditions on the status of the
Complete the following steps only if the migration succeeds and your cluster is in a good state:
Remove the
network.openshift.io/network-type-migration=annotation from thenetwork.configcustom resource by entering the following command:$ oc annotate network.config cluster network.openshift.io/network-type-migration-Remove the OVN-Kubernetes network provider namespace by entering the following command:
$ oc delete namespace openshift-ovn-kubernetes
19.7. Converting to IPv4/IPv6 dual-stack networking
As a cluster administrator, you can convert your IPv4 single-stack cluster to a dual-network cluster network that supports IPv4 and IPv6 address families. After converting to dual-stack networking, new and existing pods have dual-stack networking enabled.
When using dual-stack networking where IPv6 is required, you cannot use IPv4-mapped IPv6 addresses, such as ::FFFF:198.51.100.1.
19.7.1. Converting to a dual-stack cluster network
As a cluster administrator, you can convert your single-stack cluster network to a dual-stack cluster network.
After converting your cluster to use dual-stack networking, you must re-create any existing pods for them to receive IPv6 addresses, because only new pods are assigned IPv6 addresses.
Converting a single-stack cluster network to a dual-stack cluster network consists of creating patches and applying them to the network and infrastructure of the cluster. You can convert to a dual-stack cluster network for a cluster that runs on either installer-provisioned infrastructure or user-provisioned infrastructure.
Each patch operation that changes clusterNetwork, serviceNetwork, apiServerInternalIPs, and ingressIP objects triggers a restart of the cluster. Changing the MachineNetworks object does not cause a reboot of the cluster.
On installer-provisioned infrastructure only, if you need to add IPv6 virtual IPs (VIPs) for API and Ingress services to an existing dual-stack-configured cluster, you need to patch only the infrastructure and not the network for the cluster.
If you already upgraded your cluster to OpenShift Container Platform 4.16 or later and you need to convert the single-stack cluster network to a dual-stack cluster network, you must specify an existing IPv4 machineNetwork network configuration from the install-config.yaml file for API and Ingress services in the YAML configuration patch file. This configuration ensures that IPv4 traffic exists in the same network interface as the default gateway.
Example YAML configuration file with an added IPv4 address block for the machineNetwork network
- op: add
path: /spec/platformSpec/baremetal/machineNetworks/-
value: 192.168.1.0/24
# ...- 1
- Ensure that you specify an address block for the
machineNetworknetwork where your machines operate. You must select both API and Ingress IP addresses for the machine network.
Prerequisites
-
You installed the OpenShift CLI (
oc). -
You are logged in to the cluster with a user with
cluster-adminprivileges. - Your cluster uses the OVN-Kubernetes network plugin.
- The cluster nodes have IPv6 addresses.
- You have configured an IPv6-enabled router based on your infrastructure.
Procedure
To specify IPv6 address blocks for cluster and service networks, create a YAML configuration patch file that has a similar configuration to the following example:
- op: add path: /spec/clusterNetwork/- value:1 cidr: fd01::/48 hostPrefix: 64 - op: add path: /spec/serviceNetwork/- value: fd02::/1122 - 1
- Specify an object with the
cidrandhostPrefixparameters. The host prefix must be64or greater. The IPv6 Classless Inter-Domain Routing (CIDR) prefix must be large enough to accommodate the specified host prefix. - 2
- Specify an IPv6 CIDR with a prefix of
112. Kubernetes uses only the lowest 16 bits. For a prefix of112, IP addresses are assigned from112to128bits.
Patch the cluster network configuration by entering the following command in your CLI:
$ oc patch network.config.openshift.io cluster \1 --type='json' --patch-file <file>.yaml- 1
- Where
filespecifies the name of your created YAML file.
Example output
network.config.openshift.io/cluster patchedOn installer-provisioned infrastructure where you added IPv6 VIPs for API and Ingress services, complete the following steps:
Specify IPv6 VIPs for API and Ingress services for your cluster. Create a YAML configuration patch file that has a similar configuration to the following example:
- op: add path: /spec/platformSpec/baremetal/machineNetworks/-1 value: fd2e:6f44:5dd8::/64 - op: add path: /spec/platformSpec/baremetal/apiServerInternalIPs/-2 value: fd2e:6f44:5dd8::4 - op: add path: /spec/platformSpec/baremetal/ingressIPs/- value: fd2e:6f44:5dd8::5- 1
- Ensure that you specify an address block for the
machineNetworknetwork where your machines operate. You must select both API and Ingress IP addresses for the machine network. - 2
- Ensure that you specify each file path according to your platform. The example demonstrates a file path on a bare-metal platform.
Patch the infrastructure by entering the following command in your CLI:
$ oc patch infrastructure cluster \ --type='json' --patch-file <file>.yamlWhere:
- <file>
Specifies the name of your created YAML file.
Example output
infrastructure/cluster patched
Verification
Show the cluster network configuration by entering the following command in your CLI:
$ oc describe networkVerify the successful installation of the patch on the network configuration by checking that the cluster network configuration recognizes the IPv6 address blocks that you specified in the YAML file.
Example output
# ... Status: Cluster Network: Cidr: 10.128.0.0/14 Host Prefix: 23 Cidr: fd01::/48 Host Prefix: 64 Cluster Network MTU: 1400 Network Type: OVNKubernetes Service Network: 172.30.0.0/16 fd02::/112 # ...Complete the following additional tasks for a cluster that runs on installer-provisioned infrastructure:
Show the cluster infrastructure configuration by entering the following command in your CLI:
$ oc describe infrastructureVerify the successful installation of the patch on the cluster infrastructure by checking that the infrastructure recognizes the IPv6 address blocks that you specified in the YAML file.
Example output
# ... spec: # ... platformSpec: baremetal: apiServerInternalIPs: - 192.168.123.5 - fd2e:6f44:5dd8::4 ingressIPs: - 192.168.123.10 - fd2e:6f44:5dd8::5 status: # ... platformStatus: baremetal: apiServerInternalIP: 192.168.123.5 apiServerInternalIPs: - 192.168.123.5 - fd2e:6f44:5dd8::4 ingressIP: 192.168.123.10 ingressIPs: - 192.168.123.10 - fd2e:6f44:5dd8::5 # ...
19.7.2. Converting to a single-stack cluster network
As a cluster administrator, you can convert your dual-stack cluster network to a single-stack cluster network.
If you originally converted your IPv4 single-stack cluster network to a dual-stack cluster, you can convert only back to the IPv4 single-stack cluster and not an IPv6 single-stack cluster network. The same restriction applies for converting back to an IPv6 single-stack cluster network.
Prerequisites
-
You installed the OpenShift CLI (
oc). -
You are logged in to the cluster with a user with
cluster-adminprivileges. - Your cluster uses the OVN-Kubernetes network plugin.
- The cluster nodes have IPv6 addresses.
- You have enabled dual-stack networking.
Procedure
Edit the
networks.config.openshift.iocustom resource (CR) by running the following command:$ oc edit networks.config.openshift.io-
Remove the IPv4 or IPv6 configuration that you added to the
cidrand thehostPrefixparameters from completing the "Converting to a dual-stack cluster network " procedure steps.
19.8. Configuring OVN-Kubernetes internal IP address subnets
As a cluster administrator, you can change the IP address ranges that the OVN-Kubernetes network plugin uses for the join and transit subnets.
19.8.1. Configuring the OVN-Kubernetes join subnet
You can change the join subnet used by OVN-Kubernetes to avoid conflicting with any existing subnets already in use in your environment.
Prerequisites
-
Install the OpenShift CLI (
oc). -
Log in to the cluster with a user with
cluster-adminprivileges. - Ensure that the cluster uses the OVN-Kubernetes network plugin.
Procedure
To change the OVN-Kubernetes join subnet, enter the following command:
$ oc patch network.operator.openshift.io cluster --type='merge' \ -p='{"spec":{"defaultNetwork":{"ovnKubernetesConfig": {"ipv4":{"internalJoinSubnet": "<join_subnet>"}, "ipv6":{"internalJoinSubnet": "<join_subnet>"}}}}}'where:
<join_subnet>-
Specifies an IP address subnet for internal use by OVN-Kubernetes. The subnet must be larger than the number of nodes in the cluster and it must be large enough to accommodate one IP address per node in the cluster. This subnet cannot overlap with any other subnets used by OpenShift Container Platform or on the host itself. The default value for IPv4 is
100.64.0.0/16and the default value for IPv6 isfd98::/64.
Example output
network.operator.openshift.io/cluster patched
Verification
To confirm that the configuration is active, enter the following command:
$ oc get network.operator.openshift.io \ -o jsonpath="{.items[0].spec.defaultNetwork}"The command operation can take up to 30 minutes for this change to take effect.
Example output
{ "ovnKubernetesConfig": { "ipv4": { "internalJoinSubnet": "100.64.1.0/16" }, }, "type": "OVNKubernetes" }
19.8.2. Configuring the OVN-Kubernetes transit subnet
You can change the transit subnet used by OVN-Kubernetes to avoid conflicting with any existing subnets already in use in your environment.
Prerequisites
-
Install the OpenShift CLI (
oc). -
Log in to the cluster with a user with
cluster-adminprivileges. - Ensure that the cluster uses the OVN-Kubernetes network plugin.
Procedure
To change the OVN-Kubernetes transit subnet, enter the following command:
$ oc patch network.operator.openshift.io cluster --type='merge' \ -p='{"spec":{"defaultNetwork":{"ovnKubernetesConfig": {"ipv4":{"internalTransitSwitchSubnet": "<transit_subnet>"}, "ipv6":{"internalTransitSwitchSubnet": "<transit_subnet>"}}}}}'where:
<transit_subnet>-
Specifies an IP address subnet for the distributed transit switch that enables east-west traffic. This subnet cannot overlap with any other subnets used by OVN-Kubernetes or on the host itself. The default value for IPv4 is
100.88.0.0/16and the default value for IPv6 isfd97::/64.
Example output
network.operator.openshift.io/cluster patched
Verification
To confirm that the configuration is active, enter the following command:
$ oc get network.operator.openshift.io \ -o jsonpath="{.items[0].spec.defaultNetwork}"It can take up to 30 minutes for this change to take effect.
Example output
{ "ovnKubernetesConfig": { "ipv4": { "internalTransitSwitchSubnet": "100.88.1.0/16" }, }, "type": "OVNKubernetes" }
19.9. Configuring a gateway
As a cluster administrator you can configure the gatewayConfig object to manage how external traffic leaves the cluster. You do so by setting the routingViaHost parameter to one of the following values:
-
truemeans that egress traffic routes through a specific local gateway on the node that hosts the pod. Egress traffic routes through the host and this traffic applies to the routing table of the host. -
falsemeans that egress traffic routes through a dedicated node but a group of nodes share the same gateway. Egress traffic does not route through the host. The Open vSwitch (OVS) outputs traffic directly to the node IP interface.
19.9.1. Configuring egress routing policies
As a cluster administrator you can configure egress routing policies by using the gatewayConfig specification in the Cluster Network Operator (CNO). You can use the following procedure to set the routingViaHost field to true or false.
You can follow the optional step in the procedure to enable IP forwarding alongside the routingViaHost=true configuration if you need the host network of the node to act as a router for traffic not related to OVN-Kubernetes. For example, possible use cases for combining local gateway with IP forwarding include:
- Configuring all pod egress traffic to be forwarded via the node’s IP
- Integrating OVN-Kubernetes CNI with external network address translation (NAT) devices
- Configuring OVN-Kubernetes CNI to use a kernel routing table
Prerequisites
- You are logged in as a user with admin privileges.
Procedure
Back up the existing network configuration by running the following command:
$ oc get network.operator cluster -o yaml > network-config-backup.yamlSet the
routingViaHostparameter totrueby entering the following command. Egress traffic then gets routed through a specific gateway according to the routes that you configured on the node.$ oc patch networks.operator.openshift.io cluster --type=merge -p '{"spec":{"defaultNetwork":{"ovnKubernetesConfig":{"gatewayConfig":{"routingViaHost": true}}}}}'Verify the correct application of the
routingViaHost=trueconfiguration by running the following command:$ oc get networks.operator.openshift.io cluster -o yaml | grep -A 5 "gatewayConfig"Example output
apiVersion: operator.openshift.io/v1 kind: Network metadata: name: cluster # ... gatewayConfig: ipv4: {} ipv6: {} routingViaHost: true1 genevePort: 6081 ipsecConfig: # ...- 1
- A value of
truemeans that egress traffic gets routed through a specific local gateway on the node that hosts the pod. A value offalsefor the parameter means that a group of nodes share a single gateway so traffic does not get routed through a single host.
Optional: Enable IP forwarding globally by running the following command:
$ oc patch network.operator cluster --type=merge -p '{"spec":{"defaultNetwork":{"ovnKubernetesConfig":{"gatewayConfig":{"ipForwarding": "Global"}}}}}'Verify that the
ipForwardingspec has been set toGlobalby running the following command:$ oc get networks.operator.openshift.io cluster -o yaml | grep -A 5 "gatewayConfig"Example output
apiVersion: operator.openshift.io/v1 kind: Network metadata: name: cluster # ... gatewayConfig: ipForwarding: Global ipv4: {} ipv6: {} routingViaHost: true genevePort: 6081 # ...
19.10. Configure an external gateway on the default network
As a cluster administrator, you can configure an external gateway on the default network.
This feature offers the following benefits:
- Granular control over egress traffic on a per-namespace basis
- Flexible configuration of static and dynamic external gateway IP addresses
- Support for both IPv4 and IPv6 address families
19.10.1. Prerequisites
- Your cluster uses the OVN-Kubernetes network plugin.
- Your infrastructure is configured to route traffic from the secondary external gateway.
19.10.2. How OpenShift Container Platform determines the external gateway IP address
You configure a secondary external gateway with the AdminPolicyBasedExternalRoute custom resource (CR) from the k8s.ovn.org API group. The CR supports static and dynamic approaches to specifying an external gateway’s IP address.
Each namespace that a AdminPolicyBasedExternalRoute CR targets cannot be selected by any other AdminPolicyBasedExternalRoute CR. A namespace cannot have concurrent secondary external gateways.
Changes to policies are isolated in the controller. If a policy fails to apply, changes to other policies do not trigger a retry of other policies. Policies are only re-evaluated, applying any differences that might have occurred by the change, when updates to the policy itself or related objects to the policy such as target namespaces, pod gateways, or namespaces hosting them from dynamic hops are made.
- Static assignment
- You specify an IP address directly.
- Dynamic assignment
You specify an IP address indirectly, with namespace and pod selectors, and an optional network attachment definition.
- If the name of a network attachment definition is provided, the external gateway IP address of the network attachment is used.
-
If the name of a network attachment definition is not provided, the external gateway IP address for the pod itself is used. However, this approach works only if the pod is configured with
hostNetworkset totrue.
19.10.3. AdminPolicyBasedExternalRoute object configuration
You can define an AdminPolicyBasedExternalRoute object, which is cluster scoped, with the following properties. A namespace can be selected by only one AdminPolicyBasedExternalRoute CR at a time.
| Field | Type | Description |
|---|---|---|
|
|
|
Specifies the name of the |
|
|
|
Specifies a namespace selector that the routing polices apply to. Only
A namespace can only be targeted by one |
|
|
|
Specifies the destinations where the packets are forwarded to. Must be either or both of |
| Field | Type | Description |
|---|---|---|
|
|
| Specifies an array of static IP addresses. |
|
|
| Specifies an array of pod selectors corresponding to pods configured with a network attachment definition to use as the external gateway target. |
| Field | Type | Description |
|---|---|---|
|
|
| Specifies either an IPv4 or IPv6 address of the next destination hop. |
|
|
|
Optional: Specifies whether Bi-Directional Forwarding Detection (BFD) is supported by the network. The default value is |
| Field | Type | Description |
|---|---|---|
|
|
| Specifies a [set-based](https://kubernetes.io/docs/concepts/overview/working-with-objects/labels/#set-based-requirement) label selector to filter the pods in the namespace that match this network configuration. |
|
|
|
Specifies a |
|
|
|
Optional: Specifies whether Bi-Directional Forwarding Detection (BFD) is supported by the network. The default value is |
|
|
| Optional: Specifies the name of a network attachment definition. The name must match the list of logical networks associated with the pod. If this field is not specified, the host network of the pod is used. However, the pod must be configure as a host network pod to use the host network. |
19.10.3.1. Example secondary external gateway configurations
In the following example, the AdminPolicyBasedExternalRoute object configures two static IP addresses as external gateways for pods in namespaces with the kubernetes.io/metadata.name: novxlan-externalgw-ecmp-4059 label.
apiVersion: k8s.ovn.org/v1
kind: AdminPolicyBasedExternalRoute
metadata:
name: default-route-policy
spec:
from:
namespaceSelector:
matchLabels:
kubernetes.io/metadata.name: novxlan-externalgw-ecmp-4059
nextHops:
static:
- ip: "172.18.0.8"
- ip: "172.18.0.9"
In the following example, the AdminPolicyBasedExternalRoute object configures a dynamic external gateway. The IP addresses used for the external gateway are derived from the additional network attachments associated with each of the selected pods.
apiVersion: k8s.ovn.org/v1
kind: AdminPolicyBasedExternalRoute
metadata:
name: shadow-traffic-policy
spec:
from:
namespaceSelector:
matchLabels:
externalTraffic: ""
nextHops:
dynamic:
- podSelector:
matchLabels:
gatewayPod: ""
namespaceSelector:
matchLabels:
shadowTraffic: ""
networkAttachmentName: shadow-gateway
- podSelector:
matchLabels:
gigabyteGW: ""
namespaceSelector:
matchLabels:
gatewayNamespace: ""
networkAttachmentName: gateway
In the following example, the AdminPolicyBasedExternalRoute object configures both static and dynamic external gateways.
apiVersion: k8s.ovn.org/v1
kind: AdminPolicyBasedExternalRoute
metadata:
name: multi-hop-policy
spec:
from:
namespaceSelector:
matchLabels:
trafficType: "egress"
nextHops:
static:
- ip: "172.18.0.8"
- ip: "172.18.0.9"
dynamic:
- podSelector:
matchLabels:
gatewayPod: ""
namespaceSelector:
matchLabels:
egressTraffic: ""
networkAttachmentName: gigabyte19.10.4. Configure a secondary external gateway
You can configure an external gateway on the default network for a namespace in your cluster.
Prerequisites
-
You installed the OpenShift CLI (
oc). -
You are logged in to the cluster with a user with
cluster-adminprivileges.
Procedure
-
Create a YAML file that contains an
AdminPolicyBasedExternalRouteobject. To create an admin policy based external route, enter the following command:
$ oc create -f <file>.yamlwhere:
<file>- Specifies the name of the YAML file that you created in the previous step.
Example output
adminpolicybasedexternalroute.k8s.ovn.org/default-route-policy createdTo confirm that the admin policy based external route was created, enter the following command:
$ oc describe apbexternalroute <name> | tail -n 6where:
<name>-
Specifies the name of the
AdminPolicyBasedExternalRouteobject.
Example output
Status: Last Transition Time: 2023-04-24T15:09:01Z Messages: Configured external gateway IPs: 172.18.0.8 Status: Success Events: <none>
19.10.5. Additional resources
19.11. Configuring an egress IP address
As a cluster administrator, you can configure the OVN-Kubernetes Container Network Interface (CNI) network plugin to assign one or more egress IP addresses to a namespace, or to specific pods in a namespace.
Configuring egress IPs is not supported for ROSA with HCP clusters at this time.
19.11.1. Egress IP address architectural design and implementation
By using the OpenShift Container Platform egress IP address functionality, you can ensure that the traffic from one or more pods in one or more namespaces has a consistent source IP address for services outside the cluster network.
For example, you might have a pod that periodically queries a database that is hosted on a server outside of your cluster. To enforce access requirements for the server, a packet filtering device is configured to allow traffic only from specific IP addresses. To ensure that you can reliably allow access to the server from only that specific pod, you can configure a specific egress IP address for the pod that makes the requests to the server.
An egress IP address assigned to a namespace is different from an egress router, which is used to send traffic to specific destinations.
In some cluster configurations, application pods and ingress router pods run on the same node. If you configure an egress IP address for an application project in this scenario, the IP address is not used when you send a request to a route from the application project.
Egress IP addresses must not be configured in any Linux network configuration files, such as ifcfg-eth0.
19.11.1.1. Platform support
The Egress IP address feature that runs on a primary host network is supported on the following platforms:
| Platform | Supported |
|---|---|
| Bare metal | Yes |
| VMware vSphere | Yes |
| Red Hat OpenStack Platform (RHOSP) | Yes |
| Amazon Web Services (AWS) | Yes |
| Google Cloud | Yes |
| Microsoft Azure | Yes |
| IBM Z® and IBM® LinuxONE | Yes |
| IBM Z® and IBM® LinuxONE for Red Hat Enterprise Linux (RHEL) KVM | Yes |
| IBM Power® | Yes |
| Nutanix | Yes |
The Egress IP address feature that runs on secondary host networks is supported on the following platform:
| Platform | Supported |
|---|---|
| Bare metal | Yes |
The assignment of egress IP addresses to control plane nodes with the EgressIP feature is not supported on a cluster provisioned on Amazon Web Services (AWS). (BZ#2039656).
19.11.1.2. Public cloud platform considerations
Typically, public cloud providers place a limit on egress IPs. This means that there is a constraint on the absolute number of assignable IP addresses per node for clusters provisioned on public cloud infrastructure. The maximum number of assignable IP addresses per node, or the IP capacity, can be described in the following formula:
IP capacity = public cloud default capacity - sum(current IP assignments)While the Egress IPs capability manages the IP address capacity per node, it is important to plan for this constraint in your deployments. For example, if a public cloud provider limits IP address capacity to 10 IP addresses per node, and you have 8 nodes, the total number of assignable IP addresses is only 80. To achieve a higher IP address capacity, you would need to allocate additional nodes. For example, if you needed 150 assignable IP addresses, you would need to allocate 7 additional nodes.
To confirm the IP capacity and subnets for any node in your public cloud environment, you can enter the oc get node <node_name> -o yaml command. The cloud.network.openshift.io/egress-ipconfig annotation includes capacity and subnet information for the node.
The annotation value is an array with a single object with fields that provide the following information for the primary network interface:
-
interface: Specifies the interface ID on AWS and Azure and the interface name on Google Cloud. -
ifaddr: Specifies the subnet mask for one or both IP address families. -
capacity: Specifies the IP address capacity for the node. On AWS, the IP address capacity is provided per IP address family. On Azure and Google Cloud, the IP address capacity includes both IPv4 and IPv6 addresses.
Automatic attachment and detachment of egress IP addresses for traffic between nodes are available. This allows for traffic from many pods in namespaces to have a consistent source IP address to locations outside of the cluster. This also supports OpenShift SDN and OVN-Kubernetes, which is the default networking plugin in Red Hat OpenShift Networking in OpenShift Container Platform 4.16.
The RHOSP egress IP address feature creates a Neutron reservation port called egressip-<IP address>. Using the same RHOSP user as the one used for the OpenShift Container Platform cluster installation, you can assign a floating IP address to this reservation port to have a predictable SNAT address for egress traffic. When an egress IP address on an RHOSP network is moved from one node to another, because of a node failover, for example, the Neutron reservation port is removed and recreated. This means that the floating IP association is lost and you need to manually reassign the floating IP address to the new reservation port.
When an RHOSP cluster administrator assigns a floating IP to the reservation port, OpenShift Container Platform cannot delete the reservation port. The CloudPrivateIPConfig object cannot perform delete and move operations until an RHOSP cluster administrator unassigns the floating IP from the reservation port.
The following examples illustrate the annotation from nodes on several public cloud providers. The annotations are indented for readability.
Example cloud.network.openshift.io/egress-ipconfig annotation on AWS
cloud.network.openshift.io/egress-ipconfig: [
{
"interface":"eni-078d267045138e436",
"ifaddr":{"ipv4":"10.0.128.0/18"},
"capacity":{"ipv4":14,"ipv6":15}
}
]Example cloud.network.openshift.io/egress-ipconfig annotation on Google Cloud
cloud.network.openshift.io/egress-ipconfig: [
{
"interface":"nic0",
"ifaddr":{"ipv4":"10.0.128.0/18"},
"capacity":{"ip":14}
}
]The following sections describe the IP address capacity for supported public cloud environments for use in your capacity calculation.
19.11.1.2.1. Amazon Web Services (AWS) IP address capacity limits
On AWS, constraints on IP address assignments depend on the instance type configured. For more information, see IP addresses per network interface per instance type
19.11.1.2.2. Google Cloud IP address capacity limits
On Google Cloud, the networking model implements additional node IP addresses through IP address aliasing, rather than IP address assignments. However, IP address capacity maps directly to IP aliasing capacity.
The following capacity limits exist for IP aliasing assignment:
- Per node, the maximum number of IP aliases, both IPv4 and IPv6, is 100.
- Per VPC, the maximum number of IP aliases is unspecified, but OpenShift Container Platform scalability testing reveals the maximum to be approximately 15,000.
For more information, see Per instance quotas and Alias IP ranges overview.
19.11.1.2.3. Microsoft Azure IP address capacity limits
On Azure, the following capacity limits exist for IP address assignment:
- Per NIC, the maximum number of assignable IP addresses, for both IPv4 and IPv6, is 256.
- Per virtual network, the maximum number of assigned IP addresses cannot exceed 65,536.
For more information, see Networking limits.
19.11.1.3. Considerations for using an egress IP on additional network interfaces
In OpenShift Container Platform, egress IPs provide administrators a way to control network traffic. Egress IPs can be used with a br-ex Open vSwitch (OVS) bridge interface and any physical interface that has IP connectivity enabled.
You can inspect your network interface type by running the following command:
$ ip -details link show
The primary network interface is assigned a node IP address which also contains a subnet mask. Information for this node IP address can be retrieved from the Kubernetes node object for each node within your cluster by inspecting the k8s.ovn.org/node-primary-ifaddr annotation. In an IPv4 cluster, this annotation is similar to the following example: "k8s.ovn.org/node-primary-ifaddr: {"ipv4":"192.168.111.23/24"}".
If the egress IP is not within the subnet of the primary network interface subnet, you can use an egress IP on another Linux network interface that is not of the primary network interface type. By doing so, OpenShift Container Platform administrators are provided with a greater level of control over networking aspects such as routing, addressing, segmentation, and security policies. This feature provides users with the option to route workload traffic over specific network interfaces for purposes such as traffic segmentation or meeting specialized requirements.
If the egress IP is not within the subnet of the primary network interface, then the selection of another network interface for egress traffic might occur if they are present on a node.
You can determine which other network interfaces might support egress IPs by inspecting the k8s.ovn.org/host-cidrs Kubernetes node annotation. This annotation contains the addresses and subnet mask found for the primary network interface. It also contains additional network interface addresses and subnet mask information. These addresses and subnet masks are assigned to network interfaces that use the longest prefix match routing mechanism to determine which network interface supports the egress IP.
OVN-Kubernetes provides a mechanism to control and direct outbound network traffic from specific namespaces and pods. This ensures that it exits the cluster through a particular network interface and with a specific egress IP address.
19.11.1.3.1. Requirements for assigning an egress IP to a network interface that is not the primary network interface
For users who want an egress IP and traffic to be routed over a particular interface that is not the primary network interface, the following conditions must be met:
- OpenShift Container Platform is installed on a bare-metal cluster. This feature is disabled within a cloud or a hypervisor environment.
- Your OpenShift Container Platform pods are not configured as host-networked.
- If a network interface is removed or if the IP address and subnet mask which allows the egress IP to be hosted on the interface is removed, the egress IP is reconfigured. Consequently, the egress IP could be assigned to another node and interface.
- If you use an Egress IP address on a secondary network interface card (NIC), you must use the Node Tuning Operator to enable IP forwarding on the secondary NIC.
19.11.1.4. Assignment of egress IPs to pods
To assign one or more egress IPs to a namespace or specific pods in a namespace, the following conditions must be satisfied:
-
At least one node in your cluster must have the
k8s.ovn.org/egress-assignable: ""label. -
An
EgressIPobject exists that defines one or more egress IP addresses to use as the source IP address for traffic leaving the cluster from pods in a namespace.
If you create EgressIP objects prior to labeling any nodes in your cluster for egress IP assignment, OpenShift Container Platform might assign every egress IP address to the first node with the k8s.ovn.org/egress-assignable: "" label.
To ensure that egress IP addresses are widely distributed across nodes in the cluster, always apply the label to the nodes you intent to host the egress IP addresses before creating any EgressIP objects.
19.11.1.5. Assignment of egress IPs to nodes
When creating an EgressIP object, the following conditions apply to nodes that are labeled with the k8s.ovn.org/egress-assignable: "" label:
- An egress IP address is never assigned to more than one node at a time.
- An egress IP address is equally balanced between available nodes that can host the egress IP address.
If the
spec.EgressIPsarray in anEgressIPobject specifies more than one IP address, the following conditions apply:- No node will ever host more than one of the specified IP addresses.
- Traffic is balanced roughly equally between the specified IP addresses for a given namespace.
- If a node becomes unavailable, any egress IP addresses assigned to it are automatically reassigned, subject to the previously described conditions.
When a pod matches the selector for multiple EgressIP objects, there is no guarantee which of the egress IP addresses that are specified in the EgressIP objects is assigned as the egress IP address for the pod.
Additionally, if an EgressIP object specifies multiple egress IP addresses, there is no guarantee which of the egress IP addresses might be used. For example, if a pod matches a selector for an EgressIP object with two egress IP addresses, 10.10.20.1 and 10.10.20.2, either might be used for each TCP connection or UDP conversation.
19.11.1.6. Architectural diagram of an egress IP address configuration
The following diagram depicts an egress IP address configuration. The diagram describes four pods in two different namespaces running on three nodes in a cluster. The nodes are assigned IP addresses from the 192.168.126.0/18 CIDR block on the host network.
Both Node 1 and Node 3 are labeled with k8s.ovn.org/egress-assignable: "" and thus available for the assignment of egress IP addresses.
The dashed lines in the diagram depict the traffic flow from pod1, pod2, and pod3 traveling through the pod network to egress the cluster from Node 1 and Node 3. When an external service receives traffic from any of the pods selected by the example EgressIP object, the source IP address is either 192.168.126.10 or 192.168.126.102. The traffic is balanced roughly equally between these two nodes.
The following resources from the diagram are illustrated in detail:
NamespaceobjectsThe namespaces are defined in the following manifest:
Namespace objects
apiVersion: v1 kind: Namespace metadata: name: namespace1 labels: env: prod --- apiVersion: v1 kind: Namespace metadata: name: namespace2 labels: env: prodEgressIPobjectThe following
EgressIPobject describes a configuration that selects all pods in any namespace with theenvlabel set toprod. The egress IP addresses for the selected pods are192.168.126.10and192.168.126.102.EgressIPobjectapiVersion: k8s.ovn.org/v1 kind: EgressIP metadata: name: egressips-prod spec: egressIPs: - 192.168.126.10 - 192.168.126.102 namespaceSelector: matchLabels: env: prod status: items: - node: node1 egressIP: 192.168.126.10 - node: node3 egressIP: 192.168.126.102For the configuration in the previous example, OpenShift Container Platform assigns both egress IP addresses to the available nodes. The
statusfield reflects whether and where the egress IP addresses are assigned.
19.11.2. EgressIP object
View the following YAML files to better understand how you can effectively configure an EgressIP object to better meet your needs.
When the EgressIP namespace selector matches the label on multiple namespaces, consider the following behaviors:
- All traffic for selected pods must pass through a single node. During times of high traffic, the network interface of the node might experience performance issues.
- An error in a label selector might change the outbound IP address for many cluster namespaces.
- Only a cluster administrator can create or change cluster-scoped objects.
-
Packets must move from a pod that exists in a node to the named host node that is referenced in the
EgressIPobject. This approach adds a network hop.
Do not create egress rules, such as a single label selector, that forces all namespaces that exist in a cluster to use the same outbound IP address. This configuration can cause the node that hosts the IP address to crash during times of high network traffic.
apiVersion: k8s.ovn.org/v1
kind: EgressIP
metadata:
name: <name>
spec:
egressIPs:
- <ip_address>
namespaceSelector:
...
podSelector:
...- 1
- The name for the
EgressIPsobject. - 2
- An array of one or more IP addresses.
- 3
- One or more selectors for the namespaces to associate the egress IP addresses with.
- 4
- Optional: One or more selectors for pods in the specified namespaces to associate egress IP addresses with. Applying these selectors allows for the selection of a subset of pods within a namespace.
The following YAML describes the stanza for the namespace selector:
Namespace selector stanza
namespaceSelector:
matchLabels:
<label_name>: <label_value>- 1
- One or more matching rules for namespaces. If more than one match rule is provided, all matching namespaces are selected.
The following YAML describes the optional stanza for the pod selector:
Pod selector stanza
podSelector:
matchLabels:
<label_name>: <label_value>- 1
- Optional: One or more matching rules for pods in the namespaces that match the specified
namespaceSelectorrules. If specified, only pods that match are selected. Others pods in the namespace are not selected.
In the following example, the EgressIP object associates the 192.168.126.11 and 192.168.126.102 egress IP addresses with pods that have the app label set to web and are in the namespaces that have the env label set to prod:
Example EgressIP object
apiVersion: k8s.ovn.org/v1
kind: EgressIP
metadata:
name: egress-group1
spec:
egressIPs:
- 192.168.126.11
- 192.168.126.102
podSelector:
matchLabels:
app: web
namespaceSelector:
matchLabels:
env: prod
In the following example, the EgressIP object associates the 192.168.127.30 and 192.168.127.40 egress IP addresses with any pods that do not have the environment label set to development:
Example EgressIP object
apiVersion: k8s.ovn.org/v1
kind: EgressIP
metadata:
name: egress-group2
spec:
egressIPs:
- 192.168.127.30
- 192.168.127.40
namespaceSelector:
matchExpressions:
- key: environment
operator: NotIn
values:
- development19.11.3. Configuring dual-stack networking for an EgressIP object
For a cluster configured for dual-stack networking, you can apply dual-stack networking to a single EgressIP object. The EgressIP object can then extend dual-stack networking capabilities to a pod.
Red Hat does not support creating two EgressIP objects to represent dual-stack networking capabilities. For example, specifying IPv4 addresses with one object and using another object to specify IPv6 addresses. This configuration limit impacts address-type assignments to pods.
Prerequisites
-
You created two egress nodes so that an
EgressIPobject can allocate IPv4 addresses to one node and IPv6 addresses to the other node. For more information, see "Assignment of egress IP addresses to nodes".
Procedure
Create an
EgressIPobject and configure IPv4 and IPv6 addresses for the object. The following exampleEgressIPobject uses selectors to identify which pods use the specified egress IP addresses for their outbound traffic:kind: EgressIP metadata: name: egressip-dual spec: egressIPs: - 192.168.118.30 - 2600:52:7:94::30 namespaceSelector: matchLabels: env: qa podSelector: matchLabels: egressip: ds # ...
Verification
Create a
Podmanifest file to test and validate yourEgressIPobject. The pod serves as a client workload that sends outbound traffic to verify that yourEgressIPpolicy works as expected.apiVersion: v1 kind: Pod metadata: name: ubi-egressip-pod namespace: test labels: egressip: ds spec: containers: - name: fedora-curl image: registry.redhat.io/ubi9/ubi command: ["/bin/bash", "-c", "sleep infinity"] # ...where:
<labels>-
Sets custom identifiers so that the
EgressIPobject can use these labels to apply egress IP address to target pods.
Run a
curlrequest from inside a pod to an external server. This action verifies that outbound traffic correctly uses an address that you specified in theEgressIPobject.$ curl <ipv_address>where:
<ipv_address>-
Depending on the
EgressIPobject, enter an IPv4 or IPv6 address.
19.11.4. The egressIPConfig object
As a feature of egress IP, the reachabilityTotalTimeoutSeconds parameter configures the EgressIP node reachability check total timeout in seconds. If the EgressIP node cannot be reached within this timeout, the node is declared down.
You can set a value for the reachabilityTotalTimeoutSeconds in the configuration file for the egressIPConfig object. Setting a large value might cause the EgressIP implementation to react slowly to node changes. The implementation reacts slowly for EgressIP nodes that have an issue and are unreachable.
If you omit the reachabilityTotalTimeoutSeconds parameter from the egressIPConfig object, the platform chooses a reasonable default value, which is subject to change over time. The current default is 1 second. A value of 0 disables the reachability check for the EgressIP node.
The following egressIPConfig object describes changing the reachabilityTotalTimeoutSeconds from the default 1 second probes to 5 second probes:
apiVersion: operator.openshift.io/v1
kind: Network
metadata:
name: cluster
spec:
clusterNetwork:
- cidr: 10.128.0.0/14
hostPrefix: 23
defaultNetwork:
ovnKubernetesConfig:
egressIPConfig:
reachabilityTotalTimeoutSeconds: 5
gatewayConfig:
routingViaHost: false
genevePort: 6081- 1
- The
egressIPConfigholds the configurations for the options of theEgressIPobject. By changing these configurations, you can extend theEgressIPobject. - 2
- The value for
reachabilityTotalTimeoutSecondsaccepts integer values from0to60. A value of0disables the reachability check of the egressIP node. Setting a value from1to60corresponds to the timeout in seconds for a probe to send the reachability check to the node.
19.11.5. Labeling a node to host egress IP addresses
You can apply the k8s.ovn.org/egress-assignable="" label to a node in your cluster so that OpenShift Container Platform can assign one or more egress IP addresses to the node.
Prerequisites
-
Install the OpenShift CLI (
oc). - Log in to the cluster as a cluster administrator.
Procedure
To label a node so that it can host one or more egress IP addresses, enter the following command:
$ oc label nodes <node_name> k8s.ovn.org/egress-assignable=""1 - 1
- The name of the node to label.
TipYou can alternatively apply the following YAML to add the label to a node:
apiVersion: v1 kind: Node metadata: labels: k8s.ovn.org/egress-assignable: "" name: <node_name>
19.11.6. Next steps
19.12. Assigning an egress IP address
As a cluster administrator, you can assign an egress IP address for traffic leaving the cluster from a namespace or from specific pods in a namespace.
19.12.1. Assigning an egress IP address to a namespace
You can assign one or more egress IP addresses to a namespace or to specific pods in a namespace.
Prerequisites
-
Install the OpenShift CLI (
oc). - Log in to the cluster as a cluster administrator.
- Configure at least one node to host an egress IP address.
Procedure
Create an
EgressIPobject:-
Create a
<egressips_name>.yamlfile where<egressips_name>is the name of the object. In the file that you created, define an
EgressIPobject, as in the following example:apiVersion: k8s.ovn.org/v1 kind: EgressIP metadata: name: egress-project1 spec: egressIPs: - 192.168.127.10 - 192.168.127.11 namespaceSelector: matchLabels: env: qa
-
Create a
To create the object, enter the following command.
$ oc apply -f <egressips_name>.yaml1 - 1
- Replace
<egressips_name>with the name of the object.
Example output
egressips.k8s.ovn.org/<egressips_name> created-
Optional: Store the
<egressips_name>.yamlfile so that you can make changes later. Add labels to the namespace that requires egress IP addresses. To add a label to the namespace of an
EgressIPobject defined in step 1, run the following command:$ oc label ns <namespace> env=qa1 - 1
- Replace
<namespace>with the namespace that requires egress IP addresses.
Verification
To show all egress IPs that are in use in your cluster, enter the following command:
$ oc get egressip -o yamlNoteThe command
oc get egressiponly returns one egress IP address regardless of how many are configured. This is not a bug and is a limitation of Kubernetes. As a workaround, you can pass in the-o yamlor-o jsonflags to return all egress IPs addresses in use.Example output
# ... spec: egressIPs: - 192.168.127.10 - 192.168.127.11 # ...
19.13. Configuring an egress service
As a cluster administrator, you can configure egress traffic for pods behind a load balancer service by using an egress service.
Egress service is a Technology Preview feature only. Technology Preview features are not supported with Red Hat production service level agreements (SLAs) and might not be functionally complete. Red Hat does not recommend using them in production. These features provide early access to upcoming product features, enabling customers to test functionality and provide feedback during the development process.
For more information about the support scope of Red Hat Technology Preview features, see Technology Preview Features Support Scope.
You can use the EgressService custom resource (CR) to manage egress traffic in the following ways:
Assign a load balancer service IP address as the source IP address for egress traffic for pods behind the load balancer service.
Assigning the load balancer IP address as the source IP address in this context is useful to present a single point of egress and ingress. For example, in some scenarios, an external system communicating with an application behind a load balancer service can expect the source and destination IP address for the application to be the same.
NoteWhen you assign the load balancer service IP address to egress traffic for pods behind the service, OVN-Kubernetes restricts the ingress and egress point to a single node. This limits the load balancing of traffic that MetalLB typically provides.
Assign the egress traffic for pods behind a load balancer to a different network than the default node network.
This is useful to assign the egress traffic for applications behind a load balancer to a different network than the default network. Typically, the different network is implemented by using a VRF instance associated with a network interface.
19.13.1. Egress service custom resource
Define the configuration for an egress service in an EgressService custom resource. The following YAML describes the fields for the configuration of an egress service:
apiVersion: k8s.ovn.org/v1
kind: EgressService
metadata:
name: <egress_service_name>
namespace: <namespace>
spec:
sourceIPBy: <egress_traffic_ip>
nodeSelector:
matchLabels:
node-role.kubernetes.io/<role>: ""
network: <egress_traffic_network> - 1
- Specify the name for the egress service. The name of the
EgressServiceresource must match the name of the load-balancer service that you want to modify. - 2
- Specify the namespace for the egress service. The namespace for the
EgressServicemust match the namespace of the load-balancer service that you want to modify. The egress service is namespace-scoped. - 3
- Specify the source IP address of egress traffic for pods behind a service. Valid values are
LoadBalancerIPorNetwork. Use theLoadBalancerIPvalue to assign theLoadBalancerservice ingress IP address as the source IP address for egress traffic. SpecifyNetworkto assign the network interface IP address as the source IP address for egress traffic. - 4
- Optional: If you use the
LoadBalancerIPvalue for thesourceIPByspecification, a single node handles theLoadBalancerservice traffic. Use thenodeSelectorfield to limit which node can be assigned this task. When a node is selected to handle the service traffic, OVN-Kubernetes labels the node in the following format:egress-service.k8s.ovn.org/<svc-namespace>-<svc-name>: "". When thenodeSelectorfield is not specified, any node can manage theLoadBalancerservice traffic. - 5
- Optional: Specify the routing table ID for egress traffic. Ensure that the value matches the
route-table-idID defined in theNodeNetworkConfigurationPolicyresource. If you do not include thenetworkspecification, the egress service uses the default host network.
Example egress service specification
apiVersion: k8s.ovn.org/v1
kind: EgressService
metadata:
name: test-egress-service
namespace: test-namespace
spec:
sourceIPBy: "LoadBalancerIP"
nodeSelector:
matchLabels:
vrf: "true"
network: "2"19.13.2. Deploying an egress service
You can deploy an egress service to manage egress traffic for pods behind a LoadBalancer service.
The following example configures the egress traffic to have the same source IP address as the ingress IP address of the LoadBalancer service.
Prerequisites
-
Install the OpenShift CLI (
oc). -
Log in as a user with
cluster-adminprivileges. -
You configured MetalLB
BGPPeerresources.
Procedure
Create an
IPAddressPoolCR with the desired IP for the service:Create a file, such as
ip-addr-pool.yaml, with content like the following example:apiVersion: metallb.io/v1beta1 kind: IPAddressPool metadata: name: example-pool namespace: metallb-system spec: addresses: - 172.19.0.100/32Apply the configuration for the IP address pool by running the following command:
$ oc apply -f ip-addr-pool.yaml
Create
ServiceandEgressServiceCRs:Create a file, such as
service-egress-service.yaml, with content like the following example:apiVersion: v1 kind: Service metadata: name: example-service namespace: example-namespace annotations: metallb.universe.tf/address-pool: example-pool1 spec: selector: app: example ports: - name: http protocol: TCP port: 8080 targetPort: 8080 type: LoadBalancer --- apiVersion: k8s.ovn.org/v1 kind: EgressService metadata: name: example-service namespace: example-namespace spec: sourceIPBy: "LoadBalancerIP"2 nodeSelector:3 matchLabels: node-role.kubernetes.io/worker: ""- 1
- The
LoadBalancerservice uses the IP address assigned by MetalLB from theexample-poolIP address pool. - 2
- This example uses the
LoadBalancerIPvalue to assign the ingress IP address of theLoadBalancerservice as the source IP address of egress traffic. - 3
- When you specify the
LoadBalancerIPvalue, a single node handles theLoadBalancerservice’s traffic. In this example, only nodes with theworkerlabel can be selected to handle the traffic. When a node is selected, OVN-Kubernetes labels the node in the following formategress-service.k8s.ovn.org/<svc-namespace>-<svc-name>: "".
NoteIf you use the
sourceIPBy: "LoadBalancerIP"setting, you must specify the load-balancer node in theBGPAdvertisementcustom resource (CR).Apply the configuration for the service and egress service by running the following command:
$ oc apply -f service-egress-service.yaml
Create a
BGPAdvertisementCR to advertise the service:Create a file, such as
service-bgp-advertisement.yaml, with content like the following example:apiVersion: metallb.io/v1beta1 kind: BGPAdvertisement metadata: name: example-bgp-adv namespace: metallb-system spec: ipAddressPools: - example-pool nodeSelectors: - matchLabels: egress-service.k8s.ovn.org/example-namespace-example-service: ""1 - 1
- In this example, the
EgressServiceCR configures the source IP address for egress traffic to use the load-balancer service IP address. Therefore, you must specify the load-balancer node for return traffic to use the same return path for the traffic originating from the pod.
Verification
Verify that you can access the application endpoint of the pods running behind the MetalLB service by running the following command:
$ curl <external_ip_address>:<port_number>1 - 1
- Update the external IP address and port number to suit your application endpoint.
-
If you assigned the
LoadBalancerservice’s ingress IP address as the source IP address for egress traffic, verify this configuration by using tools such astcpdumpto analyze packets received at the external client.
19.14. Considerations for the use of an egress router pod
19.14.1. About an egress router pod
The OpenShift Container Platform egress router pod redirects traffic to a specified remote server from a private source IP address that is not used for any other purpose. An egress router pod can send network traffic to servers that are set up to allow access only from specific IP addresses.
The egress router pod is not intended for every outgoing connection. Creating large numbers of egress router pods can exceed the limits of your network hardware. For example, creating an egress router pod for every project or application could exceed the number of local MAC addresses that the network interface can handle before reverting to filtering MAC addresses in software.
The egress router image is not compatible with Amazon AWS, Azure Cloud, or any other cloud platform that does not support layer 2 manipulations due to their incompatibility with macvlan traffic.
19.14.1.1. Egress router modes
In redirect mode, an egress router pod configures iptables rules to redirect traffic from its own IP address to one or more destination IP addresses. Client pods that need to use the reserved source IP address must be configured to access the service for the egress router rather than connecting directly to the destination IP. You can access the destination service and port from the application pod by using the curl command. For example:
$ curl <router_service_IP> <port>The egress router CNI plugin supports redirect mode only. This is a difference with the egress router implementation that you can deploy with OpenShift SDN. Unlike the egress router for OpenShift SDN, the egress router CNI plugin does not support HTTP proxy mode or DNS proxy mode.
19.14.1.2. Egress router pod implementation
The egress router implementation uses the egress router Container Network Interface (CNI) plugin. The plugin adds a secondary network interface to a pod.
An egress router is a pod that has two network interfaces. For example, the pod can have eth0 and net1 network interfaces. The eth0 interface is on the cluster network and the pod continues to use the interface for ordinary cluster-related network traffic. The net1 interface is on a secondary network and has an IP address and gateway for that network. Other pods in the OpenShift Container Platform cluster can access the egress router service and the service enables the pods to access external services. The egress router acts as a bridge between pods and an external system.
Traffic that leaves the egress router exits through a node, but the packets have the MAC address of the net1 interface from the egress router pod.
When you add an egress router custom resource, the Cluster Network Operator creates the following objects:
-
The network attachment definition for the
net1secondary network interface of the pod. - A deployment for the egress router.
If you delete an egress router custom resource, the Operator deletes the two objects in the preceding list that are associated with the egress router.
19.14.1.3. Deployment considerations
An egress router pod adds an additional IP address and MAC address to the primary network interface of the node. As a result, you might need to configure your hypervisor or cloud provider to allow the additional address.
- Red Hat OpenStack Platform (RHOSP)
If you deploy OpenShift Container Platform on RHOSP, you must allow traffic from the IP and MAC addresses of the egress router pod on your OpenStack environment. If you do not allow the traffic, then communication will fail:
$ openstack port set --allowed-address \ ip_address=<ip_address>,mac_address=<mac_address> <neutron_port_uuid>- VMware vSphere
- If you are using VMware vSphere, see the VMware documentation for securing vSphere standard switches. View and change VMware vSphere default settings by selecting the host virtual switch from the vSphere Web Client.
Specifically, ensure that the following are enabled:
19.14.1.4. Failover configuration
To avoid downtime, the Cluster Network Operator deploys the egress router pod as a deployment resource. The deployment name is egress-router-cni-deployment. The pod that corresponds to the deployment has a label of app=egress-router-cni.
To create a new service for the deployment, use the oc expose deployment/egress-router-cni-deployment --port <port_number> command or create a file like the following example:
apiVersion: v1
kind: Service
metadata:
name: app-egress
spec:
ports:
- name: tcp-8080
protocol: TCP
port: 8080
- name: tcp-8443
protocol: TCP
port: 8443
- name: udp-80
protocol: UDP
port: 80
type: ClusterIP
selector:
app: egress-router-cni19.15. Deploying an egress router pod in redirect mode
As a cluster administrator, you can deploy an egress router pod to redirect traffic to specified destination IP addresses from a reserved source IP address.
The egress router implementation uses the egress router Container Network Interface (CNI) plugin.
19.15.1. Egress router custom resource
Define the configuration for an egress router pod in an egress router custom resource. The following YAML describes the fields for the configuration of an egress router in redirect mode:
apiVersion: network.operator.openshift.io/v1
kind: EgressRouter
metadata:
name: <egress_router_name>
namespace: <namespace>
spec:
addresses: [
{
ip: "<egress_router>",
gateway: "<egress_gateway>"
}
]
mode: Redirect
redirect: {
redirectRules: [
{
destinationIP: "<egress_destination>",
port: <egress_router_port>,
targetPort: <target_port>,
protocol: <network_protocol>
},
...
],
fallbackIP: "<egress_destination>"
}- 1
- Optional: The
namespacefield specifies the namespace to create the egress router in. If you do not specify a value in the file or on the command line, thedefaultnamespace is used. - 2
- The
addressesfield specifies the IP addresses to configure on the secondary network interface. - 3
- The
ipfield specifies the reserved source IP address and netmask from the physical network that the node is on to use with egress router pod. Use CIDR notation to specify the IP address and netmask. - 4
- The
gatewayfield specifies the IP address of the network gateway. - 5
- Optional: The
redirectRulesfield specifies a combination of egress destination IP address, egress router port, and protocol. Incoming connections to the egress router on the specified port and protocol are routed to the destination IP address. - 6
- Optional: The
targetPortfield specifies the network port on the destination IP address. If this field is not specified, traffic is routed to the same network port that it arrived on. - 7
- The
protocolfield supports TCP, UDP, or SCTP. - 8
- Optional: The
fallbackIPfield specifies a destination IP address. If you do not specify any redirect rules, the egress router sends all traffic to this fallback IP address. If you specify redirect rules, any connections to network ports that are not defined in the rules are sent by the egress router to this fallback IP address. If you do not specify this field, the egress router rejects connections to network ports that are not defined in the rules.
Example egress router specification
apiVersion: network.operator.openshift.io/v1
kind: EgressRouter
metadata:
name: egress-router-redirect
spec:
networkInterface: {
macvlan: {
mode: "Bridge"
}
}
addresses: [
{
ip: "192.168.12.99/24",
gateway: "192.168.12.1"
}
]
mode: Redirect
redirect: {
redirectRules: [
{
destinationIP: "10.0.0.99",
port: 80,
protocol: UDP
},
{
destinationIP: "203.0.113.26",
port: 8080,
targetPort: 80,
protocol: TCP
},
{
destinationIP: "203.0.113.27",
port: 8443,
targetPort: 443,
protocol: TCP
}
]
}19.15.2. Deploying an egress router in redirect mode
You can deploy an egress router to redirect traffic from its own reserved source IP address to one or more destination IP addresses.
After you add an egress router, the client pods that need to use the reserved source IP address must be modified to connect to the egress router rather than connecting directly to the destination IP.
Prerequisites
-
Install the OpenShift CLI (
oc). -
Log in as a user with
cluster-adminprivileges.
Procedure
- Create an egress router definition.
To ensure that other pods can find the IP address of the egress router pod, create a service that uses the egress router, as in the following example:
apiVersion: v1 kind: Service metadata: name: egress-1 spec: ports: - name: web-app protocol: TCP port: 8080 type: ClusterIP selector: app: egress-router-cni1 - 1
- Specify the label for the egress router. The value shown is added by the Cluster Network Operator and is not configurable.
After you create the service, your pods can connect to the service. The egress router pod redirects traffic to the corresponding port on the destination IP address. The connections originate from the reserved source IP address.
Verification
To verify that the Cluster Network Operator started the egress router, complete the following procedure:
View the network attachment definition that the Operator created for the egress router:
$ oc get network-attachment-definition egress-router-cni-nadThe name of the network attachment definition is not configurable.
Example output
NAME AGE egress-router-cni-nad 18mView the deployment for the egress router pod:
$ oc get deployment egress-router-cni-deploymentThe name of the deployment is not configurable.
Example output
NAME READY UP-TO-DATE AVAILABLE AGE egress-router-cni-deployment 1/1 1 1 18mView the status of the egress router pod:
$ oc get pods -l app=egress-router-cniExample output
NAME READY STATUS RESTARTS AGE egress-router-cni-deployment-575465c75c-qkq6m 1/1 Running 0 18m- View the logs and the routing table for the egress router pod.
Get the node name for the egress router pod:
$ POD_NODENAME=$(oc get pod -l app=egress-router-cni -o jsonpath="{.items[0].spec.nodeName}")Enter into a debug session on the target node. This step instantiates a debug pod called
<node_name>-debug:$ oc debug node/$POD_NODENAMESet
/hostas the root directory within the debug shell. The debug pod mounts the root file system of the host in/hostwithin the pod. By changing the root directory to/host, you can run binaries from the executable paths of the host:# chroot /hostFrom within the
chrootenvironment console, display the egress router logs:# cat /tmp/egress-router-logExample output
2021-04-26T12:27:20Z [debug] Called CNI ADD 2021-04-26T12:27:20Z [debug] Gateway: 192.168.12.1 2021-04-26T12:27:20Z [debug] IP Source Addresses: [192.168.12.99/24] 2021-04-26T12:27:20Z [debug] IP Destinations: [80 UDP 10.0.0.99/30 8080 TCP 203.0.113.26/30 80 8443 TCP 203.0.113.27/30 443] 2021-04-26T12:27:20Z [debug] Created macvlan interface 2021-04-26T12:27:20Z [debug] Renamed macvlan to "net1" 2021-04-26T12:27:20Z [debug] Adding route to gateway 192.168.12.1 on macvlan interface 2021-04-26T12:27:20Z [debug] deleted default route {Ifindex: 3 Dst: <nil> Src: <nil> Gw: 10.128.10.1 Flags: [] Table: 254} 2021-04-26T12:27:20Z [debug] Added new default route with gateway 192.168.12.1 2021-04-26T12:27:20Z [debug] Added iptables rule: iptables -t nat PREROUTING -i eth0 -p UDP --dport 80 -j DNAT --to-destination 10.0.0.99 2021-04-26T12:27:20Z [debug] Added iptables rule: iptables -t nat PREROUTING -i eth0 -p TCP --dport 8080 -j DNAT --to-destination 203.0.113.26:80 2021-04-26T12:27:20Z [debug] Added iptables rule: iptables -t nat PREROUTING -i eth0 -p TCP --dport 8443 -j DNAT --to-destination 203.0.113.27:443 2021-04-26T12:27:20Z [debug] Added iptables rule: iptables -t nat -o net1 -j SNAT --to-source 192.168.12.99The logging file location and logging level are not configurable when you start the egress router by creating an
EgressRouterobject as described in this procedure.From within the
chrootenvironment console, get the container ID:# crictl ps --name egress-router-cni-pod | awk '{print $1}'Example output
CONTAINER bac9fae69ddb6Determine the process ID of the container. In this example, the container ID is
bac9fae69ddb6:# crictl inspect -o yaml bac9fae69ddb6 | grep 'pid:' | awk '{print $2}'Example output
68857Enter the network namespace of the container:
# nsenter -n -t 68857Display the routing table:
# ip routeIn the following example output, the
net1network interface is the default route. Traffic for the cluster network uses theeth0network interface. Traffic for the192.168.12.0/24network uses thenet1network interface and originates from the reserved source IP address192.168.12.99. The pod routes all other traffic to the gateway at IP address192.168.12.1. Routing for the service network is not shown.Example output
default via 192.168.12.1 dev net1 10.128.10.0/23 dev eth0 proto kernel scope link src 10.128.10.18 192.168.12.0/24 dev net1 proto kernel scope link src 192.168.12.99 192.168.12.1 dev net1
19.16. Enabling multicast for a project
19.16.1. About multicast
With IP multicast, data is broadcast to many IP addresses simultaneously.
- At this time, multicast is best used for low-bandwidth coordination or service discovery and not a high-bandwidth solution.
-
By default, network policies affect all connections in a namespace. However, multicast is unaffected by network policies. If multicast is enabled in the same namespace as your network policies, it is always allowed, even if there is a
deny-allnetwork policy. Cluster administrators should consider the implications to the exemption of multicast from network policies before enabling it.
Multicast traffic between OpenShift Container Platform pods is disabled by default. If you are using the OVN-Kubernetes network plugin, you can enable multicast on a per-project basis.
19.16.2. Enabling multicast between pods
You can enable multicast between pods for your project.
Prerequisites
-
Install the OpenShift CLI (
oc). -
You must log in to the cluster with a user that has the
cluster-adminrole.
Procedure
Run the following command to enable multicast for a project. Replace
<namespace>with the namespace for the project you want to enable multicast for.$ oc annotate namespace <namespace> \ k8s.ovn.org/multicast-enabled=trueTipYou can alternatively apply the following YAML to add the annotation:
apiVersion: v1 kind: Namespace metadata: name: <namespace> annotations: k8s.ovn.org/multicast-enabled: "true"
Verification
To verify that multicast is enabled for a project, complete the following procedure:
Change your current project to the project that you enabled multicast for. Replace
<project>with the project name.$ oc project <project>Create a pod to act as a multicast receiver:
$ cat <<EOF| oc create -f - apiVersion: v1 kind: Pod metadata: name: mlistener labels: app: multicast-verify spec: containers: - name: mlistener image: registry.access.redhat.com/ubi9 command: ["/bin/sh", "-c"] args: ["dnf -y install socat hostname && sleep inf"] ports: - containerPort: 30102 name: mlistener protocol: UDP EOFCreate a pod to act as a multicast sender:
$ cat <<EOF| oc create -f - apiVersion: v1 kind: Pod metadata: name: msender labels: app: multicast-verify spec: containers: - name: msender image: registry.access.redhat.com/ubi9 command: ["/bin/sh", "-c"] args: ["dnf -y install socat && sleep inf"] EOFIn a new terminal window or tab, start the multicast listener.
Get the IP address for the Pod:
$ POD_IP=$(oc get pods mlistener -o jsonpath='{.status.podIP}')Start the multicast listener by entering the following command:
$ oc exec mlistener -i -t -- \ socat UDP4-RECVFROM:30102,ip-add-membership=224.1.0.1:$POD_IP,fork EXEC:hostname
Start the multicast transmitter.
Get the pod network IP address range:
$ CIDR=$(oc get Network.config.openshift.io cluster \ -o jsonpath='{.status.clusterNetwork[0].cidr}')To send a multicast message, enter the following command:
$ oc exec msender -i -t -- \ /bin/bash -c "echo | socat STDIO UDP4-DATAGRAM:224.1.0.1:30102,range=$CIDR,ip-multicast-ttl=64"If multicast is working, the previous command returns the following output:
mlistener
19.17. Disabling multicast for a project
19.17.1. Disabling multicast between pods
You can disable multicast between pods for your project.
Prerequisites
-
Install the OpenShift CLI (
oc). -
You must log in to the cluster with a user that has the
cluster-adminrole.
Procedure
Disable multicast by running the following command:
$ oc annotate namespace <namespace> \1 k8s.ovn.org/multicast-enabled-- 1
- The
namespacefor the project you want to disable multicast for.
TipYou can alternatively apply the following YAML to delete the annotation:
apiVersion: v1 kind: Namespace metadata: name: <namespace> annotations: k8s.ovn.org/multicast-enabled: null
19.18. Tracking network flows
As a cluster administrator, you can collect information about pod network flows from your cluster to assist with the following areas:
- Monitor ingress and egress traffic on the pod network.
- Troubleshoot performance issues.
- Gather data for capacity planning and security audits.
When you enable the collection of the network flows, only the metadata about the traffic is collected. For example, packet data is not collected, but the protocol, source address, destination address, port numbers, number of bytes, and other packet-level information is collected.
The data is collected in one or more of the following record formats:
- NetFlow
- sFlow
- IPFIX
When you configure the Cluster Network Operator (CNO) with one or more collector IP addresses and port numbers, the Operator configures Open vSwitch (OVS) on each node to send the network flows records to each collector.
You can configure the Operator to send records to more than one type of network flow collector. For example, you can send records to NetFlow collectors and also send records to sFlow collectors.
When OVS sends data to the collectors, each type of collector receives identical records. For example, if you configure two NetFlow collectors, OVS on a node sends identical records to the two collectors. If you also configure two sFlow collectors, the two sFlow collectors receive identical records. However, each collector type has a unique record format.
Collecting the network flows data and sending the records to collectors affects performance. Nodes process packets at a slower rate. If the performance impact is too great, you can delete the destinations for collectors to disable collecting network flows data and restore performance.
Enabling network flow collectors might have an impact on the overall performance of the cluster network.
19.18.1. Network object configuration for tracking network flows
The fields for configuring network flows collectors in the Cluster Network Operator (CNO) are shown in the following table:
| Field | Type | Description |
|---|---|---|
|
|
|
The name of the CNO object. This name is always |
|
|
|
One or more of |
|
|
| A list of IP address and network port pairs for up to 10 collectors. |
|
|
| A list of IP address and network port pairs for up to 10 collectors. |
|
|
| A list of IP address and network port pairs for up to 10 collectors. |
After applying the following manifest to the CNO, the Operator configures Open vSwitch (OVS) on each node in the cluster to send network flows records to the NetFlow collector that is listening at 192.168.1.99:2056.
Example configuration for tracking network flows
apiVersion: operator.openshift.io/v1
kind: Network
metadata:
name: cluster
spec:
exportNetworkFlows:
netFlow:
collectors:
- 192.168.1.99:205619.18.2. Adding destinations for network flows collectors
As a cluster administrator, you can configure the Cluster Network Operator (CNO) to send network flows metadata about the pod network to a network flows collector.
Prerequisites
-
You installed the OpenShift CLI (
oc). -
You are logged in to the cluster with a user with
cluster-adminprivileges. - You have a network flows collector and know the IP address and port that it listens on.
Procedure
Create a patch file that specifies the network flows collector type and the IP address and port information of the collectors:
spec: exportNetworkFlows: netFlow: collectors: - 192.168.1.99:2056Configure the CNO with the network flows collectors:
$ oc patch network.operator cluster --type merge -p "$(cat <file_name>.yaml)"Example output
network.operator.openshift.io/cluster patched
Verification
Verification is not typically necessary. You can run the following command to confirm that Open vSwitch (OVS) on each node is configured to send network flows records to one or more collectors.
View the Operator configuration to confirm that the
exportNetworkFlowsfield is configured:$ oc get network.operator cluster -o jsonpath="{.spec.exportNetworkFlows}"Example output
{"netFlow":{"collectors":["192.168.1.99:2056"]}}View the network flows configuration in OVS from each node:
$ for pod in $(oc get pods -n openshift-ovn-kubernetes -l app=ovnkube-node -o jsonpath='{range@.items[*]}{.metadata.name}{"\n"}{end}'); do ; echo; echo $pod; oc -n openshift-ovn-kubernetes exec -c ovnkube-controller $pod \ -- bash -c 'for type in ipfix sflow netflow ; do ovs-vsctl find $type ; done'; doneExample output
ovnkube-node-xrn4p _uuid : a4d2aaca-5023-4f3d-9400-7275f92611f9 active_timeout : 60 add_id_to_interface : false engine_id : [] engine_type : [] external_ids : {} targets : ["192.168.1.99:2056"] ovnkube-node-z4vq9 _uuid : 61d02fdb-9228-4993-8ff5-b27f01a29bd6 active_timeout : 60 add_id_to_interface : false engine_id : [] engine_type : [] external_ids : {} targets : ["192.168.1.99:2056"]- ...
19.18.3. Deleting all destinations for network flows collectors
As a cluster administrator, you can configure the Cluster Network Operator (CNO) to stop sending network flows metadata to a network flows collector.
Prerequisites
-
You installed the OpenShift CLI (
oc). -
You are logged in to the cluster with a user with
cluster-adminprivileges.
Procedure
Remove all network flows collectors:
$ oc patch network.operator cluster --type='json' \ -p='[{"op":"remove", "path":"/spec/exportNetworkFlows"}]'Example output
network.operator.openshift.io/cluster patched
19.19. Configuring hybrid networking
As a cluster administrator, you can configure the Red Hat OpenShift Networking OVN-Kubernetes network plugin to allow Linux and Windows nodes to host Linux and Windows workloads, respectively.
19.19.1. Configuring hybrid networking with OVN-Kubernetes
You can configure your cluster to use hybrid networking with the OVN-Kubernetes network plugin. This allows a hybrid cluster that supports different node networking configurations.
This configuration is necessary to run both Linux and Windows nodes in the same cluster.
Prerequisites
-
Install the OpenShift CLI (
oc). -
Log in to the cluster as a user with
cluster-adminprivileges. - Ensure that the cluster uses the OVN-Kubernetes network plugin.
Procedure
To configure the OVN-Kubernetes hybrid network overlay, enter the following command:
$ oc patch networks.operator.openshift.io cluster --type=merge \ -p '{ "spec":{ "defaultNetwork":{ "ovnKubernetesConfig":{ "hybridOverlayConfig":{ "hybridClusterNetwork":[ { "cidr": "<cidr>", "hostPrefix": <prefix> } ], "hybridOverlayVXLANPort": <overlay_port> } } } } }'where:
cidr- Specify the CIDR configuration used for nodes on the additional overlay network. This CIDR must not overlap with the cluster network CIDR.
hostPrefix-
Specifies the subnet prefix length to assign to each individual node. For example, if
hostPrefixis set to23, then each node is assigned a/23subnet out of the givencidr, which allows for 510 (2^(32 - 23) - 2) pod IP addresses. If you are required to provide access to nodes from an external network, configure load balancers and routers to manage the traffic. hybridOverlayVXLANPort-
Specify a custom VXLAN port for the additional overlay network. This is required for running Windows nodes in a cluster installed on vSphere, and must not be configured for any other cloud provider. The custom port can be any open port excluding the default
4789port. For more information on this requirement, see the Microsoft documentation on Pod-to-pod connectivity between hosts is broken.
NoteWindows Server Long-Term Servicing Channel (LTSC): Windows Server 2019 is not supported on clusters with a custom
hybridOverlayVXLANPortvalue because this Windows server version does not support selecting a custom VXLAN port.Example output
network.operator.openshift.io/cluster patchedTo confirm that the configuration is active, enter the following command. It can take several minutes for the update to apply.
$ oc get network.operator.openshift.io -o jsonpath="{.items[0].spec.defaultNetwork.ovnKubernetesConfig}"
Chapter 20. OpenShift SDN network plugin
20.1. About the OpenShift SDN network plugin
Part of Red Hat OpenShift Networking, OpenShift SDN is a network plugin that uses a software-defined networking (SDN) approach to provide a unified cluster network that enables communication between pods across the OpenShift Container Platform cluster. This pod network is established and maintained by OpenShift SDN, which configures an overlay network using Open vSwitch (OVS).
OpenShift SDN CNI is deprecated as of OpenShift Container Platform 4.14. As of OpenShift Container Platform 4.15, the network plugin is not an option for new installations. In a subsequent future release, the OpenShift SDN network plugin is planned to be removed and no longer supported. Red Hat will provide bug fixes and support for this feature until it is removed, but this feature will no longer receive enhancements. As an alternative to OpenShift SDN CNI, you can use OVN Kubernetes CNI instead. For more information, see OpenShift SDN CNI removal.
20.1.1. OpenShift SDN network isolation modes
OpenShift SDN provides three SDN modes for configuring the pod network:
-
Network policy mode allows project administrators to configure their own isolation policies using
NetworkPolicyobjects. Network policy is the default mode in OpenShift Container Platform 4.16. - Multitenant mode provides project-level isolation for pods and services. Pods from different projects cannot send packets to or receive packets from pods and services of a different project. You can disable isolation for a project, allowing it to send network traffic to all pods and services in the entire cluster and receive network traffic from those pods and services.
- Subnet mode provides a flat pod network where every pod can communicate with every other pod and service. The network policy mode provides the same functionality as subnet mode.
20.1.2. Supported network plugin feature matrix
Red Hat OpenShift Networking offers two options for the network plugin, OpenShift SDN and OVN-Kubernetes, for the network plugin. The following table summarizes the current feature support for both network plugins:
| Feature | OpenShift SDN | OVN-Kubernetes |
|---|---|---|
| Egress IPs | Supported | Supported |
| Egress firewall | Supported | Supported [1] |
| Egress router | Supported | Supported [2] |
| Hybrid networking | Not supported | Supported |
| IPsec encryption for intra-cluster communication | Not supported | Supported |
| IPv4 single-stack | Supported | Supported |
| IPv6 single-stack | Not supported | Supported [3] |
| IPv4/IPv6 dual-stack | Not Supported | Supported [4] |
| IPv6/IPv4 dual-stack | Not supported | Supported [5] |
| Kubernetes network policy | Supported | Supported |
| Kubernetes network policy logs | Not supported | Supported |
| Hardware offloading | Not supported | Supported |
| Multicast | Supported | Supported |
- Egress firewall is also known as egress network policy in OpenShift SDN. This is not the same as network policy egress.
- Egress router for OVN-Kubernetes supports only redirect mode.
- IPv6 single-stack networking on a bare-metal platform.
- IPv4/IPv6 dual-stack networking on bare-metal, VMware vSphere (installer-provisioned infrastructure installations only), IBM Power®, IBM Z®, and RHOSP platforms.
- IPv6/IPv4 dual-stack networking on bare-metal, VMware vSphere (installer-provisioned infrastructure installations only), and IBM Power® platforms.
20.2. Configuring egress IPs for a project
As a cluster administrator, you can configure the OpenShift SDN Container Network Interface (CNI) network plugin to assign one or more egress IP addresses to a project.
OpenShift SDN CNI is deprecated as of OpenShift Container Platform 4.14. As of OpenShift Container Platform 4.15, the network plugin is not an option for new installations. In a subsequent future release, the OpenShift SDN network plugin is planned to be removed and no longer supported. Red Hat will provide bug fixes and support for this feature until it is removed, but this feature will no longer receive enhancements. As an alternative to OpenShift SDN CNI, you can use OVN Kubernetes CNI instead. For more information, see OpenShift SDN CNI removal.
20.2.1. Egress IP address architectural design and implementation
By using the OpenShift Container Platform egress IP address functionality, you can ensure that the traffic from one or more pods in one or more namespaces has a consistent source IP address for services outside the cluster network.
For example, you might have a pod that periodically queries a database that is hosted on a server outside of your cluster. To enforce access requirements for the server, a packet filtering device is configured to allow traffic only from specific IP addresses. To ensure that you can reliably allow access to the server from only that specific pod, you can configure a specific egress IP address for the pod that makes the requests to the server.
An egress IP address assigned to a namespace is different from an egress router, which is used to send traffic to specific destinations.
In some cluster configurations, application pods and ingress router pods run on the same node. If you configure an egress IP address for an application project in this scenario, the IP address is not used when you send a request to a route from the application project.
An egress IP address is implemented as an additional IP address on the primary network interface of a node and must be in the same subnet as the primary IP address of the node. The additional IP address must not be assigned to any other node in the cluster.
Egress IP addresses must not be configured in any Linux network configuration files, such as ifcfg-eth0.
20.2.1.1. Platform support
The Egress IP address feature that runs on a primary host network is supported on the following platforms:
| Platform | Supported |
|---|---|
| Bare metal | Yes |
| VMware vSphere | Yes |
| Red Hat OpenStack Platform (RHOSP) | Yes |
| Amazon Web Services (AWS) | Yes |
| Google Cloud | Yes |
| Microsoft Azure | Yes |
| IBM Z® and IBM® LinuxONE | Yes |
| IBM Z® and IBM® LinuxONE for Red Hat Enterprise Linux (RHEL) KVM | Yes |
| IBM Power® | Yes |
| Nutanix | Yes |
The Egress IP address feature that runs on secondary host networks is supported on the following platform:
| Platform | Supported |
|---|---|
| Bare metal | Yes |
The assignment of egress IP addresses to control plane nodes with the EgressIP feature is not supported on a cluster provisioned on Amazon Web Services (AWS). (BZ#2039656).
20.2.1.2. Public cloud platform considerations
Typically, public cloud providers place a limit on egress IPs. This means that there is a constraint on the absolute number of assignable IP addresses per node for clusters provisioned on public cloud infrastructure. The maximum number of assignable IP addresses per node, or the IP capacity, can be described in the following formula:
IP capacity = public cloud default capacity - sum(current IP assignments)While the Egress IPs capability manages the IP address capacity per node, it is important to plan for this constraint in your deployments. For example, if a public cloud provider limits IP address capacity to 10 IP addresses per node, and you have 8 nodes, the total number of assignable IP addresses is only 80. To achieve a higher IP address capacity, you would need to allocate additional nodes. For example, if you needed 150 assignable IP addresses, you would need to allocate 7 additional nodes.
To confirm the IP capacity and subnets for any node in your public cloud environment, you can enter the oc get node <node_name> -o yaml command. The cloud.network.openshift.io/egress-ipconfig annotation includes capacity and subnet information for the node.
The annotation value is an array with a single object with fields that provide the following information for the primary network interface:
-
interface: Specifies the interface ID on AWS and Azure and the interface name on Google Cloud. -
ifaddr: Specifies the subnet mask for one or both IP address families. -
capacity: Specifies the IP address capacity for the node. On AWS, the IP address capacity is provided per IP address family. On Azure and Google Cloud, the IP address capacity includes both IPv4 and IPv6 addresses.
Automatic attachment and detachment of egress IP addresses for traffic between nodes are available. This allows for traffic from many pods in namespaces to have a consistent source IP address to locations outside of the cluster. This also supports OpenShift SDN and OVN-Kubernetes, which is the default networking plugin in Red Hat OpenShift Networking in OpenShift Container Platform 4.16.
The RHOSP egress IP address feature creates a Neutron reservation port called egressip-<IP address>. Using the same RHOSP user as the one used for the OpenShift Container Platform cluster installation, you can assign a floating IP address to this reservation port to have a predictable SNAT address for egress traffic. When an egress IP address on an RHOSP network is moved from one node to another, because of a node failover, for example, the Neutron reservation port is removed and recreated. This means that the floating IP association is lost and you need to manually reassign the floating IP address to the new reservation port.
When an RHOSP cluster administrator assigns a floating IP to the reservation port, OpenShift Container Platform cannot delete the reservation port. The CloudPrivateIPConfig object cannot perform delete and move operations until an RHOSP cluster administrator unassigns the floating IP from the reservation port.
The following examples illustrate the annotation from nodes on several public cloud providers. The annotations are indented for readability.
Example cloud.network.openshift.io/egress-ipconfig annotation on AWS
cloud.network.openshift.io/egress-ipconfig: [
{
"interface":"eni-078d267045138e436",
"ifaddr":{"ipv4":"10.0.128.0/18"},
"capacity":{"ipv4":14,"ipv6":15}
}
]Example cloud.network.openshift.io/egress-ipconfig annotation on Google Cloud
cloud.network.openshift.io/egress-ipconfig: [
{
"interface":"nic0",
"ifaddr":{"ipv4":"10.0.128.0/18"},
"capacity":{"ip":14}
}
]The following sections describe the IP address capacity for supported public cloud environments for use in your capacity calculation.
20.2.1.2.1. Amazon Web Services (AWS) IP address capacity limits
On AWS, constraints on IP address assignments depend on the instance type configured. For more information, see IP addresses per network interface per instance type
20.2.1.2.2. Google Cloud IP address capacity limits
On Google Cloud, the networking model implements additional node IP addresses through IP address aliasing, rather than IP address assignments. However, IP address capacity maps directly to IP aliasing capacity.
The following capacity limits exist for IP aliasing assignment:
- Per node, the maximum number of IP aliases, both IPv4 and IPv6, is 100.
- Per VPC, the maximum number of IP aliases is unspecified, but OpenShift Container Platform scalability testing reveals the maximum to be approximately 15,000.
For more information, see Per instance quotas and Alias IP ranges overview.
20.2.1.2.3. Microsoft Azure IP address capacity limits
On Azure, the following capacity limits exist for IP address assignment:
- Per NIC, the maximum number of assignable IP addresses, for both IPv4 and IPv6, is 256.
- Per virtual network, the maximum number of assigned IP addresses cannot exceed 65,536.
For more information, see Networking limits.
20.2.1.3. Limitations
The following limitations apply when using egress IP addresses with the OpenShift SDN network plugin:
- You cannot use manually assigned and automatically assigned egress IP addresses on the same nodes.
- If you manually assign egress IP addresses from an IP address range, you must not make that range available for automatic IP assignment.
- You cannot share egress IP addresses across multiple namespaces using the OpenShift SDN egress IP address implementation.
If you need to share IP addresses across namespaces, the OVN-Kubernetes network plugin egress IP address implementation allows you to span IP addresses across multiple namespaces.
If you use OpenShift SDN in multitenant mode, you cannot use egress IP addresses with any namespace that is joined to another namespace by the projects that are associated with them. For example, if project1 and project2 are joined by running the oc adm pod-network join-projects --to=project1 project2 command, neither project can use an egress IP address. For more information, see BZ#1645577.
20.2.1.4. IP address assignment approaches
You can assign egress IP addresses to namespaces by setting the egressIPs parameter of the NetNamespace object. After an egress IP address is associated with a project, OpenShift SDN allows you to assign egress IP addresses to hosts in two ways:
- In the automatically assigned approach, an egress IP address range is assigned to a node.
- In the manually assigned approach, a list of one or more egress IP address is assigned to a node.
Namespaces that request an egress IP address are matched with nodes that can host those egress IP addresses, and then the egress IP addresses are assigned to those nodes. If the egressIPs parameter is set on a NetNamespace object, but no node hosts that egress IP address, then egress traffic from the namespace will be dropped.
High availability of nodes is automatic. If a node that hosts an egress IP address is unreachable and there are nodes that are able to host that egress IP address, then the egress IP address will move to a new node. When the unreachable node comes back online, the egress IP address automatically moves to balance egress IP addresses across nodes.
20.2.1.4.1. Considerations when using automatically assigned egress IP addresses
When using the automatic assignment approach for egress IP addresses the following considerations apply:
-
You set the
egressCIDRsparameter of each node’sHostSubnetresource to indicate the range of egress IP addresses that can be hosted by a node. OpenShift Container Platform sets theegressIPsparameter of theHostSubnetresource based on the IP address range you specify.
If the node hosting the namespace’s egress IP address is unreachable, OpenShift Container Platform will reassign the egress IP address to another node with a compatible egress IP address range. The automatic assignment approach works best for clusters installed in environments with flexibility in associating additional IP addresses with nodes.
20.2.1.4.2. Considerations when using manually assigned egress IP addresses
This approach allows you to control which nodes can host an egress IP address.
If your cluster is installed on public cloud infrastructure, you must ensure that each node that you assign egress IP addresses to has sufficient spare capacity to host the IP addresses. For more information, see "Platform considerations" in a previous section.
When using the manual assignment approach for egress IP addresses the following considerations apply:
-
You set the
egressIPsparameter of each node’sHostSubnetresource to indicate the IP addresses that can be hosted by a node. - Multiple egress IP addresses per namespace are supported.
If a namespace has multiple egress IP addresses and those addresses are hosted on multiple nodes, the following additional considerations apply:
- If a pod is on a node that is hosting an egress IP address, that pod always uses the egress IP address on the node.
- If a pod is not on a node that is hosting an egress IP address, that pod uses an egress IP address at random.
20.2.2. Configuring automatically assigned egress IP addresses for a namespace
In OpenShift Container Platform you can enable automatic assignment of an egress IP address for a specific namespace across one or more nodes.
Prerequisites
-
You have access to the cluster as a user with the
cluster-adminrole. -
You have installed the OpenShift CLI (
oc).
Procedure
Update the
NetNamespaceobject with the egress IP address using the following JSON:$ oc patch netnamespace <project_name> --type=merge -p \ '{ "egressIPs": [ "<ip_address>" ] }'where:
<project_name>- Specifies the name of the project.
<ip_address>-
Specifies one or more egress IP addresses for the
egressIPsarray.
For example, to assign
project1to an IP address of 192.168.1.100 andproject2to an IP address of 192.168.1.101:$ oc patch netnamespace project1 --type=merge -p \ '{"egressIPs": ["192.168.1.100"]}' $ oc patch netnamespace project2 --type=merge -p \ '{"egressIPs": ["192.168.1.101"]}'NoteBecause OpenShift SDN manages the
NetNamespaceobject, you can make changes only by modifying the existingNetNamespaceobject. Do not create a newNetNamespaceobject.Indicate which nodes can host egress IP addresses by setting the
egressCIDRsparameter for each host using the following JSON:$ oc patch hostsubnet <node_name> --type=merge -p \ '{ "egressCIDRs": [ "<ip_address_range>", "<ip_address_range>" ] }'where:
<node_name>- Specifies a node name.
<ip_address_range>-
Specifies an IP address range in CIDR format. You can specify more than one address range for the
egressCIDRsarray.
For example, to set
node1andnode2to host egress IP addresses in the range 192.168.1.0 to 192.168.1.255:$ oc patch hostsubnet node1 --type=merge -p \ '{"egressCIDRs": ["192.168.1.0/24"]}' $ oc patch hostsubnet node2 --type=merge -p \ '{"egressCIDRs": ["192.168.1.0/24"]}'OpenShift Container Platform automatically assigns specific egress IP addresses to available nodes in a balanced way. In this case, it assigns the egress IP address 192.168.1.100 to
node1and the egress IP address 192.168.1.101 tonode2or vice versa.
20.2.3. Configuring manually assigned egress IP addresses for a namespace
In OpenShift Container Platform you can associate one or more egress IP addresses with a namespace.
Prerequisites
-
You have access to the cluster as a user with the
cluster-adminrole. -
You have installed the OpenShift CLI (
oc).
Procedure
Update the
NetNamespaceobject by specifying the following JSON object with the desired IP addresses:$ oc patch netnamespace <project_name> --type=merge -p \ '{ "egressIPs": [ "<ip_address>" ] }'where:
<project_name>- Specifies the name of the project.
<ip_address>-
Specifies one or more egress IP addresses for the
egressIPsarray.
For example, to assign the
project1project to the IP addresses192.168.1.100and192.168.1.101:$ oc patch netnamespace project1 --type=merge \ -p '{"egressIPs": ["192.168.1.100","192.168.1.101"]}'To provide high availability, set the
egressIPsvalue to two or more IP addresses on different nodes. If multiple egress IP addresses are set, then pods use all egress IP addresses roughly equally.NoteBecause OpenShift SDN manages the
NetNamespaceobject, you can make changes only by modifying the existingNetNamespaceobject. Do not create a newNetNamespaceobject.Manually assign the egress IP address to the node hosts.
If your cluster is installed on public cloud infrastructure, you must confirm that the node has available IP address capacity.
Set the
egressIPsparameter on theHostSubnetobject on the node host. Using the following JSON, include as many IP addresses as you want to assign to that node host:$ oc patch hostsubnet <node_name> --type=merge -p \ '{ "egressIPs": [ "<ip_address>", "<ip_address>" ] }'where:
<node_name>- Specifies a node name.
<ip_address>-
Specifies an IP address. You can specify more than one IP address for the
egressIPsarray.
For example, to specify that
node1should have the egress IPs192.168.1.100,192.168.1.101, and192.168.1.102:$ oc patch hostsubnet node1 --type=merge -p \ '{"egressIPs": ["192.168.1.100", "192.168.1.101", "192.168.1.102"]}'In the previous example, all egress traffic for
project1will be routed to the node hosting the specified egress IP, and then connected through Network Address Translation (NAT) to that IP address.
20.2.4. Additional resources
- If you are configuring manual egress IP address assignment, see Platform considerations for information about IP capacity planning.
20.3. Configuring an egress firewall for a project
As a cluster administrator, you can create an egress firewall for a project that restricts egress traffic leaving your OpenShift Container Platform cluster.
OpenShift SDN CNI is deprecated as of OpenShift Container Platform 4.14. As of OpenShift Container Platform 4.15, the network plugin is not an option for new installations. In a subsequent future release, the OpenShift SDN network plugin is planned to be removed and no longer supported. Red Hat will provide bug fixes and support for this feature until it is removed, but this feature will no longer receive enhancements. As an alternative to OpenShift SDN CNI, you can use OVN Kubernetes CNI instead. For more information, see OpenShift SDN CNI removal.
20.3.1. How an EgressNetworkPolicy custom resource works in a project
As a cluster administrator, you can use an egress firewall to limit the external hosts that some or all pods can access from within the cluster. You configure an egress firewall policy by creating an EgressNetworkPolicy custom resource (CR).
An egress firewall supports the following scenarios:
- A pod can only connect to internal hosts and cannot start connections to the public internet.
- A pod can only connect to the public internet and cannot start connections to internal hosts that are outside the OpenShift Container Platform cluster.
- A pod cannot reach specified internal subnets or hosts outside the OpenShift Container Platform cluster.
- A pod can only connect to specific external hosts.
For example, you can allow one project access to a specified IP range but deny the same access to a different project. Or you can restrict application developers from updating from Python pip mirrors, and force updates to come only from approved sources.
In your EgressNetworkPolicy CR you can match network traffic that meets any of the following criteria:
- An IP address range in CIDR format
- A DNS name that resolves to an IP address
20.3.1.1. Limitations of an EgressNetworkPolicy CR
An egress firewall has the following limitations:
-
No project can have more than one
EgressNetworkPolicyCR. The creation of more than oneEgressNetworkPolicyCR is allowed, however; it should not be done. When you create more than one custom resource, you receive the following message:dropping all rules. In actuality, all external traffic is dropped, which can cause security risks for your organization. - You must have OpenShift SDN configured to use either the network policy or multitenant mode to configure an egress firewall. If you use network policy mode, an egress firewall is compatible with only one policy per namespace and will not work with projects that share a network, such as global projects.
-
A maximum of one
EgressNetworkPolicyCR with a maximum of 1,000 rules can be defined per project. -
The
defaultproject cannot use an egress firewall. When using the OpenShift SDN network plugin in multitenant mode, the following limitations apply:
-
Global projects cannot use an egress firewall. You can make a project global by using the
oc adm pod-network make-projects-globalcommand. -
Projects merged by using the
oc adm pod-network join-projectscommand cannot use an egress firewall in any of the joined projects.
-
Global projects cannot use an egress firewall. You can make a project global by using the
-
If you create a selectorless service and manually define endpoints or
EndpointSlicesthat point to external IPs, traffic to the service IP might still be allowed, even if yourEgressNetworkPolicyis configured to deny all egress traffic. This occurs because OpenShift SDN does not fully enforce egress network policies for these external endpoints. Consequently, this might result in unexpected access to external services. - Egress firewall does not apply to the host network namespace. Pods with host networking enabled are unaffected by egress firewall rules.
- Egress firewall rules do not apply to traffic that goes through routers. Any user with permission to create a Route CR object can bypass egress firewall policy rules by creating a route that points to a forbidden destination.
Violating any of these restrictions results in a broken egress firewall for the project. As a result, all external network traffic drops, which can cause security risks for your organization.
You can create an Egress Firewall resource in the kube-node-lease, kube-public, kube-system, openshift and openshift- projects.
20.3.1.2. Matching order for EgressNetworkPolicy CR rules
The OVN-Kubernetes network plugin evaluates egress firewall policy rules based on the first-to-last order of how you defined the rules. The first rule that matches an egress connection from a pod applies. The plugin ignores any subsequent rules for that connection.
20.3.1.3. How Domain Name Server (DNS) resolution works
If you use DNS names in any of your egress firewall policy rules, proper resolution of the domain names is subject to the following restrictions:
- Domain name updates are polled based on a time-to-live (TTL) duration. By default, the duration is 30 seconds. When the egress firewall controller queries the local name servers for a domain name, if the response includes a TTL that is less than 30 seconds, the controller sets the duration to the returned value. If the TTL in the response is greater than 30 minutes, the controller sets the duration to 30 minutes. If the TTL is between 30 seconds and 30 minutes, the controller ignores the value and sets the duration to 30 seconds.
- The pod must resolve the domain from the same local name servers when necessary. Otherwise the IP addresses for the domain known by the egress firewall controller and the pod can be different. If the IP addresses for a hostname differ, consistent enforcement of the egress firewall does not apply.
-
Because the egress firewall controller and pods asynchronously poll the same local name server, the pod might obtain the updated IP address before the egress controller does, which causes a race condition. Due to this current limitation, domain name usage in
EgressNetworkPolicyCR is only recommended for domains with infrequent IP address changes. Using DNS names in your
EgressNetworkPolicyCR does not affect local DNS resolution through CoreDNS.However, if your policy uses domain names, and an external DNS server handles DNS resolution for an affected pod, you must include egress firewall rules that permit access to the IP addresses of your DNS server.
20.3.2. EgressNetworkPolicy custom resource (CR)
You can define one or more rules for an egress firewall. A rule is either an Allow rule or a Deny rule, with a specification for the traffic that the rule applies to.
The following YAML describes an EgressNetworkPolicy CR:
apiVersion: network.openshift.io/v1
kind: EgressNetworkPolicy
metadata:
name:
spec:
egress:
...where:
- <name>
- Specifies the name for your egress firewall policy.
- <egress>
- Specifies a collection of one or more egress network policy rules as described in the following section.
20.3.2.1. EgressNetworkPolicy rules
The user can select either an IP address range in CIDR format, a domain name, or use the nodeSelector to allow or deny egress traffic. The egress stanza expects an array of one or more objects. The following YAML describes an egress firewall rule object.
egress:
- type: <type>
to:
cidrSelector: <cidr>
dnsName: <dns_name>
nodeSelector: <label_name>: <label_value>where:
- <type>
-
Specifies the type of rule. The value must be either
AlloworDeny. - <to>
-
Specifies a stanza describing an egress traffic match rule that specifies the
cidrSelectorfield or thednsNamefield. You cannot use both fields in the same rule. - <cidr_range>
- Specifies an IP address range in CIDR format.
- <dns_name>
- Specifies a DNS domain name.
- <nodeSelector>
-
Specifies labels which are key and value pairs that the user defines. Labels are attached to objects, such as pods. The
nodeSelectorallows for one or more node labels to be selected and attached to pods.
20.3.2.2. Example EgressNetworkPolicy CR objects
The following example defines several egress firewall rules:
apiVersion: network.openshift.io/v1
kind: EgressNetworkPolicy
metadata:
name: default
spec:
egress:
- type: Allow
to:
cidrSelector: 1.2.3.0/24
- type: Allow
to:
dnsName: www.example.com
- type: Deny
to:
cidrSelector: 0.0.0.0/0where:
- <egress>
- Specifies a collection of egress firewall policy rule objects.
20.3.3. Creating an EgressNetworkPolicy custom resource (CR)
As a cluster administrator, you can create an EgressNetworkPolicy CR for a project.
If the project already has an EgressNetworkPolicy object defined, you must edit the existing policy to make changes to the egress firewall rules.
Prerequisites
- A cluster that uses the OpenShift SDN network plugin.
-
Install the OpenShift CLI (
oc). - You must log in to the cluster as a cluster administrator.
Procedure
Create a policy rule:
-
Create a
<policy_name>.yamlfile where<policy_name>describes the egress policy rules. -
Define the
EgressNetworkPolicyin the file.
-
Create a
Create the policy object by entering the following command. Replace
<policy_name>with the name of the policy and<project>with the project that the rule applies to.$ oc create -f <policy_name>.yaml -n <project>Successful output lists the
egressnetworkpolicy.network.openshift.io/v1name and thecreatedstatus.-
Optional: Save the
<policy_name>.yamlfile so that you can make changes later.
20.4. Editing an egress firewall for a project
As a cluster administrator, you can modify network traffic rules for an existing egress firewall.
20.4.1. Viewing an EgressNetworkPolicy custom resource (CR)
You can view an EgressNetworkPolicy CR in your cluster.
Prerequisites
- A cluster using the OpenShift SDN network plugin.
-
Install the OpenShift Command-line Interface (CLI), commonly known as
oc. - You must log in to the cluster.
Procedure
Optional: To view the names of the
EgressNetworkPolicyCRs defined in your cluster, enter the following command:$ oc get egressnetworkpolicy --all-namespacesTo inspect a policy, enter the following command. Replace
<policy_name>with the name of the policy to inspect.$ oc describe egressnetworkpolicy <policy_name>Example output
Name: default Namespace: project1 Created: 20 minutes ago Labels: <none> Annotations: <none> Rule: Allow to 1.2.3.0/24 Rule: Allow to www.example.com Rule: Deny to 0.0.0.0/0
20.5. Editing an egress firewall for a project
As a cluster administrator, you can modify network traffic rules for an existing egress firewall.
OpenShift SDN CNI is deprecated as of OpenShift Container Platform 4.14. As of OpenShift Container Platform 4.15, the network plugin is not an option for new installations. In a subsequent future release, the OpenShift SDN network plugin is planned to be removed and no longer supported. Red Hat will provide bug fixes and support for this feature until it is removed, but this feature will no longer receive enhancements. As an alternative to OpenShift SDN CNI, you can use OVN Kubernetes CNI instead. For more information, see OpenShift SDN CNI removal.
20.5.1. Editing an EgressNetworkPolicy custom resource (CR)
As a cluster administrator, you can update the egress firewall for a project.
Prerequisites
- A cluster using the OpenShift SDN network plugin.
-
Install the OpenShift CLI (
oc). - You must log in to the cluster as a cluster administrator.
Procedure
Find the name of the
EgressNetworkPolicyCR for the project.$ oc get -n <project> egressnetworkpolicyReplace
<project>with the name of the project.Optional: If you did not save a copy of the
EgressNetworkPolicyCR when you created the egress firewall, enter the following command to create a copy.$ oc get -n <project> egressnetworkpolicy <name> -o yaml > <filename>.yamlReplace
<project>with the name of the project. Replace<name>with the name of the object. Replace<filename>with the name of the file to save the YAML to.After making changes to the policy rules, enter the following command to replace the
EgressNetworkPolicyCR.$ oc replace -f <filename>.yamlReplace
<filename>with the name of the file containing the updatedEgressNetworkPolicyCR.
20.6. Removing an egress firewall from a project
As a cluster administrator, you can remove an egress firewall from a project to remove all restrictions on network traffic from the project that leaves the OpenShift Container Platform cluster.
OpenShift SDN CNI is deprecated as of OpenShift Container Platform 4.14. As of OpenShift Container Platform 4.15, the network plugin is not an option for new installations. In a subsequent future release, the OpenShift SDN network plugin is planned to be removed and no longer supported. Red Hat will provide bug fixes and support for this feature until it is removed, but this feature will no longer receive enhancements. As an alternative to OpenShift SDN CNI, you can use OVN Kubernetes CNI instead. For more information, see OpenShift SDN CNI removal.
20.6.1. Removing an EgressNetworkPolicy custom resource (CR)
As a cluster administrator, you can remove an egress firewall from a project.
Prerequisites
- A cluster using the OpenShift SDN network plugin.
-
Install the OpenShift CLI (
oc). - You must log in to the cluster as a cluster administrator.
Procedure
Find the name of the
EgressNetworkPolicyCR for the project.$ oc get -n <project> egressnetworkpolicyReplace
<project>with the name of the project.Enter the following command to delete the
EgressNetworkPolicyCR.$ oc delete -n <project> egressnetworkpolicy <name>Replace
<project>with the name of the project and<name>with the name of the object.
20.7. Considerations for the use of an egress router pod
20.7.1. About an egress router pod
The OpenShift Container Platform egress router pod redirects traffic to a specified remote server from a private source IP address that is not used for any other purpose. An egress router pod can send network traffic to servers that are set up to allow access only from specific IP addresses.
The egress router pod is not intended for every outgoing connection. Creating large numbers of egress router pods can exceed the limits of your network hardware. For example, creating an egress router pod for every project or application could exceed the number of local MAC addresses that the network interface can handle before reverting to filtering MAC addresses in software.
The egress router image is not compatible with Amazon AWS, Azure Cloud, or any other cloud platform that does not support layer 2 manipulations due to their incompatibility with macvlan traffic.
20.7.1.1. Egress router modes
In redirect mode, an egress router pod configures iptables rules to redirect traffic from its own IP address to one or more destination IP addresses. Client pods that need to use the reserved source IP address must be configured to access the service for the egress router rather than connecting directly to the destination IP. You can access the destination service and port from the application pod by using the curl command. For example:
$ curl <router_service_IP> <port>
In HTTP proxy mode, an egress router pod runs as an HTTP proxy on port 8080. This mode only works for clients that are connecting to HTTP-based or HTTPS-based services, but usually requires fewer changes to the client pods to get them to work. Many programs can be told to use an HTTP proxy by setting an environment variable.
In DNS proxy mode, an egress router pod runs as a DNS proxy for TCP-based services from its own IP address to one or more destination IP addresses. To make use of the reserved, source IP address, client pods must be modified to connect to the egress router pod rather than connecting directly to the destination IP address. This modification ensures that external destinations treat traffic as though it were coming from a known source.
Redirect mode works for all services except for HTTP and HTTPS. For HTTP and HTTPS services, use HTTP proxy mode. For TCP-based services with IP addresses or domain names, use DNS proxy mode.
20.7.1.2. Egress router pod implementation
The egress router pod setup is performed by an initialization container. That container runs in a privileged context so that it can configure the macvlan interface and set up iptables rules. After the initialization container finishes setting up the iptables rules, it exits. Next the egress router pod executes the container to handle the egress router traffic. The image used varies depending on the egress router mode.
The environment variables determine which addresses the egress-router image uses. The image configures the macvlan interface to use EGRESS_SOURCE as its IP address, with EGRESS_GATEWAY as the IP address for the gateway.
Network Address Translation (NAT) rules are set up so that connections to the cluster IP address of the pod on any TCP or UDP port are redirected to the same port on IP address specified by the EGRESS_DESTINATION variable.
If only some of the nodes in your cluster are capable of claiming the specified source IP address and using the specified gateway, you can specify a nodeName or nodeSelector to identify which nodes are acceptable.
20.7.1.3. Deployment considerations
An egress router pod adds an additional IP address and MAC address to the primary network interface of the node. As a result, you might need to configure your hypervisor or cloud provider to allow the additional address.
- Red Hat OpenStack Platform (RHOSP)
If you deploy OpenShift Container Platform on RHOSP, you must allow traffic from the IP and MAC addresses of the egress router pod on your OpenStack environment. If you do not allow the traffic, then communication will fail:
$ openstack port set --allowed-address \ ip_address=<ip_address>,mac_address=<mac_address> <neutron_port_uuid>- VMware vSphere
- If you are using VMware vSphere, see the VMware documentation for securing vSphere standard switches. View and change VMware vSphere default settings by selecting the host virtual switch from the vSphere Web Client.
Specifically, ensure that the following are enabled:
20.7.1.4. Failover configuration
To avoid downtime, you can deploy an egress router pod with a Deployment resource, as in the following example. To create a new Service object for the example deployment, use the oc expose deployment/egress-demo-controller command.
apiVersion: apps/v1
kind: Deployment
metadata:
name: egress-demo-controller
spec:
replicas: 1
selector:
matchLabels:
name: egress-router
template:
metadata:
name: egress-router
labels:
name: egress-router
annotations:
pod.network.openshift.io/assign-macvlan: "true"
spec:
initContainers:
...
containers:
...20.8. Deploying an egress router pod in redirect mode
As a cluster administrator, you can deploy an egress router pod that is configured to redirect traffic to specified destination IP addresses.
20.8.1. Egress router pod specification for redirect mode
Define the configuration for an egress router pod in the Pod object. The following YAML describes the fields for the configuration of an egress router pod in redirect mode:
apiVersion: v1
kind: Pod
metadata:
name: egress-1
labels:
name: egress-1
annotations:
pod.network.openshift.io/assign-macvlan: "true"
spec:
initContainers:
- name: egress-router
image: registry.redhat.io/openshift4/ose-egress-router
securityContext:
privileged: true
env:
- name: EGRESS_SOURCE
value: <egress_router>
- name: EGRESS_GATEWAY
value: <egress_gateway>
- name: EGRESS_DESTINATION
value: <egress_destination>
- name: EGRESS_ROUTER_MODE
value: init
containers:
- name: egress-router-wait
image: registry.redhat.io/openshift4/ose-pod- 1
- The annotation tells OpenShift Container Platform to create a macvlan network interface on the primary network interface controller (NIC) and move that macvlan interface into the pod’s network namespace. You must include the quotation marks around the
"true"value. To have OpenShift Container Platform create the macvlan interface on a different NIC interface, set the annotation value to the name of that interface. For example,eth1. - 2
- IP address from the physical network that the node is on that is reserved for use by the egress router pod. Optional: You can include the subnet length, the
/24suffix, so that a proper route to the local subnet is set. If you do not specify a subnet length, then the egress router can access only the host specified with theEGRESS_GATEWAYvariable and no other hosts on the subnet. - 3
- Same value as the default gateway used by the node.
- 4
- External server to direct traffic to. Using this example, connections to the pod are redirected to
203.0.113.25, with a source IP address of192.168.12.99.
Example egress router pod specification
apiVersion: v1
kind: Pod
metadata:
name: egress-multi
labels:
name: egress-multi
annotations:
pod.network.openshift.io/assign-macvlan: "true"
spec:
initContainers:
- name: egress-router
image: registry.redhat.io/openshift4/ose-egress-router
securityContext:
privileged: true
env:
- name: EGRESS_SOURCE
value: 192.168.12.99/24
- name: EGRESS_GATEWAY
value: 192.168.12.1
- name: EGRESS_DESTINATION
value: |
80 tcp 203.0.113.25
8080 tcp 203.0.113.26 80
8443 tcp 203.0.113.26 443
203.0.113.27
- name: EGRESS_ROUTER_MODE
value: init
containers:
- name: egress-router-wait
image: registry.redhat.io/openshift4/ose-pod20.8.2. Egress destination configuration format
When an egress router pod is deployed in redirect mode, you can specify redirection rules by using one or more of the following formats:
-
<port> <protocol> <ip_address>- Incoming connections to the given<port>should be redirected to the same port on the given<ip_address>.<protocol>is eithertcporudp. -
<port> <protocol> <ip_address> <remote_port>- As above, except that the connection is redirected to a different<remote_port>on<ip_address>. -
<ip_address>- If the last line is a single IP address, then any connections on any other port will be redirected to the corresponding port on that IP address. If there is no fallback IP address then connections on other ports are rejected.
In the example that follows several rules are defined:
-
The first line redirects traffic from local port
80to port80on203.0.113.25. -
The second and third lines redirect local ports
8080and8443to remote ports80and443on203.0.113.26. - The last line matches traffic for any ports not specified in the previous rules.
Example configuration
80 tcp 203.0.113.25
8080 tcp 203.0.113.26 80
8443 tcp 203.0.113.26 443
203.0.113.2720.8.3. Deploying an egress router pod in redirect mode
In redirect mode, an egress router pod sets up iptables rules to redirect traffic from its own IP address to one or more destination IP addresses. Client pods that need to use the reserved source IP address must be configured to access the service for the egress router rather than connecting directly to the destination IP. You can access the destination service and port from the application pod by using the curl command. For example:
$ curl <router_service_IP> <port>Prerequisites
-
Install the OpenShift CLI (
oc). -
Log in as a user with
cluster-adminprivileges.
Procedure
- Create an egress router pod.
To ensure that other pods can find the IP address of the egress router pod, create a service to point to the egress router pod, as in the following example:
apiVersion: v1 kind: Service metadata: name: egress-1 spec: ports: - name: http port: 80 - name: https port: 443 type: ClusterIP selector: name: egress-1Your pods can now connect to this service. Their connections are redirected to the corresponding ports on the external server, using the reserved egress IP address.
20.9. Deploying an egress router pod in HTTP proxy mode
As a cluster administrator, you can deploy an egress router pod configured to proxy traffic to specified HTTP and HTTPS-based services.
20.9.1. Egress router pod specification for HTTP mode
Define the configuration for an egress router pod in the Pod object. The following YAML describes the fields for the configuration of an egress router pod in HTTP mode:
apiVersion: v1
kind: Pod
metadata:
name: egress-1
labels:
name: egress-1
annotations:
pod.network.openshift.io/assign-macvlan: "true"
spec:
initContainers:
- name: egress-router
image: registry.redhat.io/openshift4/ose-egress-router
securityContext:
privileged: true
env:
- name: EGRESS_SOURCE
value: <egress-router>
- name: EGRESS_GATEWAY
value: <egress-gateway>
- name: EGRESS_ROUTER_MODE
value: http-proxy
containers:
- name: egress-router-pod
image: registry.redhat.io/openshift4/ose-egress-http-proxy
env:
- name: EGRESS_HTTP_PROXY_DESTINATION
value: |-
...
...- 1
- The annotation tells OpenShift Container Platform to create a macvlan network interface on the primary network interface controller (NIC) and move that macvlan interface into the pod’s network namespace. You must include the quotation marks around the
"true"value. To have OpenShift Container Platform create the macvlan interface on a different NIC interface, set the annotation value to the name of that interface. For example,eth1. - 2
- IP address from the physical network that the node is on that is reserved for use by the egress router pod. Optional: You can include the subnet length, the
/24suffix, so that a proper route to the local subnet is set. If you do not specify a subnet length, then the egress router can access only the host specified with theEGRESS_GATEWAYvariable and no other hosts on the subnet. - 3
- Same value as the default gateway used by the node.
- 4
- A string or YAML multi-line string specifying how to configure the proxy. Note that this is specified as an environment variable in the HTTP proxy container, not with the other environment variables in the init container.
20.9.2. Egress destination configuration format
When an egress router pod is deployed in HTTP proxy mode, you can specify redirection rules by using one or more of the following formats. Each line in the configuration specifies one group of connections to allow or deny:
-
An IP address allows connections to that IP address, such as
192.168.1.1. -
A CIDR range allows connections to that CIDR range, such as
192.168.1.0/24. -
A hostname allows proxying to that host, such as
www.example.com. -
A domain name preceded by
*.allows proxying to that domain and all of its subdomains, such as*.example.com. -
A
!followed by any of the previous match expressions denies the connection instead. -
If the last line is
*, then anything that is not explicitly denied is allowed. Otherwise, anything that is not allowed is denied.
You can also use * to allow connections to all remote destinations.
Example configuration
!*.example.com
!192.168.1.0/24
192.168.2.1
*20.9.3. Deploying an egress router pod in HTTP proxy mode
In HTTP proxy mode, an egress router pod runs as an HTTP proxy on port 8080. This mode only works for clients that are connecting to HTTP-based or HTTPS-based services, but usually requires fewer changes to the client pods to get them to work. Many programs can be told to use an HTTP proxy by setting an environment variable.
Prerequisites
-
Install the OpenShift CLI (
oc). -
Log in as a user with
cluster-adminprivileges.
Procedure
- Create an egress router pod.
To ensure that other pods can find the IP address of the egress router pod, create a service to point to the egress router pod, as in the following example:
apiVersion: v1 kind: Service metadata: name: egress-1 spec: ports: - name: http-proxy port: 80801 type: ClusterIP selector: name: egress-1- 1
- Ensure the
httpport is set to8080.
To configure the client pod (not the egress proxy pod) to use the HTTP proxy, set the
http_proxyorhttps_proxyvariables:apiVersion: v1 kind: Pod metadata: name: app-1 labels: name: app-1 spec: containers: env: - name: http_proxy value: http://egress-1:8080/1 - name: https_proxy value: http://egress-1:8080/ ...- 1
- The service created in the previous step.
NoteUsing the
http_proxyandhttps_proxyenvironment variables is not necessary for all setups. If the above does not create a working setup, then consult the documentation for the tool or software you are running in the pod.
20.10. Deploying an egress router pod in DNS proxy mode
As a cluster administrator, you can deploy an egress router pod configured to proxy traffic to specified DNS names and IP addresses.
20.10.1. Egress router pod specification for DNS mode
Define the configuration for an egress router pod in the Pod object. The following YAML describes the fields for the configuration of an egress router pod in DNS mode:
apiVersion: v1
kind: Pod
metadata:
name: egress-1
labels:
name: egress-1
annotations:
pod.network.openshift.io/assign-macvlan: "true"
spec:
initContainers:
- name: egress-router
image: registry.redhat.io/openshift4/ose-egress-router
securityContext:
privileged: true
env:
- name: EGRESS_SOURCE
value: <egress-router>
- name: EGRESS_GATEWAY
value: <egress-gateway>
- name: EGRESS_ROUTER_MODE
value: dns-proxy
containers:
- name: egress-router-pod
image: registry.redhat.io/openshift4/ose-egress-dns-proxy
securityContext:
privileged: true
env:
- name: EGRESS_DNS_PROXY_DESTINATION
value: |-
...
- name: EGRESS_DNS_PROXY_DEBUG
value: "1"
...- 1
- The annotation tells OpenShift Container Platform to create a macvlan network interface on the primary network interface controller (NIC) and move that macvlan interface into the pod’s network namespace. You must include the quotation marks around the
"true"value. To have OpenShift Container Platform create the macvlan interface on a different NIC interface, set the annotation value to the name of that interface. For example,eth1. - 2
- IP address from the physical network that the node is on that is reserved for use by the egress router pod. Optional: You can include the subnet length, the
/24suffix, so that a proper route to the local subnet is set. If you do not specify a subnet length, then the egress router can access only the host specified with theEGRESS_GATEWAYvariable and no other hosts on the subnet. - 3
- Same value as the default gateway used by the node.
- 4
- Specify a list of one or more proxy destinations.
- 5
- Optional: Specify to output the DNS proxy log output to
stdout.
20.10.2. Egress destination configuration format
When the router is deployed in DNS proxy mode, you specify a list of port and destination mappings. A destination may be either an IP address or a DNS name.
An egress router pod supports the following formats for specifying port and destination mappings:
- Port and remote address
-
You can specify a source port and a destination host by using the two field format:
<port> <remote_address>.
The host can be an IP address or a DNS name. If a DNS name is provided, DNS resolution occurs at runtime. For a given host, the proxy connects to the specified source port on the destination host when connecting to the destination host IP address.
Port and remote address pair example
80 172.16.12.11
100 example.com- Port, remote address, and remote port
-
You can specify a source port, a destination host, and a destination port by using the three field format:
<port> <remote_address> <remote_port>.
The three field format behaves identically to the two field version, with the exception that the destination port can be different than the source port.
Port, remote address, and remote port example
8080 192.168.60.252 80
8443 web.example.com 44320.10.3. Deploying an egress router pod in DNS proxy mode
In DNS proxy mode, an egress router pod acts as a DNS proxy for TCP-based services from its own IP address to one or more destination IP addresses.
Prerequisites
-
Install the OpenShift CLI (
oc). -
Log in as a user with
cluster-adminprivileges.
Procedure
- Create an egress router pod.
Create a service for the egress router pod:
Create a file named
egress-router-service.yamlthat contains the following YAML. Setspec.portsto the list of ports that you defined previously for theEGRESS_DNS_PROXY_DESTINATIONenvironment variable.apiVersion: v1 kind: Service metadata: name: egress-dns-svc spec: ports: ... type: ClusterIP selector: name: egress-dns-proxyFor example:
apiVersion: v1 kind: Service metadata: name: egress-dns-svc spec: ports: - name: con1 protocol: TCP port: 80 targetPort: 80 - name: con2 protocol: TCP port: 100 targetPort: 100 type: ClusterIP selector: name: egress-dns-proxyTo create the service, enter the following command:
$ oc create -f egress-router-service.yamlPods can now connect to this service. The connections are proxied to the corresponding ports on the external server, using the reserved egress IP address.
20.11. Configuring an egress router pod destination list from a config map
As a cluster administrator, you can define a ConfigMap object that specifies destination mappings for an egress router pod. The specific format of the configuration depends on the type of egress router pod. For details on the format, refer to the documentation for the specific egress router pod.
20.11.1. Configuring an egress router destination mappings with a config map
For a large or frequently-changing set of destination mappings, you can use a config map to externally maintain the list. An advantage of this approach is that permission to edit the config map can be delegated to users without cluster-admin privileges. Because the egress router pod requires a privileged container, it is not possible for users without cluster-admin privileges to edit the pod definition directly.
The egress router pod does not automatically update when the config map changes. You must restart the egress router pod to get updates.
Prerequisites
-
Install the OpenShift CLI (
oc). -
Log in as a user with
cluster-adminprivileges.
Procedure
Create a file containing the mapping data for the egress router pod, as in the following example:
# Egress routes for Project "Test", version 3 80 tcp 203.0.113.25 8080 tcp 203.0.113.26 80 8443 tcp 203.0.113.26 443 # Fallback 203.0.113.27You can put blank lines and comments into this file.
Create a
ConfigMapobject from the file:$ oc delete configmap egress-routes --ignore-not-found$ oc create configmap egress-routes \ --from-file=destination=my-egress-destination.txtIn the previous command, the
egress-routesvalue is the name of theConfigMapobject to create andmy-egress-destination.txtis the name of the file that the data is read from.TipYou can alternatively apply the following YAML to create the config map:
apiVersion: v1 kind: ConfigMap metadata: name: egress-routes data: destination: | # Egress routes for Project "Test", version 3 80 tcp 203.0.113.25 8080 tcp 203.0.113.26 80 8443 tcp 203.0.113.26 443 # Fallback 203.0.113.27Create an egress router pod definition and specify the
configMapKeyRefstanza for theEGRESS_DESTINATIONfield in the environment stanza:... env: - name: EGRESS_DESTINATION valueFrom: configMapKeyRef: name: egress-routes key: destination ...
20.12. Enabling multicast for a project
OpenShift SDN CNI is deprecated as of OpenShift Container Platform 4.14. As of OpenShift Container Platform 4.15, the network plugin is not an option for new installations. In a subsequent future release, the OpenShift SDN network plugin is planned to be removed and no longer supported. Red Hat will provide bug fixes and support for this feature until it is removed, but this feature will no longer receive enhancements. As an alternative to OpenShift SDN CNI, you can use OVN Kubernetes CNI instead. For more information, see OpenShift SDN CNI removal.
20.12.1. About multicast
With IP multicast, data is broadcast to many IP addresses simultaneously.
- At this time, multicast is best used for low-bandwidth coordination or service discovery and not a high-bandwidth solution.
-
By default, network policies affect all connections in a namespace. However, multicast is unaffected by network policies. If multicast is enabled in the same namespace as your network policies, it is always allowed, even if there is a
deny-allnetwork policy. Cluster administrators should consider the implications to the exemption of multicast from network policies before enabling it.
Multicast traffic between OpenShift Container Platform pods is disabled by default. If you are using the OpenShift SDN network plugin, you can enable multicast on a per-project basis.
When using the OpenShift SDN network plugin in networkpolicy isolation mode:
-
Multicast packets sent by a pod will be delivered to all other pods in the project, regardless of
NetworkPolicyobjects. Pods might be able to communicate over multicast even when they cannot communicate over unicast. -
Multicast packets sent by a pod in one project will never be delivered to pods in any other project, even if there are
NetworkPolicyobjects that allow communication between the projects.
When using the OpenShift SDN network plugin in multitenant isolation mode:
- Multicast packets sent by a pod will be delivered to all other pods in the project.
- Multicast packets sent by a pod in one project will be delivered to pods in other projects only if each project is joined together and multicast is enabled in each joined project.
20.12.2. Enabling multicast between pods
You can enable multicast between pods for your project.
Prerequisites
-
Install the OpenShift CLI (
oc). -
You must log in to the cluster with a user that has the
cluster-adminrole.
Procedure
Run the following command to enable multicast for a project. Replace
<namespace>with the namespace for the project you want to enable multicast for.$ oc annotate netnamespace <namespace> \ netnamespace.network.openshift.io/multicast-enabled=true
Verification
To verify that multicast is enabled for a project, complete the following procedure:
Change your current project to the project that you enabled multicast for. Replace
<project>with the project name.$ oc project <project>Create a pod to act as a multicast receiver:
$ cat <<EOF| oc create -f - apiVersion: v1 kind: Pod metadata: name: mlistener labels: app: multicast-verify spec: containers: - name: mlistener image: registry.access.redhat.com/ubi9 command: ["/bin/sh", "-c"] args: ["dnf -y install socat hostname && sleep inf"] ports: - containerPort: 30102 name: mlistener protocol: UDP EOFCreate a pod to act as a multicast sender:
$ cat <<EOF| oc create -f - apiVersion: v1 kind: Pod metadata: name: msender labels: app: multicast-verify spec: containers: - name: msender image: registry.access.redhat.com/ubi9 command: ["/bin/sh", "-c"] args: ["dnf -y install socat && sleep inf"] EOFIn a new terminal window or tab, start the multicast listener.
Get the IP address for the Pod:
$ POD_IP=$(oc get pods mlistener -o jsonpath='{.status.podIP}')Start the multicast listener by entering the following command:
$ oc exec mlistener -i -t -- \ socat UDP4-RECVFROM:30102,ip-add-membership=224.1.0.1:$POD_IP,fork EXEC:hostname
Start the multicast transmitter.
Get the pod network IP address range:
$ CIDR=$(oc get Network.config.openshift.io cluster \ -o jsonpath='{.status.clusterNetwork[0].cidr}')To send a multicast message, enter the following command:
$ oc exec msender -i -t -- \ /bin/bash -c "echo | socat STDIO UDP4-DATAGRAM:224.1.0.1:30102,range=$CIDR,ip-multicast-ttl=64"If multicast is working, the previous command returns the following output:
mlistener
20.13. Disabling multicast for a project
20.13.1. Disabling multicast between pods
You can disable multicast between pods for your project.
Prerequisites
-
Install the OpenShift CLI (
oc). -
You must log in to the cluster with a user that has the
cluster-adminrole.
Procedure
Disable multicast by running the following command:
$ oc annotate netnamespace <namespace> \1 netnamespace.network.openshift.io/multicast-enabled-- 1
- The
namespacefor the project you want to disable multicast for.
20.14. Configuring network isolation using OpenShift SDN
OpenShift SDN CNI is deprecated as of OpenShift Container Platform 4.14. As of OpenShift Container Platform 4.15, the network plugin is not an option for new installations. In a subsequent future release, the OpenShift SDN network plugin is planned to be removed and no longer supported. Red Hat will provide bug fixes and support for this feature until it is removed, but this feature will no longer receive enhancements. As an alternative to OpenShift SDN CNI, you can use OVN Kubernetes CNI instead. For more information, see OpenShift SDN CNI removal.
When your cluster is configured to use the multitenant isolation mode for the OpenShift SDN network plugin, each project is isolated by default. Network traffic is not allowed between pods or services in different projects in multitenant isolation mode.
You can change the behavior of multitenant isolation for a project in two ways:
- You can join one or more projects, allowing network traffic between pods and services in different projects.
- You can disable network isolation for a project. It will be globally accessible, accepting network traffic from pods and services in all other projects. A globally accessible project can access pods and services in all other projects.
20.14.1. Prerequisites
- You must have a cluster configured to use the OpenShift SDN network plugin in multitenant isolation mode.
20.14.2. Joining projects
You can join two or more projects to allow network traffic between pods and services in different projects.
Prerequisites
-
Install the OpenShift CLI (
oc). -
You must log in to the cluster with a user that has the
cluster-adminrole.
Procedure
Use the following command to join projects to an existing project network:
$ oc adm pod-network join-projects --to=<project1> <project2> <project3>Alternatively, instead of specifying specific project names, you can use the
--selector=<project_selector>option to specify projects based upon an associated label.Optional: Run the following command to view the pod networks that you have joined together:
$ oc get netnamespacesProjects in the same pod-network have the same network ID in the NETID column.
20.14.3. Isolating a project
You can isolate a project so that pods and services in other projects cannot access its pods and services.
Prerequisites
-
Install the OpenShift CLI (
oc). -
You must log in to the cluster with a user that has the
cluster-adminrole.
Procedure
To isolate the projects in the cluster, run the following command:
$ oc adm pod-network isolate-projects <project1> <project2>Alternatively, instead of specifying specific project names, you can use the
--selector=<project_selector>option to specify projects based upon an associated label.
20.14.4. Disabling network isolation for a project
You can disable network isolation for a project.
Prerequisites
-
Install the OpenShift CLI (
oc). -
You must log in to the cluster with a user that has the
cluster-adminrole.
Procedure
Run the following command for the project:
$ oc adm pod-network make-projects-global <project1> <project2>Alternatively, instead of specifying specific project names, you can use the
--selector=<project_selector>option to specify projects based upon an associated label.
20.15. Configuring kube-proxy
The Kubernetes network proxy (kube-proxy) runs on each node and is managed by the Cluster Network Operator (CNO). kube-proxy maintains network rules for forwarding connections for endpoints associated with services.
20.15.1. About iptables rules synchronization
The synchronization period determines how frequently the Kubernetes network proxy (kube-proxy) syncs the iptables rules on a node.
A sync begins when either of the following events occurs:
- An event occurs, such as service or endpoint is added to or removed from the cluster.
- The time since the last sync exceeds the sync period defined for kube-proxy.
20.15.2. kube-proxy configuration parameters
You can modify the following kubeProxyConfig parameters.
Because of performance improvements introduced in OpenShift Container Platform 4.3 and greater, adjusting the iptablesSyncPeriod parameter is no longer necessary.
| Parameter | Description | Values | Default |
|---|---|---|---|
|
|
The refresh period for |
A time interval, such as |
|
|
|
The minimum duration before refreshing |
A time interval, such as |
|
20.15.3. Modifying the kube-proxy configuration
You can modify the Kubernetes network proxy configuration for your cluster.
Prerequisites
-
Install the OpenShift CLI (
oc). -
Log in to a running cluster with the
cluster-adminrole.
Procedure
Edit the
Network.operator.openshift.iocustom resource (CR) by running the following command:$ oc edit network.operator.openshift.io clusterModify the
kubeProxyConfigparameter in the CR with your changes to the kube-proxy configuration, such as in the following example CR:apiVersion: operator.openshift.io/v1 kind: Network metadata: name: cluster spec: kubeProxyConfig: iptablesSyncPeriod: 30s proxyArguments: iptables-min-sync-period: ["30s"]Save the file and exit the text editor.
The syntax is validated by the
occommand when you save the file and exit the editor. If your modifications contain a syntax error, the editor opens the file and displays an error message.Enter the following command to confirm the configuration update:
$ oc get networks.operator.openshift.io -o yamlExample output
apiVersion: v1 items: - apiVersion: operator.openshift.io/v1 kind: Network metadata: name: cluster spec: clusterNetwork: - cidr: 10.128.0.0/14 hostPrefix: 23 defaultNetwork: type: OpenShiftSDN kubeProxyConfig: iptablesSyncPeriod: 30s proxyArguments: iptables-min-sync-period: - 30s serviceNetwork: - 172.30.0.0/16 status: {} kind: ListOptional: Enter the following command to confirm that the Cluster Network Operator accepted the configuration change:
$ oc get clusteroperator networkExample output
NAME VERSION AVAILABLE PROGRESSING DEGRADED SINCE network 4.1.0-0.9 True False False 1mThe
AVAILABLEfield isTruewhen the configuration update is applied successfully.
Chapter 21. Configuring routes
21.1. Creating basic routes
If you have unencrypted HTTP, you can create a basic route with a route object.
21.1.1. Creating an HTTP-based route
You can use the following procedure to create a simple HTTP-based route to a web application, using the hello-openshift application as an example.
You can create a route to host your application at a public URL. The route can either be secure or unsecured, depending on the network security configuration of your application. An HTTP-based route is an unsecured route that uses the basic HTTP routing protocol and exposes a service on an unsecured application port.
Prerequisites
-
You installed the OpenShift CLI (
oc). - You are logged in as an administrator.
- You have a web application that exposes a port and a TCP endpoint listening for traffic on the port.
Procedure
Create a project called
hello-openshiftby running the following command:$ oc new-project hello-openshiftCreate a pod in the project by running the following command:
$ oc create -f https://raw.githubusercontent.com/openshift/origin/master/examples/hello-openshift/hello-pod.jsonCreate a service called
hello-openshiftby running the following command:$ oc expose pod/hello-openshiftCreate an unsecured route to the
hello-openshiftapplication by running the following command:$ oc expose svc hello-openshift
Verification
To verify that the
routeresource that you created, run the following command:$ oc get routes -o yaml hello-openshiftExample YAML definition of the created unsecured route
apiVersion: route.openshift.io/v1 kind: Route metadata: name: hello-openshift spec: host: www.example.com port: targetPort: 8080 to: kind: Service name: hello-openshiftwhere:
host-
Specifies an alias DNS record that points to the service. This field can be any valid DNS name, such as
www.example.com. The DNS name must follow DNS952 subdomain conventions. If not specified, a route name is automatically generated. targetPortSpecifies the target port on pods that is selected by the service that this route points to.
NoteTo display your default ingress domain, run the following command:
$ oc get ingresses.config/cluster -o jsonpath={.spec.domain}
21.1.2. Path-based routes
Path-based routes specify a path component that can be compared against a URL, which requires that the traffic for the route be HTTP based. Thus, multiple routes can be served using the same hostname, each with a different path. Routers should match routes based on the most specific path to the least.
The following table shows example routes and their accessibility:
| Route | When Compared to | Accessible |
|---|---|---|
| www.example.com/test | www.example.com/test | Yes |
| www.example.com | No | |
| www.example.com/test and www.example.com | www.example.com/test | Yes |
| www.example.com | Yes | |
| www.example.com | www.example.com/text | Yes (Matched by the host, not the route) |
| www.example.com | Yes |
An unsecured route with a path
apiVersion: route.openshift.io/v1
kind: Route
metadata:
name: route-unsecured
spec:
host: www.example.com
path: "/test"
to:
kind: Service
name: service-name- Specifies the path that is the only added attribute for a path-based route.
Path-based routing is not available when using passthrough TLS, as the router does not terminate TLS in that case and cannot read the contents of the request.
21.1.3. Creating a route for Ingress Controller sharding
To host applications at specific URLs and balance traffic load in OpenShift Container Platform, configure Ingress Controller sharding. By sharding, you can isolate traffic for specific workloads or tenants, ensuring efficient resource management across your cluster.
The following procedure describes how to create a route for Ingress Controller sharding, using the hello-openshift application as an example.
Prerequisites
-
You installed the OpenShift CLI (
oc). - You are logged in as a project administrator.
- You have a web application that exposes a port and an HTTP or TLS endpoint listening for traffic on the port.
- You have configured the Ingress Controller for sharding.
Procedure
Create a project called
hello-openshiftby running the following command:$ oc new-project hello-openshiftCreate a pod in the project by running the following command:
$ oc create -f https://raw.githubusercontent.com/openshift/origin/master/examples/hello-openshift/hello-pod.jsonCreate a service called
hello-openshiftby running the following command:$ oc expose pod/hello-openshiftCreate a route definition called
hello-openshift-route.yaml:YAML definition of the created route for sharding
apiVersion: route.openshift.io/v1 kind: Route metadata: labels: type: sharded name: hello-openshift-edge namespace: hello-openshift spec: subdomain: hello-openshift tls: termination: edge to: kind: Service name: hello-openshiftwhere:
type-
Specifies both the label key and its corresponding label value must match the ones specified in the Ingress Controller. In this example, the Ingress Controller has the label key and value
type: sharded. subdomain-
Specifies the route gets exposed by using the value of the
subdomainfield. When you specify thesubdomainfield, you must leave the hostname unset. If you specify both thehostandsubdomainfields, then the route uses the value of thehostfield, and ignore thesubdomainfield.
Use
hello-openshift-route.yamlto create a route to thehello-openshiftapplication by running the following command:$ oc -n hello-openshift create -f hello-openshift-route.yaml
Verification
Get the status of the route with the following command:
$ oc -n hello-openshift get routes/hello-openshift-edge -o yamlThe resulting
Routeresource should look similar to the following:Example output
apiVersion: route.openshift.io/v1 kind: Route metadata: labels: type: sharded name: hello-openshift-edge namespace: hello-openshift spec: subdomain: hello-openshift tls: termination: edge to: kind: Service name: hello-openshift status: ingress: - host: hello-openshift.<apps-sharded.basedomain.example.net> routerCanonicalHostname: router-sharded.<apps-sharded.basedomain.example.net> routerName: shardedwhere:
host-
Specifies the hostname the Ingress Controller, or router, uses to expose the route. The value of the
hostfield is automatically determined by the Ingress Controller, and uses its domain. In this example, the domain of the Ingress Controller is<apps-sharded.basedomain.example.net>. <apps-sharded.basedomain.example.net>- Specifies the hostname of the Ingress Controller. If the hostname is not set, the route can use a subdomain instead. When you specify a subdomain, you automatically use the domain of the Ingress Controller that exposes the route. When a route is exposed by multiple Ingress Controllers, the route is hosted at multiple URLs.
routerName-
Specifies the name of the Ingress Controller. In this example, the Ingress Controller has the name
sharded.
21.1.4. Creating a route through an Ingress object
Some ecosystem components have an integration with Ingress resources but not with route resources. To cover this case, OpenShift Container Platform automatically creates managed route objects when an Ingress object is created. These route objects are deleted when the corresponding Ingress objects are deleted.
Procedure
Define an Ingress object in the OpenShift Container Platform console or by entering the
oc createcommand:YAML Definition of an Ingress
apiVersion: networking.k8s.io/v1 kind: Ingress metadata: name: frontend annotations: route.openshift.io/termination: "reencrypt"1 route.openshift.io/destination-ca-certificate-secret: secret-ca-cert2 spec: rules: - host: www.example.com3 http: paths: - backend: service: name: frontend port: number: 443 path: / pathType: Prefix tls: - hosts: - www.example.com secretName: example-com-tls-certificate- 1
- The
route.openshift.io/terminationannotation can be used to configure thespec.tls.terminationfield of theRouteasIngresshas no field for this. The accepted values areedge,passthroughandreencrypt. All other values are silently ignored. When the annotation value is unset,edgeis the default route. The TLS certificate details must be defined in the template file to implement the default edge route. - 3
- When working with an
Ingressobject, you must specify an explicit hostname, unlike when working with routes. You can use the<host_name>.<cluster_ingress_domain>syntax, for exampleapps.openshiftdemos.com, to take advantage of the*.<cluster_ingress_domain>wildcard DNS record and serving certificate for the cluster. Otherwise, you must ensure that there is a DNS record for the chosen hostname.If you specify the
passthroughvalue in theroute.openshift.io/terminationannotation, setpathto''andpathTypetoImplementationSpecificin the spec:spec: rules: - host: www.example.com http: paths: - path: '' pathType: ImplementationSpecific backend: service: name: frontend port: number: 443$ oc apply -f ingress.yaml
- 2
- The
route.openshift.io/destination-ca-certificate-secretcan be used on an Ingress object to define a route with a custom destination certificate (CA). The annotation references a kubernetes secret,secret-ca-certthat will be inserted into the generated route.-
To specify a route object with a destination CA from an ingress object, you must create a
kubernetes.io/tlsorOpaquetype secret with a certificate in PEM-encoded format in thedata.tls.crtspecifier of the secret.
-
To specify a route object with a destination CA from an ingress object, you must create a
List your routes:
$ oc get routesThe result includes an autogenerated route whose name starts with
frontend-:NAME HOST/PORT PATH SERVICES PORT TERMINATION WILDCARD frontend-gnztq www.example.com frontend 443 reencrypt/Redirect NoneIf you inspect this route, it looks this:
YAML Definition of an autogenerated route
apiVersion: route.openshift.io/v1 kind: Route metadata: name: frontend-gnztq ownerReferences: - apiVersion: networking.k8s.io/v1 controller: true kind: Ingress name: frontend uid: 4e6c59cc-704d-4f44-b390-617d879033b6 spec: host: www.example.com path: / port: targetPort: https tls: certificate: | -----BEGIN CERTIFICATE----- [...] -----END CERTIFICATE----- insecureEdgeTerminationPolicy: Redirect key: | -----BEGIN RSA PRIVATE KEY----- [...] -----END RSA PRIVATE KEY----- termination: reencrypt destinationCACertificate: | -----BEGIN CERTIFICATE----- [...] -----END CERTIFICATE----- to: kind: Service name: frontend
21.2. Securing routes
You can secure a route with HTTP strict transport security (HSTS).
21.2.1. HTTP Strict Transport Security
HTTP Strict Transport Security (HSTS) policy is a security enhancement, which signals to the browser client that only HTTPS traffic is allowed on the route host. HSTS also optimizes web traffic by signaling HTTPS transport is required, without using HTTP redirects. HSTS is useful for speeding up interactions with websites.
When HSTS policy is enforced, HSTS adds a Strict Transport Security header to HTTP and HTTPS responses from the site. You can use the insecureEdgeTerminationPolicy value in a route to redirect HTTP to HTTPS. When HSTS is enforced, the client changes all requests from the HTTP URL to HTTPS before the request is sent, eliminating the need for a redirect.
Cluster administrators can configure HSTS to do the following:
- Enable HSTS per-route
- Disable HSTS per-route
- Enforce HSTS per-domain, for a set of domains, or use namespace labels in combination with domains
HSTS works only with secure routes, either edge-terminated or re-encrypt. The configuration is ineffective on HTTP or passthrough routes.
21.2.1.1. Enabling HTTP Strict Transport Security per-route
HTTP strict transport security (HSTS) is implemented in the HAProxy template and applied to edge and re-encrypt routes that have the haproxy.router.openshift.io/hsts_header annotation.
Prerequisites
- You are logged in to the cluster with a user with administrator privileges for the project.
-
You installed the OpenShift CLI (
oc).
Procedure
To enable HSTS on a route, add the
haproxy.router.openshift.io/hsts_headervalue to the edge-terminated or re-encrypt route. You can use theoc annotatetool to do this by running the following command:$ oc annotate route <route_name> -n <namespace> --overwrite=true "haproxy.router.openshift.io/hsts_header"="max-age=31536000;\1 includeSubDomains;preload"- 1
- In this example, the maximum age is set to
31536000ms, which is approximately 8.5 hours.
NoteIn this example, the equal sign (
=) is in quotes. This is required to properly execute the annotate command.Example route configured with an annotation
apiVersion: route.openshift.io/v1 kind: Route metadata: annotations: haproxy.router.openshift.io/hsts_header: max-age=31536000;includeSubDomains;preload1 2 3 ... spec: host: def.abc.com tls: termination: "reencrypt" ... wildcardPolicy: "Subdomain"- 1
- Required.
max-agemeasures the length of time, in seconds, that the HSTS policy is in effect. If set to0, it negates the policy. - 2
- Optional. When included,
includeSubDomainstells the client that all subdomains of the host must have the same HSTS policy as the host. - 3
- Optional. When
max-ageis greater than 0, you can addpreloadinhaproxy.router.openshift.io/hsts_headerto allow external services to include this site in their HSTS preload lists. For example, sites such as Google can construct a list of sites that havepreloadset. Browsers can then use these lists to determine which sites they can communicate with over HTTPS, even before they have interacted with the site. Withoutpreloadset, browsers must have interacted with the site over HTTPS, at least once, to get the header.
21.2.1.2. Disabling HTTP Strict Transport Security per-route
To disable HTTP strict transport security (HSTS) per-route, you can set the max-age value in the route annotation to 0.
Prerequisites
- You are logged in to the cluster with a user with administrator privileges for the project.
-
You installed the OpenShift CLI (
oc).
Procedure
To disable HSTS, set the
max-agevalue in the route annotation to0, by entering the following command:$ oc annotate route <route_name> -n <namespace> --overwrite=true "haproxy.router.openshift.io/hsts_header"="max-age=0"TipYou can alternatively apply the following YAML to create the config map for disabling HSTS per-route:
metadata: annotations: haproxy.router.openshift.io/hsts_header: max-age=0To disable HSTS for every route in a namespace, enter the following command:
$ oc annotate route --all -n <namespace> --overwrite=true "haproxy.router.openshift.io/hsts_header"="max-age=0"
Verification
To query the annotation for all routes, enter the following command:
$ oc get route --all-namespaces -o go-template='{{range .items}}{{if .metadata.annotations}}{{$a := index .metadata.annotations "haproxy.router.openshift.io/hsts_header"}}{{$n := .metadata.name}}{{with $a}}Name: {{$n}} HSTS: {{$a}}{{"\n"}}{{else}}{{""}}{{end}}{{end}}{{end}}'Example output
Name: routename HSTS: max-age=0
21.2.1.3. Enforcing HTTP Strict Transport Security per-domain
To enforce HTTP Strict Transport Security (HSTS) per-domain for secure routes, add a requiredHSTSPolicies record to the Ingress spec to capture the configuration of the HSTS policy.
If you configure a requiredHSTSPolicy to enforce HSTS, then any newly created route must be configured with a compliant HSTS policy annotation.
To handle upgraded clusters with non-compliant HSTS routes, you can update the manifests at the source and apply the updates.
You cannot use oc expose route or oc create route commands to add a route in a domain that enforces HSTS, because the API for these commands does not accept annotations.
HSTS cannot be applied to insecure, or non-TLS routes, even if HSTS is requested for all routes globally.
Prerequisites
- You are logged in to the cluster with a user with administrator privileges for the project.
-
You installed the OpenShift CLI (
oc).
Procedure
Edit the Ingress configuration YAML by running the following command and updating fields as needed:
$ oc edit ingresses.config.openshift.io/clusterExample HSTS policy
apiVersion: config.openshift.io/v1 kind: Ingress metadata: name: cluster spec: domain: 'hello-openshift-default.apps.username.devcluster.openshift.com' requiredHSTSPolicies:1 - domainPatterns:2 - '*hello-openshift-default.apps.username.devcluster.openshift.com' - '*hello-openshift-default2.apps.username.devcluster.openshift.com' namespaceSelector:3 matchLabels: myPolicy: strict maxAge:4 smallestMaxAge: 1 largestMaxAge: 31536000 preloadPolicy: RequirePreload5 includeSubDomainsPolicy: RequireIncludeSubDomains6 - domainPatterns: - 'abc.example.com' - '*xyz.example.com' namespaceSelector: matchLabels: {} maxAge: {} preloadPolicy: NoOpinion includeSubDomainsPolicy: RequireNoIncludeSubDomains- 1
- Required.
requiredHSTSPoliciesare validated in order, and the first matchingdomainPatternsapplies. - 2
- Required. You must specify at least one
domainPatternshostname. Any number of domains can be listed. You can include multiple sections of enforcing options for differentdomainPatterns. - 3
- Optional. If you include
namespaceSelector, it must match the labels of the project where the routes reside, to enforce the set HSTS policy on the routes. Routes that only match thenamespaceSelectorand not thedomainPatternsare not validated. - 4
- Required.
max-agemeasures the length of time, in seconds, that the HSTS policy is in effect. This policy setting allows for a smallest and largestmax-ageto be enforced.-
The
largestMaxAgevalue must be between0and2147483647. It can be left unspecified, which means no upper limit is enforced. -
The
smallestMaxAgevalue must be between0and2147483647. Enter0to disable HSTS for troubleshooting, otherwise enter1if you never want HSTS to be disabled. It can be left unspecified, which means no lower limit is enforced.
-
The
- 5
- Optional. Including
preloadinhaproxy.router.openshift.io/hsts_headerallows external services to include this site in their HSTS preload lists. Browsers can then use these lists to determine which sites they can communicate with over HTTPS, before they have interacted with the site. Withoutpreloadset, browsers need to interact at least once with the site to get the header.preloadcan be set with one of the following:-
RequirePreload:preloadis required by theRequiredHSTSPolicy. -
RequireNoPreload:preloadis forbidden by theRequiredHSTSPolicy. -
NoOpinion:preloaddoes not matter to theRequiredHSTSPolicy.
-
- 6
- Optional.
includeSubDomainsPolicycan be set with one of the following:-
RequireIncludeSubDomains:includeSubDomainsis required by theRequiredHSTSPolicy. -
RequireNoIncludeSubDomains:includeSubDomainsis forbidden by theRequiredHSTSPolicy. -
NoOpinion:includeSubDomainsdoes not matter to theRequiredHSTSPolicy.
-
You can apply HSTS to all routes in the cluster or in a particular namespace by entering the
oc annotate command.To apply HSTS to all routes in the cluster, enter the
oc annotate command. For example:$ oc annotate route --all --all-namespaces --overwrite=true "haproxy.router.openshift.io/hsts_header"="max-age=31536000"To apply HSTS to all routes in a particular namespace, enter the
oc annotate command. For example:$ oc annotate route --all -n my-namespace --overwrite=true "haproxy.router.openshift.io/hsts_header"="max-age=31536000"
Verification
You can review the HSTS policy you configured. For example:
To review the
maxAgeset for required HSTS policies, enter the following command:$ oc get clusteroperator/ingress -n openshift-ingress-operator -o jsonpath='{range .spec.requiredHSTSPolicies[*]}{.spec.requiredHSTSPolicies.maxAgePolicy.largestMaxAge}{"\n"}{end}'To review the HSTS annotations on all routes, enter the following command:
$ oc get route --all-namespaces -o go-template='{{range .items}}{{if .metadata.annotations}}{{$a := index .metadata.annotations "haproxy.router.openshift.io/hsts_header"}}{{$n := .metadata.name}}{{with $a}}Name: {{$n}} HSTS: {{$a}}{{"\n"}}{{else}}{{""}}{{end}}{{end}}{{end}}'Example output
Name: <_routename_> HSTS: max-age=31536000;preload;includeSubDomains
21.3. Configuring routes
You can use annotations, headers, cookies, and more to customize your route configuration.
21.3.1. Configuring route timeouts
You can configure the default timeouts for an existing route when you have services in need of a low timeout, which is required for Service Level Availability (SLA) purposes, or a high timeout, for cases with a slow back end.
If you configured a user-managed external load balancer in front of your OpenShift Container Platform cluster, ensure that the timeout value for the user-managed external load balancer is higher than the timeout value for the route. This configuration prevents network congestion issues over the network that your cluster uses.
Prerequisites
- You deployed an Ingress Controller on a running cluster.
Procedure
Using the
oc annotatecommand, add the timeout to the route:$ oc annotate route <route_name> \ --overwrite haproxy.router.openshift.io/timeout=<timeout><time_unit><timeout>: Supported time units are microseconds (us), milliseconds (ms), seconds (s), minutes (m), hours (h), or days (d).The following example sets a timeout of two seconds on a route named
myroute:$ oc annotate route myroute --overwrite haproxy.router.openshift.io/timeout=2s
21.3.2. HTTP header configuration
OpenShift Container Platform provides different methods for working with HTTP headers. When setting or deleting headers, you can use specific fields in the Ingress Controller or an individual route to modify request and response headers. You can also set certain headers by using route annotations. The various ways of configuring headers can present challenges when working together.
You can only set or delete headers within an IngressController or Route CR, you cannot append them. If an HTTP header is set with a value, that value must be complete and not require appending in the future. In situations where it makes sense to append a header, such as the X-Forwarded-For header, use the spec.httpHeaders.forwardedHeaderPolicy field, instead of spec.httpHeaders.actions.
21.3.2.1. Order of precedence
When the same HTTP header is modified both in the Ingress Controller and in a route, HAProxy prioritizes the actions in certain ways depending on whether it is a request or response header.
- For HTTP response headers, actions specified in the Ingress Controller are executed after the actions specified in a route. This means that the actions specified in the Ingress Controller take precedence.
- For HTTP request headers, actions specified in a route are executed after the actions specified in the Ingress Controller. This means that the actions specified in the route take precedence.
For example, a cluster administrator sets the X-Frame-Options response header with the value DENY in the Ingress Controller using the following configuration:
Example IngressController spec
apiVersion: operator.openshift.io/v1
kind: IngressController
# ...
spec:
httpHeaders:
actions:
response:
- name: X-Frame-Options
action:
type: Set
set:
value: DENY
A route owner sets the same response header that the cluster administrator set in the Ingress Controller, but with the value SAMEORIGIN using the following configuration:
Example Route spec
apiVersion: route.openshift.io/v1
kind: Route
# ...
spec:
httpHeaders:
actions:
response:
- name: X-Frame-Options
action:
type: Set
set:
value: SAMEORIGIN
When both the IngressController spec and Route spec are configuring the X-Frame-Options response header, then the value set for this header at the global level in the Ingress Controller takes precedence, even if a specific route allows frames. For a request header, the Route spec value overrides the IngressController spec value.
This prioritization occurs because the haproxy.config file uses the following logic, where the Ingress Controller is considered the front end and individual routes are considered the back end. The header value DENY applied to the front end configurations overrides the same header with the value SAMEORIGIN that is set in the back end:
frontend public
http-response set-header X-Frame-Options 'DENY'
frontend fe_sni
http-response set-header X-Frame-Options 'DENY'
frontend fe_no_sni
http-response set-header X-Frame-Options 'DENY'
backend be_secure:openshift-monitoring:alertmanager-main
http-response set-header X-Frame-Options 'SAMEORIGIN'Additionally, any actions defined in either the Ingress Controller or a route override values set using route annotations.
21.3.2.2. Special case headers
The following headers are either prevented entirely from being set or deleted, or allowed under specific circumstances:
| Header name | Configurable using IngressController spec | Configurable using Route spec | Reason for disallowment | Configurable using another method |
|---|---|---|---|---|
|
| No | No |
The | No |
|
| No | Yes |
When the | No |
|
| No | No |
The |
Yes: the |
|
| No | No | The cookies that HAProxy sets are used for session tracking to map client connections to particular back-end servers. Allowing these headers to be set could interfere with HAProxy’s session affinity and restrict HAProxy’s ownership of a cookie. | Yes:
|
21.3.3. Setting or deleting HTTP request and response headers in a route
You can set or delete certain HTTP request and response headers for compliance purposes or other reasons. You can set or delete these headers either for all routes served by an Ingress Controller or for specific routes.
For example, you might want to enable a web application to serve content in alternate locations for specific routes if that content is written in multiple languages, even if there is a default global location specified by the Ingress Controller serving the routes.
The following procedure creates a route that sets the Content-Location HTTP request header so that the URL associated with the application, https://app.example.com, directs to the location https://app.example.com/lang/en-us. Directing application traffic to this location means that anyone using that specific route is accessing web content written in American English.
Prerequisites
-
You have installed the OpenShift CLI (
oc). - You are logged into an OpenShift Container Platform cluster as a project administrator.
- You have a web application that exposes a port and an HTTP or TLS endpoint listening for traffic on the port.
Procedure
Create a route definition and save it in a file called
app-example-route.yaml:YAML definition of the created route with HTTP header directives
apiVersion: route.openshift.io/v1 kind: Route # ... spec: host: app.example.com tls: termination: edge to: kind: Service name: app-example httpHeaders: actions:1 response:2 - name: Content-Location3 action: type: Set4 set: value: /lang/en-us5 - 1
- The list of actions you want to perform on the HTTP headers.
- 2
- The type of header you want to change. In this case, a response header.
- 3
- The name of the header you want to change. For a list of available headers you can set or delete, see HTTP header configuration.
- 4
- The type of action being taken on the header. This field can have the value
SetorDelete. - 5
- When setting HTTP headers, you must provide a
value. The value can be a string from a list of available directives for that header, for exampleDENY, or it can be a dynamic value that will be interpreted using HAProxy’s dynamic value syntax. In this case, the value is set to the relative location of the content.
Create a route to your existing web application using the newly created route definition:
$ oc -n app-example create -f app-example-route.yaml
For HTTP request headers, the actions specified in the route definitions are executed after any actions performed on HTTP request headers in the Ingress Controller. This means that any values set for those request headers in a route will take precedence over the ones set in the Ingress Controller. For more information on the processing order of HTTP headers, see HTTP header configuration.
21.3.4. Using cookies to keep route statefulness
OpenShift Container Platform provides sticky sessions, which enables stateful application traffic by ensuring all traffic hits the same endpoint. However, if the endpoint pod terminates, whether through restart, scaling, or a change in configuration, this statefulness can disappear.
OpenShift Container Platform can use cookies to configure session persistence. The ingress controller selects an endpoint to handle any user requests, and creates a cookie for the session. The cookie is passed back in the response to the request and the user sends the cookie back with the next request in the session. The cookie tells the ingress controller which endpoint is handling the session, ensuring that client requests use the cookie so that they are routed to the same pod.
Cookies cannot be set on passthrough routes, because the HTTP traffic cannot be seen. Instead, a number is calculated based on the source IP address, which determines the backend.
If backends change, the traffic can be directed to the wrong server, making it less sticky. If you are using a load balancer, which hides source IP, the same number is set for all connections and traffic is sent to the same pod.
21.3.4.1. Annotating a route with a cookie
You can set a cookie name to overwrite the default, auto-generated one for the route. This allows the application receiving route traffic to know the cookie name. Deleting the cookie can force the next request to re-choose an endpoint. The result is that if a server is overloaded, that server tries to remove the requests from the client and redistribute them.
Procedure
Annotate the route with the specified cookie name:
$ oc annotate route <route_name> router.openshift.io/cookie_name="<cookie_name>"where:
<route_name>- Specifies the name of the route.
<cookie_name>- Specifies the name for the cookie.
For example, to annotate the route
my_routewith the cookie namemy_cookie:$ oc annotate route my_route router.openshift.io/cookie_name="my_cookie"Capture the route hostname in a variable:
$ ROUTE_NAME=$(oc get route <route_name> -o jsonpath='{.spec.host}')where:
<route_name>- Specifies the name of the route.
Save the cookie, and then access the route:
$ curl $ROUTE_NAME -k -c /tmp/cookie_jarUse the cookie saved by the previous command when connecting to the route:
$ curl $ROUTE_NAME -k -b /tmp/cookie_jar
21.3.5. Route-specific annotations
The Ingress Controller can set the default options for all the routes it exposes. An individual route can override some of these defaults by providing specific configurations in its annotations. Red Hat does not support adding a route annotation to an operator-managed route.
To create a whitelist with multiple source IPs or subnets, use a space-delimited list. Any other delimiter type causes the list to be ignored without a warning or error message.
| Variable | Description |
|---|---|
|
|
Sets the load-balancing algorithm. Available options are |
|
|
Disables the use of cookies to track related connections. If set to |
|
| Specifies an optional cookie to use for this route. The name must consist of any combination of upper and lower case letters, digits, "_", and "-". The default is the hashed internal key name for the route. |
|
|
Sets the maximum number of connections that are allowed to a backing pod from a router. |
|
|
Setting |
|
|
Limits the number of concurrent TCP connections made through the same source IP address. It accepts a numeric value. |
|
|
Limits the rate at which a client with the same source IP address can make HTTP requests. It accepts a numeric value. |
|
|
Limits the rate at which a client with the same source IP address can make TCP connections. It accepts a numeric value. |
|
| Sets the interval for the back-end health checks. (TimeUnits) |
|
| Sets an allowlist for the route. The allowlist is a space-separated list of IP addresses and CIDR ranges for the approved source addresses. Requests from IP addresses that are not in the allowlist are dropped.
The maximum number of IP addresses and CIDR ranges directly visible in the |
|
| Sets a Strict-Transport-Security header for the edge terminated or re-encrypt route. |
|
| Sets the rewrite path of the request on the backend. |
|
| Sets a value to restrict cookies. The values are:
This value is applicable to re-encrypt and edge routes only. For more information, see the SameSite cookies documentation. |
|
|
Sets the policy for handling the
|
-
By default, the router reloads every 5 s which resets the balancing connection across pods from the beginning. As a result, the
roundrobinstate is not preserved across reloads. This algorithm works best when pods have nearly identical computing capabilites and storage capacity. If your application or service has continuously changing endpoints, for example, due to the use of a CI/CD pipeline, uneven balancing can result. In this case, use a different algorithm. If the number of IP addresses and CIDR ranges in an allowlist exceeds 61, they are written into a separate file that is then referenced from the
haproxy.configfile. This file is stored in the/var/lib/haproxy/router/allowlistsfolder.NoteTo ensure that the addresses are written to the allowlist, check that the full list of CIDR ranges are listed in the Ingress Controller configuration file. The etcd object size limit restricts how large a route annotation can be. Because of this, it creates a threshold for the maximum number of IP addresses and CIDR ranges that you can include in an allowlist.
A route that allows only one specific IP address
metadata:
annotations:
haproxy.router.openshift.io/ip_whitelist: 192.168.1.10A route that sets the load-balancing algorithm to leastconn
metadata:
annotations:
haproxy.router.openshift.io/balance: leastconn-
The default load-balancing algorithm is
random.
A route that allows several IP addresses
metadata:
annotations:
haproxy.router.openshift.io/ip_whitelist: 192.168.1.10 192.168.1.11 192.168.1.12A route that allows an IP address CIDR network
metadata:
annotations:
haproxy.router.openshift.io/ip_whitelist: 192.168.1.0/24A route that allows both IP an address and IP address CIDR networks
metadata:
annotations:
haproxy.router.openshift.io/ip_whitelist: 180.5.61.153 192.168.1.0/24 10.0.0.0/8A route specifying a rewrite target
apiVersion: route.openshift.io/v1
kind: Route
metadata:
annotations:
haproxy.router.openshift.io/rewrite-target: /
...- 1
- Sets
/as rewrite path of the request on the backend.
Setting the haproxy.router.openshift.io/rewrite-target annotation on a route specifies that the Ingress Controller should rewrite paths in HTTP requests using this route before forwarding the requests to the backend application. The part of the request path that matches the path specified in spec.path is replaced with the rewrite target specified in the annotation.
The following table provides examples of the path rewriting behavior for various combinations of spec.path, request path, and rewrite target.
| Route.spec.path | Request path | Rewrite target | Forwarded request path |
|---|---|---|---|
| /foo | /foo | / | / |
| /foo | /foo/ | / | / |
| /foo | /foo/bar | / | /bar |
| /foo | /foo/bar/ | / | /bar/ |
| /foo | /foo | /bar | /bar |
| /foo | /foo/ | /bar | /bar/ |
| /foo | /foo/bar | /baz | /baz/bar |
| /foo | /foo/bar/ | /baz | /baz/bar/ |
| /foo/ | /foo | / | N/A (request path does not match route path) |
| /foo/ | /foo/ | / | / |
| /foo/ | /foo/bar | / | /bar |
Certain special characters in haproxy.router.openshift.io/rewrite-target require special handling because they must be escaped properly. Refer to the following table to understand how these characters are handled.
| For character | Use characters | Notes |
|---|---|---|
| # | \# | Avoid # because it terminates the rewrite expression |
| % | % or %% | Avoid odd sequences such as %%% |
| ‘ | \’ | Avoid ‘ because it is ignored |
All other valid URL characters can be used without escaping.
21.3.6. Throughput issue troubleshooting methods
Sometimes applications deployed by using OpenShift Container Platform can cause network throughput issues, such as unusually high latency between specific services.
If pod logs do not reveal any cause of the problem, use the following methods to analyze performance issues:
Use a packet analyzer, such as
pingortcpdumpto analyze traffic between a pod and its node.For example, run the
tcpdumptool on each pod while reproducing the behavior that led to the issue. Review the captures on both sides to compare send and receive timestamps to analyze the latency of traffic to and from a pod. Latency can occur in OpenShift Container Platform if a node interface is overloaded with traffic from other pods, storage devices, or the data plane.$ tcpdump -s 0 -i any -w /tmp/dump.pcap host <podip 1> && host <podip 2>1 - 1
podipis the IP address for the pod. Run theoc get pod <pod_name> -o widecommand to get the IP address of a pod.
The
tcpdumpcommand generates a file at/tmp/dump.pcapcontaining all traffic between these two pods. You can run the analyzer shortly before the issue is reproduced and stop the analyzer shortly after the issue is finished reproducing to minimize the size of the file. You can also run a packet analyzer between the nodes (eliminating the SDN from the equation) with:$ tcpdump -s 0 -i any -w /tmp/dump.pcap port 4789Use a bandwidth measuring tool, such as
iperf, to measure streaming throughput and UDP throughput. Locate any bottlenecks by running the tool from the pods first, and then running it from the nodes.-
For information on installing and using
iperf, see this Red Hat Solution.
-
For information on installing and using
- In some cases, the cluster might mark the node with the router pod as unhealthy due to latency issues. Use worker latency profiles to adjust the frequency that the cluster waits for a status update from the node before taking action.
-
If your cluster has designated lower-latency and higher-latency nodes, configure the
spec.nodePlacementfield in the Ingress Controller to control the placement of the router pod.
21.3.7. Configuring the route admission policy
Administrators and application developers can run applications in multiple namespaces with the same domain name. This is for organizations where multiple teams develop microservices that are exposed on the same hostname.
Allowing claims across namespaces should only be enabled for clusters with trust between namespaces, otherwise a malicious user could take over a hostname. For this reason, the default admission policy disallows hostname claims across namespaces.
Prerequisites
- Cluster administrator privileges.
Procedure
Edit the
.spec.routeAdmissionfield of theingresscontrollerresource variable using the following command:$ oc -n openshift-ingress-operator patch ingresscontroller/default --patch '{"spec":{"routeAdmission":{"namespaceOwnership":"InterNamespaceAllowed"}}}' --type=mergeSample Ingress Controller configuration
spec: routeAdmission: namespaceOwnership: InterNamespaceAllowed ...TipYou can alternatively apply the following YAML to configure the route admission policy:
apiVersion: operator.openshift.io/v1 kind: IngressController metadata: name: default namespace: openshift-ingress-operator spec: routeAdmission: namespaceOwnership: InterNamespaceAllowed
21.3.8. Configuring the OpenShift Container Platform Ingress Controller for dual-stack networking
If your OpenShift Container Platform cluster is configured for IPv4 and IPv6 dual-stack networking, your cluster is externally reachable by OpenShift Container Platform routes.
The Ingress Controller automatically serves services that have both IPv4 and IPv6 endpoints, but you can configure the Ingress Controller for single-stack or dual-stack services.
Prerequisites
- You deployed an OpenShift Container Platform cluster on bare metal.
-
You installed the OpenShift CLI (
oc).
Procedure
To have the Ingress Controller serve traffic over IPv4/IPv6 to a workload, you can create a service YAML file or modify an existing service YAML file by setting the
ipFamiliesandipFamilyPolicyfields. For example:Sample service YAML file
apiVersion: v1 kind: Service metadata: creationTimestamp: yyyy-mm-ddT00:00:00Z labels: name: <service_name> manager: kubectl-create operation: Update time: yyyy-mm-ddT00:00:00Z name: <service_name> namespace: <namespace_name> resourceVersion: "<resource_version_number>" selfLink: "/api/v1/namespaces/<namespace_name>/services/<service_name>" uid: <uid_number> spec: clusterIP: 172.30.0.0/16 clusterIPs:1 - 172.30.0.0/16 - <second_IP_address> ipFamilies:2 - IPv4 - IPv6 ipFamilyPolicy: RequireDualStack3 ports: - port: 8080 protocol: TCP targetport: 8080 selector: name: <namespace_name> sessionAffinity: None type: ClusterIP status: loadbalancer: {}These resources generate corresponding
endpoints. The Ingress Controller now watchesendpointslices.To view
endpoints, enter the following command:$ oc get endpointsTo view
endpointslices, enter the following command:$ oc get endpointslices
21.4. Creating advanced routes
You can create secure routes with the ability to use several types of TLS termination to serve certificates to the client. The following sections describe how to create re-encrypt, edge, and passthrough routes with custom certificates.
21.4.1. Creating an edge route with a custom certificate
You can configure a secure route using edge TLS termination with a custom certificate by using the oc create route command. With an edge route, the Ingress Controller terminates TLS encryption before forwarding traffic to the destination pod. The route specifies the TLS certificate and key that the Ingress Controller uses for the route.
Prerequisites
- You must have a certificate/key pair in PEM-encoded files, where the certificate is valid for the route host.
- You may have a separate CA certificate in a PEM-encoded file that completes the certificate chain.
- You must have a service that you want to expose.
Password protected key files are not supported. To remove a passphrase from a key file, use the following command:
$ openssl rsa -in password_protected_tls.key -out tls.keyProcedure
This procedure creates a Route resource with a custom certificate and edge TLS termination. The following assumes that the certificate/key pair are in the tls.crt and tls.key files in the current working directory. You may also specify a CA certificate if needed to complete the certificate chain. Substitute the actual path names for tls.crt, tls.key, and (optionally) ca.crt. Substitute the name of the service that you want to expose for frontend. Substitute the appropriate hostname for www.example.com.
Create a secure
Routeresource using edge TLS termination and a custom certificate.$ oc create route edge --service=frontend --cert=tls.crt --key=tls.key --ca-cert=ca.crt --hostname=www.example.comIf you examine the resulting
Routeresource, it should look similar to the following:YAML Definition of the Secure Route
apiVersion: route.openshift.io/v1 kind: Route metadata: name: frontend spec: host: www.example.com to: kind: Service name: frontend tls: termination: edge key: |- -----BEGIN PRIVATE KEY----- [...] -----END PRIVATE KEY----- certificate: |- -----BEGIN CERTIFICATE----- [...] -----END CERTIFICATE----- caCertificate: |- -----BEGIN CERTIFICATE----- [...] -----END CERTIFICATE-----See
oc create route edge --helpfor more options.
21.4.2. Creating a re-encrypt route with a custom certificate
You can configure a secure route using reencrypt TLS termination with a custom certificate by using the oc create route command.
Prerequisites
- You must have a certificate/key pair in PEM-encoded files, where the certificate is valid for the route host.
- You may have a separate CA certificate in a PEM-encoded file that completes the certificate chain.
- You must have a separate destination CA certificate in a PEM-encoded file.
- You must have a service that you want to expose.
Password protected key files are not supported. To remove a passphrase from a key file, use the following command:
$ openssl rsa -in password_protected_tls.key -out tls.keyProcedure
This procedure creates a Route resource with a custom certificate and reencrypt TLS termination. The following assumes that the certificate/key pair are in the tls.crt and tls.key files in the current working directory. You must also specify a destination CA certificate to enable the Ingress Controller to trust the service’s certificate. You may also specify a CA certificate if needed to complete the certificate chain. Substitute the actual path names for tls.crt, tls.key, cacert.crt, and (optionally) ca.crt. Substitute the name of the Service resource that you want to expose for frontend. Substitute the appropriate hostname for www.example.com.
Create a secure
Routeresource using reencrypt TLS termination and a custom certificate:$ oc create route reencrypt --service=frontend --cert=tls.crt --key=tls.key --dest-ca-cert=destca.crt --ca-cert=ca.crt --hostname=www.example.comIf you examine the resulting
Routeresource, it should look similar to the following:YAML Definition of the Secure Route
apiVersion: route.openshift.io/v1 kind: Route metadata: name: frontend spec: host: www.example.com to: kind: Service name: frontend tls: termination: reencrypt key: |- -----BEGIN PRIVATE KEY----- [...] -----END PRIVATE KEY----- certificate: |- -----BEGIN CERTIFICATE----- [...] -----END CERTIFICATE----- caCertificate: |- -----BEGIN CERTIFICATE----- [...] -----END CERTIFICATE----- destinationCACertificate: |- -----BEGIN CERTIFICATE----- [...] -----END CERTIFICATE-----See
oc create route reencrypt --helpfor more options.
21.4.3. Creating a passthrough route
You can configure a secure route using passthrough termination by using the oc create route command. With passthrough termination, encrypted traffic is sent straight to the destination without the router providing TLS termination. Therefore no key or certificate is required on the route.
Prerequisites
- You must have a service that you want to expose.
Procedure
Create a
Routeresource:$ oc create route passthrough route-passthrough-secured --service=frontend --port=8080If you examine the resulting
Routeresource, it should look similar to the following:A Secured Route Using Passthrough Termination
apiVersion: route.openshift.io/v1 kind: Route metadata: name: route-passthrough-secured1 spec: host: www.example.com port: targetPort: 8080 tls: termination: passthrough2 insecureEdgeTerminationPolicy: None3 to: kind: Service name: frontendThe destination pod is responsible for serving certificates for the traffic at the endpoint. This is currently the only method that can support requiring client certificates, also known as two-way authentication.
21.4.4. Creating a route using the destination CA certificate in the Ingress annotation
The route.openshift.io/destination-ca-certificate-secret annotation can be used on an Ingress object to define a route with a custom destination CA certificate.
Prerequisites
- You may have a certificate/key pair in PEM-encoded files, where the certificate is valid for the route host.
- You may have a separate CA certificate in a PEM-encoded file that completes the certificate chain.
- You must have a separate destination CA certificate in a PEM-encoded file.
- You must have a service that you want to expose.
Procedure
Create a secret for the destination CA certificate by entering the following command:
$ oc create secret generic dest-ca-cert --from-file=tls.crt=<file_path>For example:
$ oc -n test-ns create secret generic dest-ca-cert --from-file=tls.crt=tls.crtExample output
secret/dest-ca-cert createdAdd the
route.openshift.io/destination-ca-certificate-secretto the Ingress annotations:apiVersion: networking.k8s.io/v1 kind: Ingress metadata: name: frontend annotations: route.openshift.io/termination: "reencrypt" route.openshift.io/destination-ca-certificate-secret: secret-ca-cert1 ...- 1
- The annotation references a kubernetes secret.
The secret referenced in this annotation will be inserted into the generated route.
Example output
apiVersion: route.openshift.io/v1 kind: Route metadata: name: frontend annotations: route.openshift.io/termination: reencrypt route.openshift.io/destination-ca-certificate-secret: secret-ca-cert spec: ... tls: insecureEdgeTerminationPolicy: Redirect termination: reencrypt destinationCACertificate: | -----BEGIN CERTIFICATE----- [...] -----END CERTIFICATE----- ...
21.4.5. Creating a route with externally managed certificate
Securing route with external certificates in TLS secrets is a Technology Preview feature only. Technology Preview features are not supported with Red Hat production service level agreements (SLAs) and might not be functionally complete. Red Hat does not recommend using them in production. These features provide early access to upcoming product features, enabling customers to test functionality and provide feedback during the development process.
For more information about the support scope of Red Hat Technology Preview features, see Technology Preview Features Support Scope.
You can configure OpenShift Container Platform routes with third-party certificate management solutions by using the .spec.tls.externalCertificate field of the route API. You can reference externally managed TLS certificates via secrets, eliminating the need for manual certificate management.
By using the externally managed certificate, you can reduce errors to ensure a smoother rollout of certificate updates and enable the OpenShift router to serve renewed certificates promptly. You can use externally managed certificates with both edge routes and re-encrypt routes.
This feature applies to both edge routes and re-encrypt routes.
Prerequisites
-
You must enable the
RouteExternalCertificatefeature gate. -
You have
createpermission on theroutes/custom-hostsub-resource, which is used for both creating and updating routes. -
You must have a secret containing a valid certificate or key pair in PEM-encoded format of type
kubernetes.io/tls, which includes bothtls.keyandtls.crtkeys. Example command:$ oc create secret tls myapp-tls --cert=server.crt --key=server.key.
Procedure
Create a
roleobject in the same namespace as the secret to allow the router service account read access by running the following command:$ oc create role secret-reader --verb=get,list,watch --resource=secrets --resource-name=<secret-name> \ --namespace=<current-namespace>-
<secret-name>: Specify the actual name of your secret. -
<current-namespace>: Specify the namespace where both your secret and route reside.
-
Create a
rolebindingobject in the same namespace as the secret and bind the router service account to the newly created role by running the following command:$ oc create rolebinding secret-reader-binding --role=secret-reader --serviceaccount=openshift-ingress:router --namespace=<current-namespace>-
<current-namespace>: Specify the namespace where both your secret and route reside.
-
Create a YAML file that defines the
routeand specifies the secret containing your certificate using the following example.YAML definition of the secure route
apiVersion: route.openshift.io/v1 kind: Route metadata: name: myedge namespace: test spec: host: myedge-test.apps.example.com tls: externalCertificate: name: <secret-name> termination: edge [...] [...]-
<secret-name>: Specify the actual name of your secret.
-
Create a
routeresource by running the following command. If the secret exists and has a certificate/key pair, the router serves the generated certificate if all prerequisites are met.$ oc apply -f <route.yaml>1 -
<route.yaml>: Specify the generated YAML filename.
-
If .spec.tls.externalCertificate is not provided, the router uses default generated certificates.
You cannot provide the .spec.tls.certificate field or the .spec.tls.key field when using the .spec.tls.externalCertificate field.
21.4.6. Creating a route using the default certificate through an Ingress object
If you create an Ingress object without specifying any TLS configuration, OpenShift Container Platform generates an insecure route. To create an Ingress object that generates a secure, edge-terminated route using the default ingress certificate, you can specify an empty TLS configuration as follows.
Prerequisites
- You have a service that you want to expose.
-
You have access to the OpenShift CLI (
oc).
Procedure
Create a YAML file for the Ingress object. In this example, the file is called
example-ingress.yaml:YAML definition of an Ingress object
apiVersion: networking.k8s.io/v1 kind: Ingress metadata: name: frontend ... spec: rules: ... tls: - {}1 Create the Ingress object by running the following command:
$ oc create -f example-ingress.yaml
Verification
Verify that OpenShift Container Platform has created the expected route for the Ingress object by running the following command:
$ oc get routes -o yamlExample output
apiVersion: v1 items: - apiVersion: route.openshift.io/v1 kind: Route metadata: name: frontend-j9sdd1 ... spec: ... tls:2 insecureEdgeTerminationPolicy: Redirect termination: edge3 ...
Chapter 22. Configuring ingress cluster traffic
22.1. Configuring ingress cluster traffic overview
To enable communication between external networks and services in OpenShift Container Platform, configure ingress cluster traffic.
22.1.1. Methods for communicating from outside the cluster
To enable communication between external networks and services in OpenShift Container Platform, configure the appropriate ingress method.
OpenShift Container Platform provides the following methods for communicating from outside the cluster with services running in the cluster. Note that the methods are listed in order of preference.
- If you have HTTP/HTTPS, use an Ingress Controller.
- If you have a TLS-encrypted protocol other than HTTPS. For example, for TLS with the SNI header, use an Ingress Controller.
-
Otherwise, use a Load Balancer, an External IP, or a
NodePort.
| Method | Purpose |
|---|---|
| Use an Ingress Controller | Allows access to HTTP/HTTPS traffic and TLS-encrypted protocols other than HTTPS (for example, TLS with the SNI header). |
| Automatically assign an external IP using a load balancer service | Allows traffic to non-standard ports through an IP address assigned from a pool. Most cloud platforms offer a method to start a service with a load-balancer IP address. |
| About MetalLB and the MetalLB Operator | Allows traffic to a specific IP address or address from a pool on the machine network. For bare-metal installations or platforms that are like bare metal, MetalLB provides a way to start a service with a load-balancer IP address. |
| Manually assign an external IP to a service | Allows traffic to non-standard ports through a specific IP address. |
|
Configure a | Expose a service on all nodes in the cluster. |
22.1.3. Comparison: Fault-tolerant access to external IP addresses
To ensure continuous service availability and maintain external IP access in OpenShift Container Platform, configure fault-tolerant networking features.
For the communication methods that provide access to an external IP address, fault tolerant access to the IP address is another consideration. The following features provide fault tolerant access to an external IP address.
- IP failover
- IP failover manages a pool of virtual IP addresses for a set of nodes. IP failover gets implemented with Keepalived and Virtual Router Redundancy Protocol (VRRP). IP failover is a layer 2 mechanism only and relies on multicast. Multicast can have disadvantages for some networks.
- MetalLB
- MetalLB has a layer 2 mode, but it does not use multicast. Layer 2 mode has a disadvantage that it transfers all traffic for an external IP address through one node.
- Manually assigning external IP addresses
- You can configure your cluster with an IP address block that is used to assign external IP addresses to services. By default, this feature is disabled. This feature is flexible, but places the largest burden on the cluster or network administrator. The cluster is prepared to receive traffic that is destined for the external IP, but you must decide how to route traffic to nodes.
22.2. Configuring ExternalIPs for services
As a cluster administrator, you can select an IP address block that is external to the cluster and can send traffic to services in the cluster. This functionality is generally most useful for clusters installed on bare-metal hardware.
Before you configure ExternalIPs for services, your network infrastructure must route traffic for the external IP addresses to your cluster.
22.2.1. About ExternalIP
To load balance traffic in non-cloud environments, use the ExternalIP facility to specify external IP addresses in the spec.externalIPs[] parameter of the Service object. This configuration directs traffic to a local node, providing functionality similar to a type=NodePort service.
For cloud environments, use the load balancer services for automatic deployment of a cloud load balancer to target the endpoints of a service.
After you specify a value for the parameter, OpenShift Container Platform assigns an additional virtual IP address to the service. The IP address can exist outside of the service network that you defined for your cluster.
Because ExternalIP is disabled by default, enabling the ExternalIP functionality might introduce security risks for the service, because in-cluster traffic to an external IP address is directed to that service. This configuration means that cluster users could intercept sensitive traffic destined for external resources.
You can use either a MetalLB implementation or an IP failover deployment to attach an ExternalIP resource to a service in the following ways:
- Automatic assignment of an external IP
-
OpenShift Container Platform automatically assigns an IP address from the
autoAssignCIDRsCIDR block to thespec.externalIPs[]array when you create aServiceobject withspec.type=LoadBalancerset. For this configuration, OpenShift Container Platform implements a cloud version of the load balancer service type and assigns IP addresses to the services. Automatic assignment is disabled by default and must be configured by a cluster administrator as described in the "Configuration for ExternalIP" section. - Manual assignment of an external IP
-
OpenShift Container Platform uses the IP addresses assigned to the
spec.externalIPs[]array when you create aServiceobject. You cannot specify an IP address that is already in use by another service.
After using either the MetalLB implementation or an IP failover deployment to host external IP address blocks, you must configure your networking infrastructure to ensure that the external IP address blocks are routed to your cluster. This configuration means that the IP address is not configured in the network interfaces from nodes. To handle the traffic, you must configure the routing and access to the external IP by using a method, such as static Address Resolution Protocol (ARP) entries.
OpenShift Container Platform extends the ExternalIP functionality in Kubernetes by adding the following capabilities:
- Restrictions on the use of external IP addresses by users through a configurable policy
- Allocation of an external IP address automatically to a service upon request
22.2.2. Configuration for ExternalIP
You can set parameters in the Network.config.openshift.io custom resource (CR) to govern the use of an external IP address in OpenShift Container Platform.
The following list details these parameters:
-
spec.externalIP.autoAssignCIDRsdefines an IP address block used by the load balancer when choosing an external IP address for the service. OpenShift Container Platform supports only a single IP address block for automatic assignment. This configuration requires less steps than manually assigning ExternalIPs to services, which requires managing the port space of a limited number of shared IP addresses. If you enable automatic assignment, the Cloud Controller Manager Operator allocates an external IP address to aServiceobject withspec.type=LoadBalancerdefind in its configuration. -
spec.externalIP.policydefines the permissible IP address blocks when manually specifying an IP address. OpenShift Container Platform does not apply policy rules to IP address blocks that you defined in thespec.externalIP.autoAssignCIDRsparameter.
If routed correctly, external traffic from the configured external IP address block can reach service endpoints through any TCP or UDP port that the service exposes.
As a cluster administrator, you must configure routing to externalIPs. You must also ensure that the IP address block you assign terminates at one or more nodes in your cluster. For more information, see Kubernetes External IPs.
OpenShift Container Platform supports both automatic and manual IP address assignment. This support guarantees that each address gets assigned to a maximum of one service and that each service can expose its chosen ports regardless of the ports exposed by other services.
To use IP address blocks defined by autoAssignCIDRs in OpenShift Container Platform, you must configure the necessary IP address assignment and routing for your host network.
The following YAML describes a service with an external IP address configured:
Example Service object with spec.externalIPs[] set
apiVersion: v1
kind: Service
metadata:
name: http-service
spec:
clusterIP: 172.30.163.110
externalIPs:
- 192.168.132.253
externalTrafficPolicy: Cluster
ports:
- name: highport
nodePort: 31903
port: 30102
protocol: TCP
targetPort: 30102
selector:
app: web
sessionAffinity: None
type: LoadBalancer
status:
loadBalancer:
ingress:
- ip: 192.168.132.253
# ...
If you run a private cluster on a cloud-provider platform, you can change the publishing scope to internal for the load balancer of the Ingress Controller by running the following patch command:
$ oc -n openshift-ingress-operator patch ingresscontrollers/ingress-controller-with-nlb --type=merge --patch='{"spec":{"endpointPublishingStrategy":{"loadBalancer":{"scope":"Internal"}}}}'After you run this command, the Ingress Controller restricts access to routes for OpenShift Container Platform applications to internal networks only.
22.2.3. Applying restrictions on the assignment of an external IP address
As a cluster administrator, you can specify IP address blocks to allow and to reject IP addresses for a service. Restrictions apply only to users without cluster-admin privileges. A cluster administrator can always set the service spec.externalIPs[] field to any IP address.
When configuring policy restrictions, the following rules apply:
-
If
policyis set to{}, creating aServiceobject withspec.ExternalIPs[]results in a failed service. This setting is the default for OpenShift Container Platform. The same behavior exists forpolicy: null. If
policyis set and eitherpolicy.allowedCIDRs[]orpolicy.rejectedCIDRs[]is set, the following rules apply:-
If
allowedCIDRs[]andrejectedCIDRs[]are both set,rejectedCIDRs[]has precedence overallowedCIDRs[]. -
If
allowedCIDRs[]is set, creating aServiceobject withspec.ExternalIPs[]succeeds only if the specified IP addresses are allowed. -
If
rejectedCIDRs[]is set, creating aServiceobject withspec.ExternalIPs[]succeeds only if the specified IP addresses are not rejected.
-
If
Procedure
Configure an IP address policy by specifying Classless Inter-Domain Routing (CIDR) address blocks for the
spec.ExternalIP.policyparameter in thepolicyobject:Example in JSON form of a
policyobject and its CIDR parameters{ "policy": { "allowedCIDRs": [], "rejectedCIDRs": [] } }
22.2.4. Example policy objects
Reference the examples in the Example policy objects section to understand different spec.externalIP.policy configurations.
In the following example, the policy prevents OpenShift Container Platform from creating any service with a specified external IP address.
Example policy to reject any value specified for Service object spec.externalIPs[]
apiVersion: config.openshift.io/v1
kind: Network
metadata:
name: cluster
spec:
externalIP:
policy: {}
# ...
In the following example, both the allowedCIDRs and rejectedCIDRs fields are set.
Example policy that includes both allowed and rejected CIDR blocks
apiVersion: config.openshift.io/v1
kind: Network
metadata:
name: cluster
spec:
externalIP:
policy:
allowedCIDRs:
- 172.16.66.10/23
rejectedCIDRs:
- 172.16.66.10/24
# ...
In the following example, policy is set to {}. With this configuration, using the oc get networks.config.openshift.io -o yaml command to view the configuration means policy parameter does not show on the command output. The same behavior exists for policy: null.
Example policy to allow any value specified for Service object spec.externalIPs[]
apiVersion: config.openshift.io/v1
kind: Network
metadata:
name: cluster
spec:
clusterNetwork:
- cidr: 10.128.0.0/14
hostPrefix: 23
externalIP:
policy: {}
# ...22.2.5. ExternalIP address block configuration
To better understand ExternalIP address blocks, view the example configuration for ExternalIP address blocks that is defined by a Network custom resource (CR) named cluster. The Network CR is part of the config.openshift.io API group.
During cluster installation, the Cluster Version Operator (CVO) automatically creates a Network CR named cluster. Creating any other CR objects of this type is not supported.
The following YAML describes the ExternalIP configuration in a Network.config.openshift.io CR named cluster:
apiVersion: config.openshift.io/v1
kind: Network
metadata:
name: cluster
spec:
externalIP:
autoAssignCIDRs: []
policy:
...-
autoAssignCIDRs: Defines the IP address block in CIDR format that is available for automatic assignment of external IP addresses to a service. Only a single IP address range is allowed. -
policy: Defines restrictions on manual assignment of an IP address to a service. If no restrictions are defined, specifying thespec.externalIPfield in aServiceobject is not allowed. By default, no restrictions are defined.
The following YAML describes the fields for the policy stanza in the Network.config.openshift.io CR:
policy:
allowedCIDRs: []
rejectedCIDRs: []-
allowedCIDRs: A list of allowed IP address ranges in CIDR format. -
rejectedCIDRs: A list of rejected IP address ranges in CIDR format.
The next set of example configurations show external IP address pools configurations.
The following YAML shows a spec.externalIP.autoAssignCIDRs configuration that enables automatically assigned external IP addresses:
Example configuration with spec.externalIP.autoAssignCIDRs set
apiVersion: config.openshift.io/v1
kind: Network
metadata:
name: cluster
spec:
...
externalIP:
autoAssignCIDRs:
- 192.168.132.254/29
The following YAML configuration includes a spec.externalIP.policy configuration that sets policy rules for the allowed and rejected CIDR ranges:
apiVersion: config.openshift.io/v1
kind: Network
metadata:
name: cluster
spec:
...
externalIP:
policy:
allowedCIDRs:
- 192.168.132.0/29
- 192.168.132.8/29
rejectedCIDRs:
- 192.168.132.7/3222.2.6. Configure external IP address blocks for your cluster
As a cluster administrator, you can configure the ExternalIP settings to provide predictable entry points for external traffic to reach your cluster.
The following list details these ExternalIP settings:
-
An ExternalIP address block used by OpenShift Container Platform to automatically populate the
spec.clusterIPfield for aServiceobject. -
A policy object to restrict what IP addresses may be manually assigned to the
spec.clusterIParray of aServiceobject.
Prerequisites
-
Install the OpenShift CLI (
oc) -
Access to the cluster as a user with the
cluster-adminrole.
Procedure
Optional: To display the current external IP configuration, enter the following command:
$ oc describe networks.config clusterTo edit the configuration, enter the following command:
$ oc edit networks.config clusterModify the ExternalIP configuration, as in the following example:
apiVersion: config.openshift.io/v1 kind: Network metadata: name: cluster spec: ... externalIP: ...-
externalIP: Specify the configuration for theexternalIPstanza.
-
To confirm the updated ExternalIP configuration, enter the following command:
$ oc get networks.config cluster -o go-template='{{.spec.externalIP}}{{"\n"}}'
22.2.8. Next steps
22.3. Configuring ingress cluster traffic by using an Ingress Controller
You can use the Ingress Controller to control how external users communicate with services that run inside the cluster.
Before you begin any of the procedures that are listed in the Configuring ingress cluster traffic by using an Ingress Controller document, ensure that you meet the following prerequisites. A cluster administrator performs these prerequisites:
- Set up the external port to the cluster networking environment so that requests can reach the cluster.
Make sure there is at least one user with cluster admin role. To add this role to a user, run the following command:
$ oc adm policy add-cluster-role-to-user cluster-admin username- You have an OpenShift Container Platform cluster with at least one master and at least one node and a system outside the cluster that has network access to the cluster. This procedure assumes that the external system is on the same subnet as the cluster. The additional networking required for external systems on a different subnet is out-of-scope for this topic.
22.3.1. Using Ingress Controllers and routes
You can use the Ingress Controller to allow external access to an OpenShift Container Platform cluster. The Ingress Operator manages Ingress Controllers and wildcard DNS.
An Ingress Controller is configured to accept external requests and proxy them based on the configured routes. This is limited to HTTP, HTTPS using SNI, and TLS using SNI, which is sufficient for web applications and services that work over TLS with SNI.
Work with your administrator to configure an Ingress Controller to accept external requests and proxy them based on the configured routes.
The administrator can create a wildcard DNS entry and then set up an Ingress Controller. Then, you can work with the edge Ingress Controller without having to contact the administrators.
By default, every Ingress Controller in the cluster can admit any route created in any project in the cluster. The Ingress Controller has the following characteristics:
- Has two replicas by default, which means it should be running on two compute nodes.
- Can be scaled up to have more replicas on more nodes.
22.3.2. Creating a project and service
If the project and service that you want to expose does not exist, create the project and then create the service.
If the project and service already exists, skip to the procedure on exposing the service to create a route.
Prerequisites
-
Install the OpenShift CLI (
oc) and log in as a cluster administrator.
Procedure
Create a new project for your service by running the
oc new-projectcommand:$ oc new-project <project_name>Use the
oc new-appcommand to create your service:$ oc new-app nodejs:12~https://github.com/sclorg/nodejs-ex.gitTo verify that the service was created, run the following command:
$ oc get svc -n <project_name>Example output
NAME TYPE CLUSTER-IP EXTERNAL-IP PORT(S) AGE nodejs-ex ClusterIP 172.30.197.157 <none> 8080/TCP 70sNoteBy default, the new service does not have an external IP address.
22.3.3. Exposing the service by creating a route
To enable external access to your application that runs on OpenShift Container Platform, you can expose the service as a route by using the oc expose command.
Prerequisites
- You logged into OpenShift Container Platform.
Procedure
Log in to the project where the service you want to expose is located:
$ oc project <project_name>Run the
oc expose servicecommand to expose the route:$ oc expose service nodejs-exExample output
route.route.openshift.io/nodejs-ex exposedTo verify that the service is exposed, you can use a tool, such as
curlto check that the service is accessible from outside the cluster.To find the hostname of the route, enter the following command:
$ oc get routeExample output
NAME HOST/PORT PATH SERVICES PORT TERMINATION WILDCARD nodejs-ex nodejs-ex-myproject.example.com nodejs-ex 8080-tcp NoneTo check that the host responds to a GET request, enter the following command:
Example
curlcommand$ curl --head nodejs-ex-myproject.example.comExample output
HTTP/1.1 200 OK ...
22.3.4. Ingress sharding in OpenShift Container Platform
To optimise routing performance in OpenShift Container Platform, create shards so that you can load balance incoming traffic across multiple Ingress Controllers.
In OpenShift Container Platform, an Ingress Controller can serve all routes, or it can serve a subset of routes. By default, the Ingress Controller serves any route created in any namespace of the cluster. You can add additional Ingress Controllers to your cluster to optimize routing by creating shards, which are subsets of routes based on selected characteristics. To mark a route as a member of a shard, use labels in the route or namespace metadata field. The Ingress Controller uses selectors, also known as a selection expression, to select a subset of routes from the entire pool of routes to serve.
You can also use Ingress sharding when you want to isolate traffic so that the traffic can route to a specific Ingress Controller.
By default, each route uses the default domain of the cluster. However, routes can be configured to use the domain of the router instead.
22.3.5. Ingress Controller sharding
You can use Ingress sharding, also known as router sharding, to distribute a set of routes across multiple routers by adding labels to routes, namespaces, or both.
The Ingress Controller uses a corresponding set of selectors to admit only the routes that have a specified label. Each Ingress shard comprises the routes that are filtered by using a given selection expression.
As the primary mechanism for traffic to enter the cluster, the demands on the Ingress Controller can be significant. As a cluster administrator, you can shard the routes to the following components:
- Balance Ingress Controllers, or routers, with several routes to accelerate responses to changes.
- Assign certain routes to have different reliability guarantees than other routes.
- Allow certain Ingress Controllers to have different policies defined.
- Allow only specific routes to use additional features.
- Expose different routes on different addresses so that internal and external users can see different routes, for example.
- Transfer traffic from one version of an application to another during a blue-green deployment.
When Ingress Controllers are sharded, a given route is admitted to zero or more Ingress Controllers in the group. The status of a route describes whether an Ingress Controller has admitted the route. An Ingress Controller only admits a route if the route is unique to a shard.
With sharding, you can distribute subsets of routes over multiple Ingress Controllers. These subsets can be nonoverlapping, also called traditional sharding, or overlapping, otherwise known as overlapped sharding.
The following table outlines three sharding methods:
| Sharding method | Description |
|---|---|
| Namespace selector | After you add a namespace selector to the Ingress Controller, all routes in a namespace that have matching labels for the namespace selector are included in the Ingress shard. Consider this method when an Ingress Controller serves all routes created in a namespace. |
| Route selector | After you add a route selector to the Ingress Controller, all routes with labels that match the route selector are included in the Ingress shard. Consider this method when you want an Ingress Controller to serve only a subset of routes or a specific route in a namespace. |
| Namespace and route selectors | Provides your Ingress Controller scope for both namespace selector and route selector methods. Consider this method when you want the flexibility of both the namespace selector and the route selector methods. |
22.3.5.1. Traditional sharding example
To understand traditional sharding, you can review the example of a configured Ingress Controller finops-router that has the label selector spec.namespaceSelector.matchExpressions with key values set to finance and ops.
Example YAML definition for finops-router
apiVersion: operator.openshift.io/v1
kind: IngressController
metadata:
name: finops-router
namespace: openshift-ingress-operator
spec:
namespaceSelector:
matchExpressions:
- key: name
operator: In
values:
- finance
- ops
An example of a configured Ingress Controller dev-router that has the label selector spec.namespaceSelector.matchLabels.name with the key value set to dev:
Example YAML definition for dev-router
apiVersion: operator.openshift.io/v1
kind: IngressController
metadata:
name: dev-router
namespace: openshift-ingress-operator
spec:
namespaceSelector:
matchLabels:
name: dev
If all application routes are in separate namespaces, such as each labeled with name:finance, name:ops, and name:dev, the configuration effectively distributes your routes between the two Ingress Controllers. OpenShift Container Platform routes for console, authentication, and other purposes should not be handled.
In the previous scenario, sharding becomes a special case of partitioning, with no overlapping subsets. Routes are divided between router shards.
The default Ingress Controller continues to serve all routes unless the namespaceSelector or routeSelector fields contain routes that are meant for exclusion. See this Red Hat Knowledgebase solution and the section "Sharding the default Ingress Controller" for more information on how to exclude routes from the default Ingress Controller.
22.3.5.2. Overlapped sharding example
An example of a configured Ingress Controller devops-router that has the label selector spec.namespaceSelector.matchExpressions with key values set to dev and ops:
Example YAML definition for devops-router
apiVersion: operator.openshift.io/v1
kind: IngressController
metadata:
name: devops-router
namespace: openshift-ingress-operator
spec:
namespaceSelector:
matchExpressions:
- key: name
operator: In
values:
- dev
- ops
The routes in the namespaces labeled name:dev and name:ops are now serviced by two different Ingress Controllers. With this configuration, you have overlapping subsets of routes.
With overlapping subsets of routes you can create more complex routing rules. For example, you can divert higher priority traffic to the dedicated finops-router while sending lower priority traffic to devops-router.
22.3.5.3. Sharding the default Ingress Controller
You can restrict an Ingress Controller from servicing routes with specific labels by using either namespace selectors or route selectors.
After creating a new Ingress shard, there might be routes that are admitted to your new Ingress shard that are also admitted by the default Ingress Controller. This is because the default Ingress Controller has no selectors and admits all routes by default.
The following procedure restricts the default Ingress Controller from servicing your newly sharded finance, ops, and dev, routes by using a namespace selector. This adds further isolation to Ingress shards.
You must keep all of OpenShift Container Platform’s administration routes on the same Ingress Controller. Therefore, avoid adding additional selectors to the default Ingress Controller that exclude these essential routes.
Prerequisites
-
You installed the OpenShift CLI (
oc). - You are logged in as a project administrator.
Procedure
Modify the default Ingress Controller by running the following command:
$ oc edit ingresscontroller -n openshift-ingress-operator defaultEdit the Ingress Controller to contain a
namespaceSelectorthat excludes the routes with any of thefinance,ops, anddevlabels:apiVersion: operator.openshift.io/v1 kind: IngressController metadata: name: default namespace: openshift-ingress-operator spec: namespaceSelector: matchExpressions: - key: name operator: NotIn values: - finance - ops - devThe default Ingress Controller no longer serves the namespaces labeled with
name:finance,name:ops, andname:dev.
22.3.5.4. Ingress sharding and DNS
To ensure ingress traffic reaches the correct router in OpenShift Container Platform, create separate DNS entries for each router in your project. Because a router does not forward unknown traffic to other routers, distinct entries are required to resolve specific domains to their hosting nodes."
Consider the following example:
-
Router A lives on host 192.168.0.5 and has routes with
*.foo.com. -
Router B lives on host 192.168.1.9 and has routes with
*.example.com.
Separate DNS entries must resolve *.foo.com to the node hosting Router A and *.example.com to the node hosting Router B:
-
*.foo.com A IN 192.168.0.5 -
*.example.com A IN 192.168.1.9
22.3.5.5. Configuring Ingress Controller sharding by using route labels
You can use route labels to configure Ingress Controller sharding so that the Ingress Controller serves any route in any namespace that is selected by the route selector.
Figure 22.1. Ingress sharding by using route labels
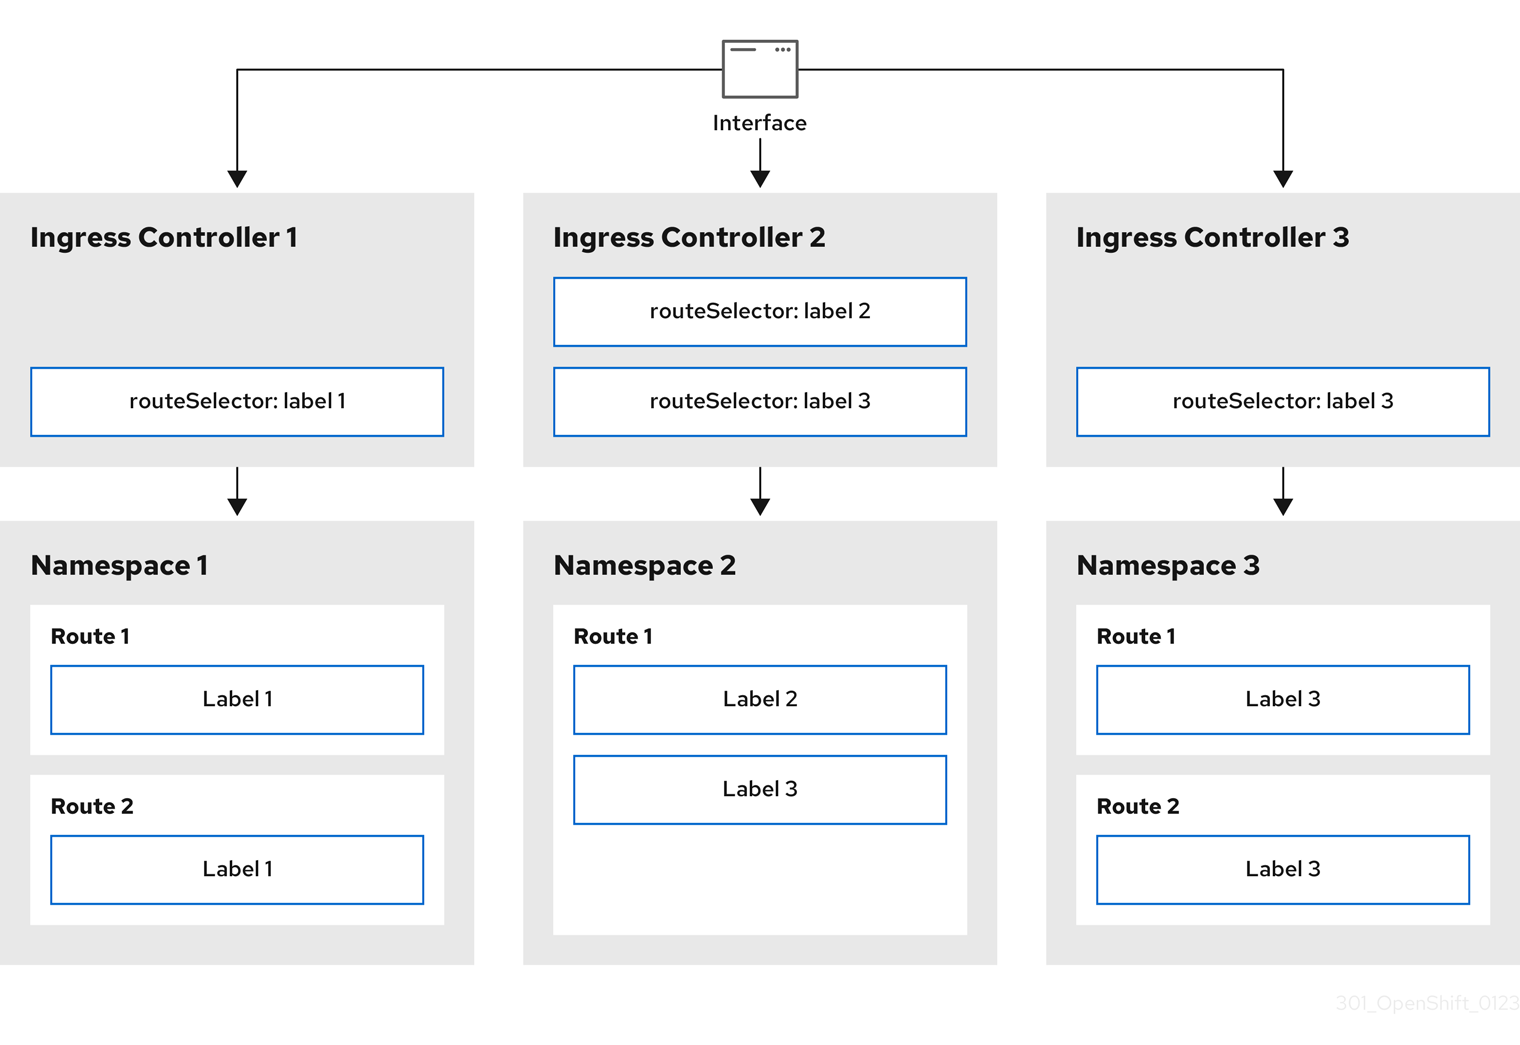
Ingress Controller sharding is useful when balancing incoming traffic load among a set of Ingress Controllers and when isolating traffic to a specific Ingress Controller. For example, company A goes to one Ingress Controller and company B to another.
Procedure
Edit the
router-internal.yamlfile:apiVersion: operator.openshift.io/v1 kind: IngressController metadata: name: sharded namespace: openshift-ingress-operator spec: domain: <apps-sharded.basedomain.example.net> nodePlacement: nodeSelector: matchLabels: node-role.kubernetes.io/worker: "" routeSelector: matchLabels: type: sharded-
<apps-sharded.basedomain.example.net>: Specify a domain to be used by the Ingress Controller. This domain must be different from the default Ingress Controller domain.
-
Apply the Ingress Controller
router-internal.yamlfile:# oc apply -f router-internal.yamlThe Ingress Controller selects routes in any namespace that have the label
type: sharded.Create a new route by using the domain configured in the
router-internal.yaml:$ oc expose svc <service-name> --hostname <route-name>.apps-sharded.basedomain.example.net
22.3.5.6. Configuring Ingress Controller sharding by using namespace labels
You can use namespace labels to configure Ingress Controller sharding so that the Ingress Controller serves any route in any namespace that is selected by the namespace selector.
Figure 22.2. Ingress sharding by using namespace labels
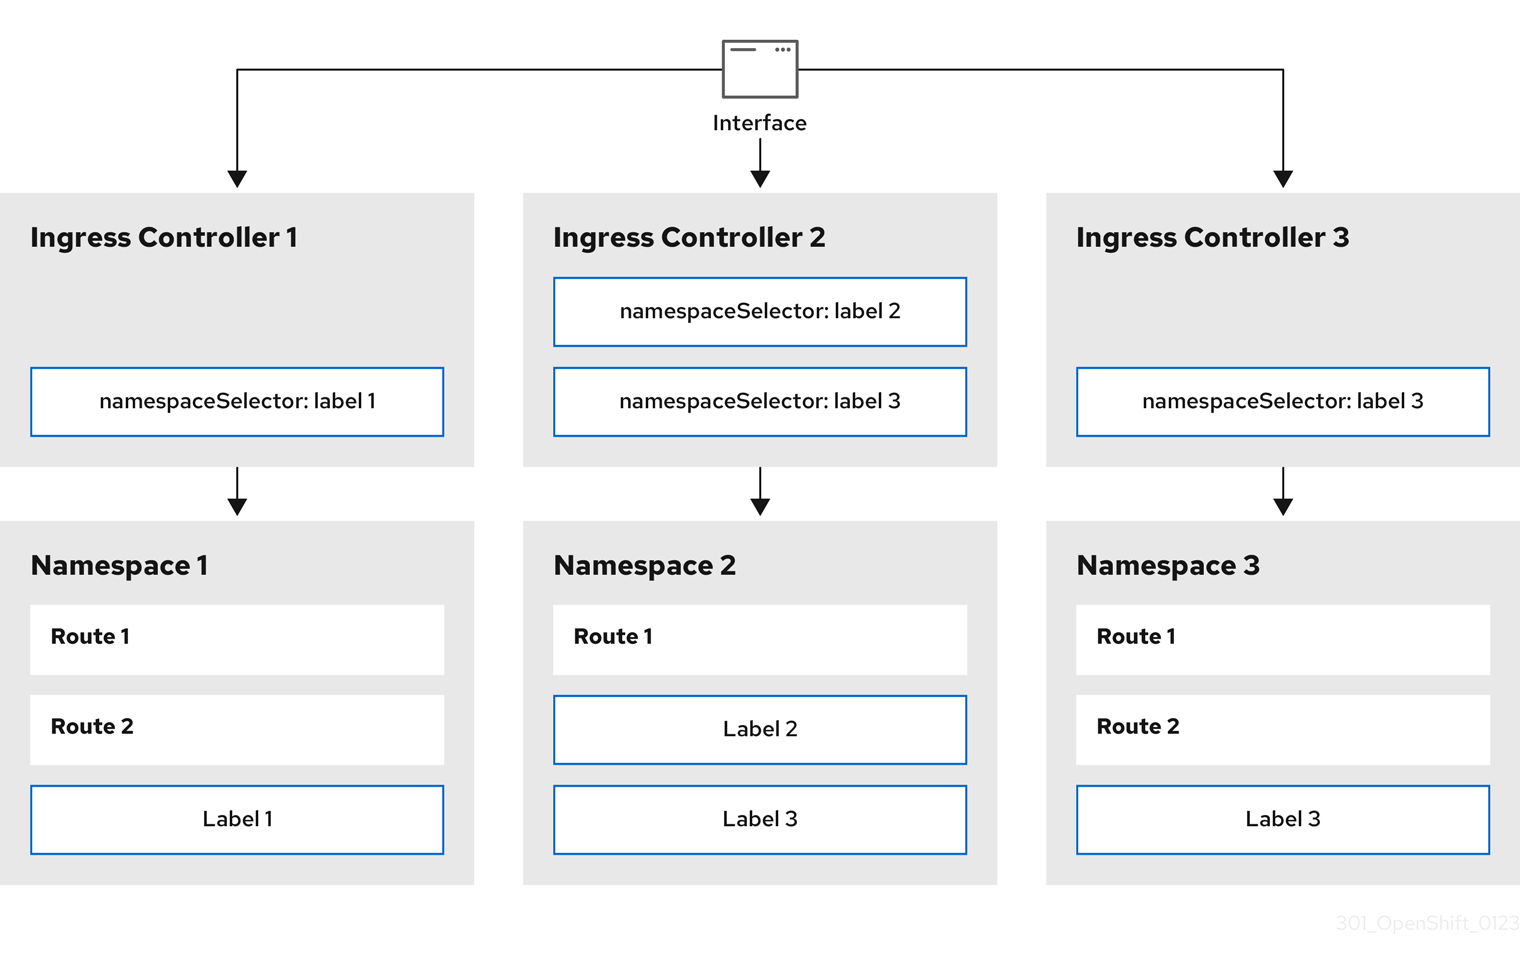
Ingress Controller sharding is useful when balancing incoming traffic load among a set of Ingress Controllers and when isolating traffic to a specific Ingress Controller. For example, company A goes to one Ingress Controller and company B to another.
Procedure
Edit the
router-internal.yamlfile:$ cat router-internal.yamlExample output
apiVersion: operator.openshift.io/v1 kind: IngressController metadata: name: sharded namespace: openshift-ingress-operator spec: domain: <apps-sharded.basedomain.example.net> nodePlacement: nodeSelector: matchLabels: node-role.kubernetes.io/worker: "" namespaceSelector: matchLabels: type: sharded-
<apps-sharded.basedomain.example.net>: Specify a domain to be used by the Ingress Controller. This domain must be different from the default Ingress Controller domain.
-
Apply the Ingress Controller
router-internal.yamlfile:$ oc apply -f router-internal.yamlThe Ingress Controller selects routes in any namespace that is selected by the namespace selector that have the label
type: sharded.Create a new route by using the domain configured in the
router-internal.yaml:$ oc expose svc <service-name> --hostname <route-name>.apps-sharded.basedomain.example.net
22.3.5.7. Creating a route for Ingress Controller sharding
To host applications at specific URLs and balance traffic load in OpenShift Container Platform, configure Ingress Controller sharding. By sharding, you can isolate traffic for specific workloads or tenants, ensuring efficient resource management across your cluster.
The following procedure describes how to create a route for Ingress Controller sharding, using the hello-openshift application as an example.
Prerequisites
-
You installed the OpenShift CLI (
oc). - You are logged in as a project administrator.
- You have a web application that exposes a port and an HTTP or TLS endpoint listening for traffic on the port.
- You have configured the Ingress Controller for sharding.
Procedure
Create a project called
hello-openshiftby running the following command:$ oc new-project hello-openshiftCreate a pod in the project by running the following command:
$ oc create -f https://raw.githubusercontent.com/openshift/origin/master/examples/hello-openshift/hello-pod.jsonCreate a service called
hello-openshiftby running the following command:$ oc expose pod/hello-openshiftCreate a route definition called
hello-openshift-route.yaml:YAML definition of the created route for sharding
apiVersion: route.openshift.io/v1 kind: Route metadata: labels: type: sharded name: hello-openshift-edge namespace: hello-openshift spec: subdomain: hello-openshift tls: termination: edge to: kind: Service name: hello-openshiftwhere:
type-
Specifies both the label key and its corresponding label value must match the ones specified in the Ingress Controller. In this example, the Ingress Controller has the label key and value
type: sharded. subdomain-
Specifies the route gets exposed by using the value of the
subdomainfield. When you specify thesubdomainfield, you must leave the hostname unset. If you specify both thehostandsubdomainfields, then the route uses the value of thehostfield, and ignore thesubdomainfield.
Use
hello-openshift-route.yamlto create a route to thehello-openshiftapplication by running the following command:$ oc -n hello-openshift create -f hello-openshift-route.yaml
Verification
Get the status of the route with the following command:
$ oc -n hello-openshift get routes/hello-openshift-edge -o yamlThe resulting
Routeresource should look similar to the following:Example output
apiVersion: route.openshift.io/v1 kind: Route metadata: labels: type: sharded name: hello-openshift-edge namespace: hello-openshift spec: subdomain: hello-openshift tls: termination: edge to: kind: Service name: hello-openshift status: ingress: - host: hello-openshift.<apps-sharded.basedomain.example.net> routerCanonicalHostname: router-sharded.<apps-sharded.basedomain.example.net> routerName: shardedwhere:
host-
Specifies the hostname the Ingress Controller, or router, uses to expose the route. The value of the
hostfield is automatically determined by the Ingress Controller, and uses its domain. In this example, the domain of the Ingress Controller is<apps-sharded.basedomain.example.net>. <apps-sharded.basedomain.example.net>- Specifies the hostname of the Ingress Controller. If the hostname is not set, the route can use a subdomain instead. When you specify a subdomain, you automatically use the domain of the Ingress Controller that exposes the route. When a route is exposed by multiple Ingress Controllers, the route is hosted at multiple URLs.
routerName-
Specifies the name of the Ingress Controller. In this example, the Ingress Controller has the name
sharded.
22.3.5.8. Additional resources
22.4. Configuring the Ingress Controller endpoint publishing strategy
To expose Ingress Controller endpoints to external systems and enable load balancer integrations in OpenShift Container Platform, configure the endpointPublishingStrategy parameter.
On Red Hat OpenStack Platform (RHOSP), the LoadBalancerService endpoint publishing strategy is supported only if a cloud provider is configured to create health monitors. For RHOSP 16.2, this strategy is possible only if you use the Amphora Octavia provider.
For more information, see the "Setting RHOSP Cloud Controller Manager options" section of the RHOSP installation documentation.
22.4.1. Ingress Controller endpoint publishing strategy
To expose Ingress Controller endpoints to external networks in OpenShift Container Platform, configure either the NodePortService endpoint publishing strategy or the HostNetwork endpoint publishing strategy.
NodePortServiceendpoint publishing strategy-
The
NodePortServiceendpoint publishing strategy publishes the Ingress Controller using a Kubernetes NodePort service.
In this configuration, the Ingress Controller deployment uses container networking. A NodePortService is created to publish the deployment. The specific node ports are dynamically allocated by OpenShift Container Platform; however, to support static port allocations, your changes to the node port field of the managed NodePortService are preserved.
Figure 22.3. Diagram of NodePortService

The preceding graphic shows the following concepts pertaining to OpenShift Container Platform Ingress NodePort endpoint publishing strategy:
- All the available nodes in the cluster have their own, externally accessible IP addresses. The service running in the cluster is bound to the unique NodePort for all the nodes.
-
When the client connects to a node that is down, for example, by connecting the
10.0.128.4IP address in the graphic, the node port directly connects the client to an available node that is running the service. In this scenario, no load balancing is required. As the image shows, the10.0.128.4address is down and another IP address must be used instead.
The Ingress Operator ignores any updates to .spec.ports[].nodePort fields of the service.
By default, ports are allocated automatically and you can access the port allocations for integrations. However, sometimes static port allocations are necessary to integrate with existing infrastructure which may not be easily reconfigured in response to dynamic ports. To achieve integrations with static node ports, you can update the managed service resource directly.
For more information, see the Kubernetes Services documentation on NodePort.
HostNetworkendpoint publishing strategy*-
The
HostNetworkendpoint publishing strategy publishes the Ingress Controller on node ports where the Ingress Controller is deployed.
An Ingress Controller with the HostNetwork endpoint publishing strategy can have only one pod replica per node. If you want n replicas, you must use at least n nodes where those replicas can be scheduled. Because each pod replica requests ports 80 and 443 on the node host where it is scheduled, a replica cannot be scheduled to a node if another pod on the same node is using those ports.
The HostNetwork object has a hostNetwork field with the following default values for the optional binding ports: httpPort: 80, httpsPort: 443, and statsPort: 1936. By specifying different binding ports for your network, you can deploy multiple Ingress Controllers on the same node for the HostNetwork strategy.
Example
apiVersion: operator.openshift.io/v1
kind: IngressController
metadata:
name: internal
namespace: openshift-ingress-operator
spec:
domain: example.com
endpointPublishingStrategy:
type: HostNetwork
hostNetwork:
httpPort: 80
httpsPort: 443
statsPort: 193622.4.1.1. Configuring the Ingress Controller endpoint publishing scope to Internal
To restrict cluster access to internal traffic and enhance network security in OpenShift Container Platform, change the Ingress Controller scope from External to Internal.
When a cluster administrator installs a new cluster without specifying that the cluster is private, the default Ingress Controller is created with a scope set to External.
Prerequisites
-
You installed the OpenShift CLI (
oc).
Procedure
To change an
External-scoped Ingress Controller toInternal, enter the following command:$ oc -n openshift-ingress-operator patch ingresscontrollers/default --type=merge --patch='{"spec":{"endpointPublishingStrategy":{"type":"LoadBalancerService","loadBalancer":{"scope":"Internal"}}}}'
Verification
To check the status of the Ingress Controller, enter the following command:
$ oc -n openshift-ingress-operator get ingresscontrollers/default -o yamlThe
Progressingstatus condition indicates whether you must take further action. For example, the status condition can indicate that you need to delete the service by entering the following command:$ oc -n openshift-ingress delete services/router-defaultIf you delete the service, the Ingress Operator recreates it as
Internal.
22.4.1.2. Configuring the Ingress Controller endpoint publishing scope to External
To expose cluster services to public networks or the internet in OpenShift Container Platform, configure the Ingress Controller endpoint publishing scope to External.
When a cluster administrator installs a new cluster without specifying that the cluster is private, the default Ingress Controller is created with a scope set to External.
As an installation or post-installation task, a cluster administrator can configure the Ingress Controller to Internal. Additionally, a cluster administrator can change an Internal Ingress Controller to External.
On some platforms, it is necessary to delete and recreate the service.
Changing the scope can cause disruption to Ingress traffic, potentially for several minutes. This applies to platforms where it is necessary to delete and recreate the service, because the procedure can cause OpenShift Container Platform to deprovision the existing service load balancer, provision a new one, and update DNS.
Prerequisites
-
You installed the OpenShift CLI (
oc).
Procedure
To change an
Internal-scoped Ingress Controller toExternal, enter the following command:$ oc -n openshift-ingress-operator patch ingresscontrollers/private --type=merge --patch='{"spec":{"endpointPublishingStrategy":{"type":"LoadBalancerService","loadBalancer":{"scope":"External"}}}}'
Verification
To check the status of the Ingress Controller, enter the following command:
$ oc -n openshift-ingress-operator get ingresscontrollers/default -o yamlThe
Progressingstatus condition indicates whether you must take further action. For example, the status condition can indicate that you need to delete the service by entering the following command:$ oc -n openshift-ingress delete services/router-defaultIf you delete the service, the Ingress Operator recreates it as
External.
22.4.1.3. Adding a single NodePort service to an Ingress Controller
To prevent port conflicts, instead of creating a NodePort-type Service for each project, create a custom Ingress Controller that can use the NodePortService endpoint publishing strategy.
Consider this configuration for your Ingress Controller when you want to apply a set of routes, through Ingress sharding, to nodes that might already have a HostNetwork Ingress Controller.
Before you set a NodePort-type Service for each project, read the following considerations:
-
You must create a wildcard DNS record for the
NodeportIngress Controller domain. A Nodeport Ingress Controller route can be reached from the address of a worker node. For more information about the required DNS records for routes, see "User-provisioned DNS requirements". -
You must expose a route for your service and specify the
--hostnameargument for your custom Ingress Controller domain. -
You must append the port that is assigned to the
NodePort-typeServicein the route so that you can access application pods.
Prerequisites
-
You installed the OpenShift CLI (
oc). -
Logged in as a user with
cluster-adminprivileges. - You created a wildcard DNS record.
Procedure
Create a custom resource (CR) file for the Ingress Controller:
Example of a CR file that defines information for the
IngressControllerobjectapiVersion: operator.openshift.io/v1 kind: IngressController metadata: name: <custom_ic_name> namespace: openshift-ingress-operator spec: replicas: 1 domain: <custom_ic_domain_name> nodePlacement: nodeSelector: matchLabels: <key>: <value> namespaceSelector: matchLabels: <key>: <value> endpointPublishingStrategy: type: NodePortService # ...where:
metadata.name-
Specifies a custom
namefor theIngressControllerCR. spec.domain-
Specifies the DNS name that the Ingress Controller services. For example, the default ingresscontroller domain is
apps.ipi-cluster.example.com, so you would specify the<custom_ic_domain_name>asnodeportsvc.ipi-cluster.example.com. nodeSelector.matchLabels.<key>- Specifies the label for the nodes that include the custom Ingress Controller.
namespaceSelector.matchLabels.<key>-
Specifies the label for a set of namespaces. Substitute
<key>:<value>with a map of key-value pairs where<key>is a unique name for the new label and<value>is its value. For example:ingresscontroller: custom-ic.
Add a label to a node by using the
oc label nodecommand:$ oc label node <node_name> <key>=<value>-
<key>=<value>: Where<value>must match the key-value pair specified in thenodePlacementsection of yourIngressControllerCR.
-
Create the
IngressControllerobject:$ oc create -f <ingress_controller_cr>.yamlFind the port for the service created for the
IngressControllerCR:$ oc get svc -n openshift-ingressExample output that shows port
80:32432/TCPfor therouter-nodeport-custom-ic3serviceNAME TYPE CLUSTER-IP EXTERNAL-IP PORT(S) AGE router-internal-default ClusterIP 172.30.195.74 <none> 80/TCP,443/TCP,1936/TCP 223d router-nodeport-custom-ic3 NodePort 172.30.109.219 <none> 80:32432/TCP,443:31366/TCP,1936:30499/TCP 155mTo create a new project, enter the following command:
$ oc new-project <project_name>To label the new namespace, enter the following command:
$ oc label namespace <project_name> <key>=<value>-
<key>=<value>:: Where<key>=<value>must match the value in thenamespaceSelectorsection of your Ingress Controller CR.
-
Create a new application in your cluster:
$ oc new-app --image=<image_name>-
<image_name>: An example of<image_name>isquay.io/openshifttest/hello-openshift:multiarch.
-
Create a
Routeobject for a service, so that the pod can use the service to expose the application external to the cluster.$ oc expose svc/<service_name> --hostname=<svc_name>-<project_name>.<custom_ic_domain_name>NoteYou must specify the domain name of your custom Ingress Controller in the
--hostnameargument. If you do not do this, the Ingress Operator uses the default Ingress Controller to serve all the routes for your cluster.Check that the route has the
Admittedstatus and that it includes metadata for the custom Ingress Controller:$ oc get route/hello-openshift -o json | jq '.status.ingress'Example output
# ... { "conditions": [ { "lastTransitionTime": "2024-05-17T18:25:41Z", "status": "True", "type": "Admitted" } ], [ { "host": "hello-openshift.nodeportsvc.ipi-cluster.example.com", "routerCanonicalHostname": "router-nodeportsvc.nodeportsvc.ipi-cluster.example.com", "routerName": "nodeportsvc", "wildcardPolicy": "None" } ], }Update the default
IngressControllerCR to prevent the default Ingress Controller from managing theNodePort-typeService. The default Ingress Controller will continue to monitor all other cluster traffic.$ oc patch --type=merge -n openshift-ingress-operator ingresscontroller/default --patch '{"spec":{"namespaceSelector":{"matchExpressions":[{"key":"<key>","operator":"NotIn","values":["<value>]}]}}}'
Verification
Verify that the DNS entry can route inside and outside of your cluster by entering the following command. The command outputs the IP address of the node that received the label from running the
oc label nodecommand earlier in the procedure.$ dig +short <svc_name>-<project_name>.<custom_ic_domain_name>To verify that your cluster uses the IP addresses from external DNS servers for DNS resolution, check the connection of your cluster by entering the following command:
$ curl <svc_name>-<project_name>.<custom_ic_domain_name>:<port>1 <custom_ic_domain_name>:<port>: Where<port>is the node port from theNodePort-typeService. Based on example output from theoc get svc -n openshift-ingresscommand, the80:32432/TCPHTTP route means that32432is the node port.Output example
Hello OpenShift!
22.5. Configuring ingress cluster traffic using a load balancer
OpenShift Container Platform provides methods for communicating from outside the cluster with services running in the cluster. This method uses a load balancer.
Before starting the following procedures, the administrator must complete the following prerequisite tasks:
- Set up the external port to the cluster networking environment so that requests can reach the cluster.
- Have an OpenShift Container Platform cluster with at least one control plane node, at least one compute node, and a system outside the cluster that has network access to the cluster. This procedure assumes that the external system is on the same subnet as the cluster. The additional networking required for external systems on a different subnet is out-of-scope for this topic.
Make sure there is at least one user with cluster admin role. To add this role to a user, run the following command:
$ oc adm policy add-cluster-role-to-user cluster-admin username
22.5.1. Using a load balancer to get traffic into the cluster
If you do not need a specific external IP address, you can configure a load balancer service to allow external access to an OpenShift Container Platform cluster.
A load balancer service allocates a unique IP. The load balancer has a single edge router IP, which can be a virtual IP (VIP), but is still a single machine for initial load balancing.
A pool gets configured at the infrastructure level and not the cluster administrator level.
22.5.2. Creating a project and service
If the project and service that you want to expose does not exist, create the project and then create the service.
If the project and service already exists, skip to the procedure on exposing the service to create a route.
Prerequisites
-
Install the OpenShift CLI (
oc) and log in as a cluster administrator.
Procedure
Create a new project for your service by running the
oc new-projectcommand:$ oc new-project <project_name>Use the
oc new-appcommand to create your service:$ oc new-app nodejs:12~https://github.com/sclorg/nodejs-ex.gitTo verify that the service was created, run the following command:
$ oc get svc -n <project_name>Example output
NAME TYPE CLUSTER-IP EXTERNAL-IP PORT(S) AGE nodejs-ex ClusterIP 172.30.197.157 <none> 8080/TCP 70sNoteBy default, the new service does not have an external IP address.
22.5.3. Exposing the service by creating a route
To enable external access to your application that runs on OpenShift Container Platform, you can expose the service as a route by using the oc expose command.
Prerequisites
- You logged into OpenShift Container Platform.
Procedure
Log in to the project where the service you want to expose is located:
$ oc project <project_name>Run the
oc expose servicecommand to expose the route:$ oc expose service nodejs-exExample output
route.route.openshift.io/nodejs-ex exposedTo verify that the service is exposed, you can use a tool, such as
curlto check that the service is accessible from outside the cluster.To find the hostname of the route, enter the following command:
$ oc get routeExample output
NAME HOST/PORT PATH SERVICES PORT TERMINATION WILDCARD nodejs-ex nodejs-ex-myproject.example.com nodejs-ex 8080-tcp NoneTo check that the host responds to a GET request, enter the following command:
Example
curlcommand$ curl --head nodejs-ex-myproject.example.comExample output
HTTP/1.1 200 OK ...
22.5.4. Creating a load balancer service
To distribute incoming traffic efficiently and ensure high availability for your applications in OpenShift Container Platform, create a load balancer service.
Prerequisites
- Make sure that the project and service you want to expose exist.
- Your cloud provider supports load balancers.
Procedure
- Log in to OpenShift Container Platform.
Load the project where the service you want to expose is located.
Example command
$ oc project project1Open a text file on the control plane node and paste the following text into the file. Edit the file as needed.
Sample load balancer configuration file
apiVersion: v1 kind: Service metadata: name: egress-2 spec: ports: - name: db port: 3306 loadBalancerIP: loadBalancerSourceRanges: - 10.0.0.0/8 - 192.168.0.0/16 type: LoadBalancer selector: name: mysqlwhere:
metadata.name- Specifies a descriptive name for the load balancer service.
ports.port- Specifies the same port that the service you want to expose is listening on.
loadBalancerSourceRanges- Specifies a list of specific IP addresses to restrict traffic through the load balancer. The parameter is ignored if the cloud provider does not support the feature.
type-
Specifies
Loadbalanceras the type. selector.nameSpecifies the name of the service.
NoteTo restrict the traffic through the load balancer to specific IP addresses, use the
spec.endpointPublishingStrategy.loadBalancer.allowedSourceRangesIngress Controller parameter. Do not set theloadBalancerSourceRangesparameter.
- Save and exit the file.
Run the following command to create the service:
$ oc create -f <file_name>For example:
$ oc create -f mysql-lb.yamlExecute the following command to view the new service:
$ oc get svcExample output
NAME TYPE CLUSTER-IP EXTERNAL-IP PORT(S) AGE egress-2 LoadBalancer 172.30.22.226 ad42f5d8b303045-487804948.example.com 3306:30357/TCP 15mThe service has an external IP address automatically assigned if there is a cloud provider enabled.
On the master, use a tool, such as
curl, to make sure you can reach the service by using the public IP address:$ curl <public_ip>:<port>For example:
$ curl 172.29.121.74:3306The examples in this section use a MySQL service, which requires a client application. If you get a string of characters with the
Got packets out of ordermessage, you are connecting with the service:If you have a MySQL client, log in with the standard CLI command:
$ mysql -h 172.30.131.89 -u admin -pExample output
Enter password: Welcome to the MariaDB monitor. Commands end with ; or \g. MySQL [(none)]>
22.6. Configuring ingress cluster traffic on AWS
OpenShift Container Platform provides methods for communicating from outside the cluster with services running in the cluster. This method uses load balancers on Amazon Web Services (AWS), specifically a Network Load Balancer (NLB) or a Classic Load Balancer (CLB). Both types of load balancers can forward the IP address of the client to the node, but a CLB requires proxy protocol support, which OpenShift Container Platform automatically enables.
There are two ways to configure an Ingress Controller to use an NLB:
-
By force replacing the Ingress Controller that is currently using a CLB. This deletes the
IngressControllerobject and an outage occurs while the new DNS records propagate and the NLB is being provisioned. -
By editing an existing Ingress Controller that uses a CLB to then use an NLB. This changes the load balancer without having to delete and recreate the
IngressControllerobject.
Both methods can be used to switch from an NLB to a CLB.
You can configure these load balancers on a new or existing AWS cluster.
22.6.1. Configuring Classic Load Balancer timeouts on AWS
To prevent connection drops for long-running processes in OpenShift Container Platform, configure custom timeout periods for specific routes or Ingress Controllers.
Ensure these settings account for the Amazon Web Services Classic Load Balancer (CLB) default timeout of 60 seconds to maintain stable network traffic.
If the timeout period of the CLB is shorter than the route timeout or Ingress Controller timeout, the load balancer can prematurely terminate the connection. You can prevent this problem by increasing both the timeout period of the route and CLB.
22.6.1.1. Configuring route timeouts
You can configure the default timeouts for an existing route when you have services in need of a low timeout, which is required for Service Level Availability (SLA) purposes, or a high timeout, for cases with a slow back end.
If you configured a user-managed external load balancer in front of your OpenShift Container Platform cluster, ensure that the timeout value for the user-managed external load balancer is higher than the timeout value for the route. This configuration prevents network congestion issues over the network that your cluster uses.
Prerequisites
- You deployed an Ingress Controller on a running cluster.
Procedure
Using the
oc annotatecommand, add the timeout to the route:$ oc annotate route <route_name> \ --overwrite haproxy.router.openshift.io/timeout=<timeout><time_unit><timeout>: Supported time units are microseconds (us), milliseconds (ms), seconds (s), minutes (m), hours (h), or days (d).The following example sets a timeout of two seconds on a route named
myroute:$ oc annotate route myroute --overwrite haproxy.router.openshift.io/timeout=2s
22.6.1.2. Configuring Classic Load Balancer timeouts
You can configure the default timeouts for a Classic Load Balancer (CLB) to extend idle connections.
Prerequisites
- You must have a deployed Ingress Controller on a running cluster.
Procedure
Set an Amazon Web Services connection idle timeout of five minutes for the default
ingresscontrollerby running the following command:$ oc -n openshift-ingress-operator patch ingresscontroller/default \ --type=merge --patch='{"spec":{"endpointPublishingStrategy": \ {"type":"LoadBalancerService", "loadBalancer": \ {"scope":"External", "providerParameters":{"type":"AWS", "aws": \ {"type":"Classic", "classicLoadBalancer": \ {"connectionIdleTimeout":"5m"}}}}}}}'Optional: Restore the default value of the timeout by running the following command:
$ oc -n openshift-ingress-operator patch ingresscontroller/default \ --type=merge --patch='{"spec":{"endpointPublishingStrategy": \ {"loadBalancer":{"providerParameters":{"aws":{"classicLoadBalancer": \ {"connectionIdleTimeout":null}}}}}}}'NoteYou must specify the
scopefield when you change the connection timeout value unless the current scope is already set. When you set thescopefield, you do not need to do so again if you restore the default timeout value.
22.6.2. Configuring ingress cluster traffic on AWS using a Network Load Balancer
To enable high-performance communication between external services and your OpenShift Container Platform cluster, configure an Amazon Web Services Network Load Balancer (NLB). You can set up an NLB on a new or existing AWS cluster to manage ingress traffic with low latency.
22.6.2.1. Switching the Ingress Controller from using a Classic Load Balancer to a Network Load Balancer
To improve performance and reduce latency for cluster traffic in OpenShift Container Platform on Amazon Web Services, switch an Ingress Controller using a Classic Load Balancer (CLB) to one that uses a Network Load Balancer (NLB).
Switching between these load balancers does not delete the IngressController object.
This procedure might cause the following issues:
- An outage that can last several minutes due to new DNS records propagation, new load balancers provisioning, and other factors. IP addresses and canonical names of the Ingress Controller load balancer might change after applying this procedure.
- Leaked load balancer resources due to a change in the annotation of the service.
Procedure
Modify the existing Ingress Controller that you want to switch to by using an NLB. This example assumes that your default Ingress Controller has an
Externalscope and no other customizations:Example
ingresscontroller.yamlfileapiVersion: operator.openshift.io/v1 kind: IngressController metadata: creationTimestamp: null name: default namespace: openshift-ingress-operator spec: endpointPublishingStrategy: loadBalancer: scope: External providerParameters: type: AWS aws: type: NLB type: LoadBalancerServiceNoteIf you do not specify a value for the
spec.endpointPublishingStrategy.loadBalancer.providerParameters.aws.typefield, the Ingress Controller uses thespec.loadBalancer.platform.aws.typevalue from the clusterIngressconfiguration that was set during installation.TipIf your Ingress Controller has other customizations that you want to update, such as changing the domain, consider force replacing the Ingress Controller definition file instead.
Apply the changes to the Ingress Controller YAML file by running the command:
$ oc apply -f ingresscontroller.yamlExpect several minutes of outages while the Ingress Controller updates.
22.6.2.2. Switching the Ingress Controller from using a Network Load Balancer to a Classic Load Balancer
To support specific networking configurations in OpenShift Container Platform on Amazon Web Services, switch an Ingress Controller using a Network Load Balancer (NLB) to one that uses a Classic Load Balancer (CLB).
Switching between these load balancers does not delete the IngressController object.
This procedure might cause an outage that can last several minutes due to new DNS records propagation, new load balancers provisioning, and other factors. IP addresses and canonical names of the Ingress Controller load balancer might change after applying this procedure.
Procedure
Modify the existing Ingress Controller that you want to switch to using a CLB. This example assumes that your default Ingress Controller has an
Externalscope and no other customizations:Example
ingresscontroller.yamlfileapiVersion: operator.openshift.io/v1 kind: IngressController metadata: creationTimestamp: null name: default namespace: openshift-ingress-operator spec: endpointPublishingStrategy: loadBalancer: scope: External providerParameters: type: AWS aws: type: Classic type: LoadBalancerServiceNoteIf you do not specify a value for the
spec.endpointPublishingStrategy.loadBalancer.providerParameters.aws.typefield, the Ingress Controller uses thespec.loadBalancer.platform.aws.typevalue from the clusterIngressconfiguration that was set during installation.TipIf your Ingress Controller has other customizations that you want to update, such as changing the domain, consider force replacing the Ingress Controller definition file instead.
Apply the changes to the Ingress Controller YAML file by running the command:
$ oc apply -f ingresscontroller.yamlExpect several minutes of outages while the Ingress Controller updates.
22.6.2.3. Replacing Ingress Controller Classic Load Balancer with Network Load Balancer
To improve performance and reduce latency for traffic in OpenShift Container Platform on Amazon Web Services, replace an Ingress Controller using a Classic Load Balancer (CLB) with one that uses a Network Load Balancer (NLB).
This procedure might cause the following issues:
- An outage that can last several minutes due to new DNS records propagation, new load balancers provisioning, and other factors. IP addresses and canonical names of the Ingress Controller load balancer might change after applying this procedure.
- Leaked load balancer resources due to a change in the annotation of the service.
Procedure
Create a file with a new default Ingress Controller. The following example assumes that your default Ingress Controller has an
Externalscope and no other customizations:Example
ingresscontroller.ymlfileapiVersion: operator.openshift.io/v1 kind: IngressController metadata: creationTimestamp: null name: default namespace: openshift-ingress-operator spec: endpointPublishingStrategy: loadBalancer: scope: External providerParameters: type: AWS aws: type: NLB type: LoadBalancerServiceIf your default Ingress Controller has other customizations, ensure that you modify the file accordingly.
TipIf your Ingress Controller has no other customizations and you are only updating the load balancer type, consider following the procedure detailed in "Switching the Ingress Controller from using a Classic Load Balancer to a Network Load Balancer".
Force replace the Ingress Controller YAML file:
$ oc replace --force --wait -f ingresscontroller.ymlWait until the Ingress Controller is replaced. Expect several of minutes of outages.
22.6.2.4. Configuring an Ingress Controller Network Load Balancer on an existing AWS cluster
To improve performance for high-traffic workloads in OpenShift Container Platform, configure an Ingress Controller backed by an Amazon Web Services Network Load Balancer (NLB) on an existing cluster.
You can create an Ingress Controller backed by an Amazon Web Services Network Load Balancer (NLB) on an existing cluster.
Prerequisites
- You installed an AWS cluster.
PlatformStatusof the infrastructure resource must be AWS.To verify that the
PlatformStatusis AWS, run the following command:$ oc get infrastructure/cluster -o jsonpath='{.status.platformStatus.type}' AWS
Procedure
Create the Ingress Controller manifest:
$ cat ingresscontroller-aws-nlb.yamlExample output
apiVersion: operator.openshift.io/v1 kind: IngressController metadata: name: <ingress_controller_name> namespace: openshift-ingress-operator spec: domain: <unique_ingress_domain endpointPublishingStrategy: type: LoadBalancerService loadBalancer: scope: External providerParameters: type: AWS aws: type: NLBwhere:
<ingress_controller_name>- Specifies a unique name for the Ingress Controller.
<unique_ingress_domain>-
Specifies a domain name that is unique among all Ingress Controllers in the cluster. This variable must be a subdomain of the DNS name
<clustername>.<domain>. scope-
Specifies the type of NLB, either
Externalto use an external NLB orInternalto use an internal NLB.
Create the resource in the cluster:
$ oc create -f ingresscontroller-aws-nlb.yamlImportantBefore you can configure an Ingress Controller NLB on a new AWS cluster, you must complete the creating the installation configuration file procedure. For more information, see "Creating the installation configuration file".
22.7. Configuring ingress cluster traffic for a service external IP
You can use either a MetalLB implementation or an IP failover deployment to attach an ExternalIP resource to a service so that the service is available to traffic outside your OpenShift Container Platform cluster.
Hosting an external IP address in this way is only applicable for a cluster installed on bare-metal hardware.
You must ensure that you correctly configure the external network infrastructure to route traffic to the service.
Before you begin the procedure, ensure that you meet the following prerequisite:
- You configured your cluster with ExternalIPs enabled. For more information, see "Configuring ExternalIPs for services" in the Additional resources section.
Do not use the same ExternalIP for the egress IP.
22.7.1. Attaching an ExternalIP to a service
To route traffic from external networks to your applications in OpenShift Container Platform, attach an ExternalIP resource to a service.
If you configured your cluster to automatically attach the resource to a service, you might not need to manually attach an ExternalIP to the service.
The examples in the procedure use a scenario that manually attaches an ExternalIP resource to a service in a cluster with an IP failover configuration.
Procedure
Confirm compatible IP address ranges for the ExternalIP resource by entering the following command in your CLI:
$ oc get networks.config cluster -o jsonpath='{.spec.externalIP}{"\n"}'NoteIf
autoAssignCIDRsis set and you did not specify a value forspec.externalIPsin the ExternalIP resource, OpenShift Container Platform automatically assigns ExternalIP to a newServiceobject.Choose one of the following options to attach an ExternalIP resource to the service:
If you are creating a new service, specify a value in the
spec.externalIPsparameter and array of one or more valid IP addresses in theallowedCIDRsparameter.Example of service YAML configuration file that supports an ExternalIP resource
apiVersion: v1 kind: Service metadata: name: svc-with-externalip spec: externalIPs: policy: allowedCIDRs: - 192.168.123.0/28 # ...If you are attaching an ExternalIP to an existing service, enter the following command. Replace
<name>with the service name. Replace<ip_address>with a valid ExternalIP address. You can provide multiple IP addresses separated by commas.$ oc patch svc <name> -p \ '{ "spec": { "externalIPs": [ "<ip_address>" ] } }'For example:
$ oc patch svc mysql-55-rhel7 -p '{"spec":{"externalIPs":["192.174.120.10"]}}'Example output
"mysql-55-rhel7" patched
To confirm that an ExternalIP address is attached to the service, enter the following command. If you specified an ExternalIP for a new service, you must create the service first.
$ oc get svcExample output
NAME CLUSTER-IP EXTERNAL-IP PORT(S) AGE mysql-55-rhel7 172.30.131.89 192.174.120.10 3306/TCP 13m
22.8. Configuring ingress cluster traffic by using a NodePort
To enable external access to your application for specific networking requirements, expose a service by using a NodePort.
This configuration opens a specific port on every node in the cluster, allowing external traffic to reach your workloads by using an IP address of any node.
OpenShift Container Platform provides methods for communicating from outside the cluster with services running in the cluster. This method uses a NodePort.
Before starting the following procedures, the administrator must complete the following prerequisite tasks:
- Set up the external port to the cluster networking environment so that requests can reach the cluster.
- Have an OpenShift Container Platform cluster with at least one control plane node, at least one compute node, and a system outside the cluster that has network access to the cluster. This procedure assumes that the external system is on the same subnet as the cluster. The additional networking required for external systems on a different subnet is out-of-scope for this topic.
Make sure there is at least one user with cluster admin role. To add this role to a user, run the following command:
$ oc adm policy add-cluster-role-to-user cluster-admin <user_name>
22.8.1. Using a NodePort to get traffic into the cluster
Use a NodePort-type Service resource to expose a service on a specific port on all nodes in the cluster.
The port is specified in the Service resource’s .spec.ports[*].nodePort parameter
Using a node port requires additional port resources.
A NodePort exposes the service on a static port on the IP address of a node. A NodePort spans the 30000 to 32767 IP address ranges by default, which means a NodePort is unlikely to match the intended port of a service. For example, port 8080 might be exposed as port 31020 on the node.
The administrator must ensure the external IP addresses are routed to the nodes.
A NodePort and external IPs are independent and both can be used concurrently.
22.8.2. Creating a project and service
If the project and service that you want to expose does not exist, create the project and then create the service.
If the project and service already exists, skip to the procedure on exposing the service to create a route.
Prerequisites
-
Install the OpenShift CLI (
oc) and log in as a cluster administrator.
Procedure
Create a new project for your service by running the
oc new-projectcommand:$ oc new-project <project_name>Use the
oc new-appcommand to create your service:$ oc new-app nodejs:12~https://github.com/sclorg/nodejs-ex.gitTo verify that the service was created, run the following command:
$ oc get svc -n <project_name>Example output
NAME TYPE CLUSTER-IP EXTERNAL-IP PORT(S) AGE nodejs-ex ClusterIP 172.30.197.157 <none> 8080/TCP 70sNoteBy default, the new service does not have an external IP address.
22.8.3. Exposing the service by creating a route
To enable external access to your application that runs on OpenShift Container Platform, you can expose the service as a route by using the oc expose command.
Prerequisites
- You logged into OpenShift Container Platform.
Procedure
Log in to the project where the service you want to expose is located:
$ oc project <project_name>To expose a node port for the application, modify the custom resource definition (CRD) of a service by entering the following command:
$ oc edit svc <service_name>Example output
spec: ports: - name: 8443-tcp nodePort: 30327 port: 8443 protocol: TCP targetPort: 8443 sessionAffinity: None type: NodePort-
nodePort: Optional parameter. Specifies the node port range for the application. By default, OpenShift Container Platform selects an available port in the30000-32767range. -
type: Specifies the service type.
-
Optional: To confirm the service is available with a node port exposed, enter the following command:
$ oc get svc -n myprojectExample output
NAME TYPE CLUSTER-IP EXTERNAL-IP PORT(S) AGE nodejs-ex ClusterIP 172.30.217.127 <none> 3306/TCP 9m44s nodejs-ex-ingress NodePort 172.30.107.72 <none> 3306:31345/TCP 39sOptional: To remove the service created automatically by the
oc new-appcommand, enter the following command:$ oc delete svc nodejs-ex
Verification
To check that the service node port is updated with a port in the
30000-32767range, enter the following command:$ oc get svcIn the following example output, the updated port is
30327:Example output
NAME TYPE CLUSTER-IP EXTERNAL-IP PORT(S) AGE httpd NodePort 172.xx.xx.xx <none> 8443:30327/TCP 109s
22.9. Configuring ingress cluster traffic using load balancer allowed source ranges
You can specify a list of IP address ranges for the Ingress Controller. This action restricts access to the load balancer service when you specify the LoadBalancerService value for the endpointPublishingStrategy parameter.
22.9.1. Configuring load balancer allowed source ranges
You can enable and configure the spec.endpointPublishingStrategy.loadBalancer.allowedSourceRanges parameter. By configuring load balancer allowed source ranges, you can limit the access to the load balancer for the Ingress Controller to a specified list of IP address ranges.
The Ingress Operator reconciles the load balancer Service and sets the spec.loadBalancerSourceRanges parameter based on AllowedSourceRanges.
If you have already set the spec.loadBalancerSourceRanges parameter or the load balancer service anotation service.beta.kubernetes.io/load-balancer-source-ranges in a previous version of OpenShift Container Platform, Ingress Controller starts reporting Progressing=True after an upgrade. To fix this, set AllowedSourceRanges that overwrites the spec.loadBalancerSourceRanges parameter and clears the service.beta.kubernetes.io/load-balancer-source-ranges annotation. Ingress Controller starts reporting Progressing=False again.
Prerequisites
- You have a deployed Ingress Controller on a running cluster.
Procedure
Set the allowed source ranges API for the Ingress Controller by running the following command:
$ oc -n openshift-ingress-operator patch ingresscontroller/default \ --type=merge --patch='{"spec":{"endpointPublishingStrategy": \ {"type":"LoadBalancerService", "loadbalancer": \ {"scope":"External", "allowedSourceRanges":["0.0.0.0/0"]}}}}'where:
allowedSourceRanges-
The example value
0.0.0.0/0specifies the allowed source range.
22.9.2. Migrating to load balancer allowed source ranges
To ensure long-term compatibility and use stable API parameters in OpenShift Container Platform, migrate from the legacy service.beta.kubernetes.io/load-balancer-source-ranges annotation to load balancer allowed source ranges.
When you set the AllowedSourceRanges, the Ingress Controller sets the spec.loadBalancerSourceRanges parameter based on the AllowedSourceRanges value and unsets the service.beta.kubernetes.io/load-balancer-source-ranges annotation.
If you have already set the spec.loadBalancerSourceRanges parameter or the load balancer service anotation service.beta.kubernetes.io/load-balancer-source-ranges in a previous version of OpenShift Container Platform, the Ingress Controller starts reporting Progressing=True after an upgrade. To fix this, set AllowedSourceRanges that overwrites the spec.loadBalancerSourceRanges parameter and clears the service.beta.kubernetes.io/load-balancer-source-ranges annotation. The Ingress Controller starts reporting Progressing=False again.
Prerequisites
-
You have set the
service.beta.kubernetes.io/load-balancer-source-rangesannotation.
Procedure
Check that the
service.beta.kubernetes.io/load-balancer-source-rangesis set by entering the following command:$ oc get svc router-default -n openshift-ingress -o yamlExample output
apiVersion: v1 kind: Service metadata: annotations: service.beta.kubernetes.io/load-balancer-source-ranges: 192.168.0.1/32Check that the
spec.loadBalancerSourceRangesparameter is unset by entering the following command:$ oc get svc router-default -n openshift-ingress -o yamlExample output
... spec: loadBalancerSourceRanges: - 0.0.0.0/0 ...- Update your cluster to OpenShift Container Platform 4.16.
Set the allowed source ranges API for the
ingresscontrollerby running the following command:$ oc -n openshift-ingress-operator patch ingresscontroller/default \ --type=merge --patch='{"spec":{"endpointPublishingStrategy": \ {"loadBalancer":{"allowedSourceRanges":["0.0.0.0/0"]}}}}'where:
allowedSourceRanges-
The example value
0.0.0.0/0specifies the allowed source range.
22.10. Patching existing ingress objects
You can update or modify the following fields of existing Ingress objects without recreating the objects or disrupting services to these objects:
- Specifications
- Host
- Path
- Backend services
- SSL/TLS settings
- Annotations
22.10.1. Patching Ingress objects to resolve an ingressWithoutClassName alert
To prevent certain routing issues, you must define define the ingressClassName field for each Ingress object.
Approximately 24 hours after you create an Ingress object, the Ingress Controller sends you an ingressWithoutClassName alert to remind you to set the ingressClassName field.
The procedure demonstrates patching the Ingress objects with a completed ingressClassName field to ensure proper routing and functionality.
Procedure
List all
IngressClassobjects:$ oc get ingressclassList all
Ingressobjects in all namespaces:$ oc get ingress -APatch the
Ingressobject by running the following command. This command patches theIngressobject to include the desired ingress class name.$ oc patch ingress/<ingress_name> --type=merge --patch '{"spec":{"ingressClassName":"openshift-default"}}'-
<ingress_name>: Replace<ingress_name>with the name of theIngressobject.
-
Chapter 23. Kubernetes NMState
23.1. Observing and updating the node network state and configuration
To observe and update the node network state and configuration in your cluster, you can use the Kubernetes NMState Operator. You can view network states, create and manage network configuration policies, and configure interfaces on cluster nodes.
For more information about how to install the NMState Operator, see Kubernetes NMState Operator.
You cannot modify an existing br-ex bridge, an OVN-Kubernetes-managed Open vSwitch bridge, or any interfaces, bonds, VLANs, and so on that associate with the br-ex bridge. However, you can configure a customized br-ex bridge.
For more information, see "Creating a manifest object that includes a customized br-ex bridge" in the Deploying installer-provisioned clusters on bare metal document or the Installing a user-provisioned cluster on bare metal document.
23.1.1. Viewing the network state of a node by using the CLI
Node network state is the network configuration for all nodes in the cluster. A NodeNetworkState object exists on every node in the cluster. This object is periodically updated and captures the state of the network for that node.
Procedure
List all the
NodeNetworkStateobjects in the cluster:$ oc get nnsInspect a
NodeNetworkStateobject to view the network on that node. The output in this example has been redacted for clarity:$ oc get nns node01 -o yamlExample output
apiVersion: nmstate.io/v1 kind: NodeNetworkState metadata: name: node01 status: currentState: dns-resolver: # ... interfaces: # ... route-rules: # ... routes: # ... lastSuccessfulUpdateTime: "2020-01-31T12:14:00Z"metadata.name-
The name of the
NodeNetworkStateobject is taken from the node. status.currentState-
The
currentStatecontains the complete network configuration for the node, including DNS, interfaces, and routes. status.lastSuccessfulUpdateTime- Timestamp of the last successful update. This is updated periodically if the node is reachable and can be used to evaluate the freshness of the report.
23.1.2. Viewing the network state of a node from the web console
As an administrator, you can use the OpenShift Container Platform web console to observe NodeNetworkState resources and network interfaces, and access network details.
Procedure
Navigate to Networking → NodeNetworkState.
In the NodeNetworkState page, you can view the list of
NodeNetworkStateresources and the corresponding interfaces that are created on the nodes. You can use Filter based on Interface state, Interface type, and IP, or the search bar based on criteria Name or Label, to narrow down the displayedNodeNetworkStateresources.-
To access the detailed information about
NodeNetworkStateresource, click theNodeNetworkStateresource name listed in the Name column . -
to expand and view the Network Details section for the
NodeNetworkStateresource, click the > icon . Alternatively, you can click on each interface type under the Network interface column to view the network details.
23.1.3. About the NodeNetworkConfigurationPolicy manifest file
A NodeNetworkConfigurationPolicy manifest file defines policies that the Kubernetes NMState Operator uses to configure networking for nodes in your OpenShift Container Platform cluster. You can create, edit, and delete these policies to manage node network configurations.
If you want to apply multiple NNCP CRs to a node, you must create the NNCPs in a logical order that is based on the alphanumeric sorting of the policy names. The Kubernetes NMState Operator continuously checks for a newly created NNCP CR so that the Operator can instantly apply the CR to node. Consider the following logical order issue example:
-
You create NNCP 1 for defining the bridge interface that listens on a VLAN port, such as
eth1.1000. -
You create NNCP 2 for defining the VLAN interface and specify the port for this interface, such as
eth1.1000. - You apply NNCP 1 before you apply NNCP 2 to the node.
The node experiences a node connectivity issue because port eth1.1000 does not exist. As a result, the cluster fails.
After you apply a node network policy to a node, the Kubernetes NMState Operator configures the networking configuration for nodes according to the node network policy details.
You can create an NNCP by using either the OpenShift CLI (oc) or the OpenShift Container Platform web console. As a postinstallation task you can create an NNCP or edit an existing NNCP.
Before you create an NNCP, ensure that you read the "Example policy configurations for different interfaces" document.
If you want to delete an NNCP, you can use the oc delete nncp command to complete this action. However, this command does not delete any objects, such as a bridge interface.
Deleting the node network policy that added an interface to a node does not change the configuration of the policy on the node. Similarly, removing an interface does not delete the policy, because the Kubernetes NMState Operator re-adds the removed interface whenever a pod or a node is restarted.
To effectively delete the NNCP, the node network policy, and any interfaces would typically require the following actions:
-
Edit the NNCP and remove interface details from the file. Ensure that you do not remove
name,state, andtypeparameters from the file. -
Add
state: absentunder theinterfaces.statesection of the NNCP. -
Run
oc apply -f <nncp_file_name>. After the Kubernetes NMState Operator applies the node network policy to each node in your cluster, any interface that exists on each node is now marked as absent. -
Run
oc delete nncpto delete the NNCP.
Additional resources
23.1.4. Managing policy from the web console
You can update the node network configuration, such as adding or removing interfaces from nodes, by applying NodeNetworkConfigurationPolicy manifests to the cluster. Manage the policy from the web console by accessing the list of created policies in the NodeNetworkConfigurationPolicy page under the Networking menu. This page enables you to create, update, monitor, and delete the policies.
23.1.4.1. Monitoring the policy status
You can monitor the policy status from the NodeNetworkConfigurationPolicy page. This page displays all the policies created in the cluster in a tabular format, with the following columns:
- Name
- The name of the policy created.
- Matched nodes
- The count of nodes where the policies are applied. This could be either a subset of nodes based on the node selector or all the nodes on the cluster.
- Node network state
- The enactment state of the matched nodes. You can click on the enactment state and view detailed information on the status.
To find the desired policy, you can filter the list either based on enactment state by using the Filter option, or by using the search option.
23.1.4.2. Creating a policy
You can create a policy by using either a form or YAML in the web console.
Procedure
- Navigate to Networking → NodeNetworkConfigurationPolicy.
In the NodeNetworkConfigurationPolicy page, click Create, and select From Form option.
In case there are no existing policies, you can alternatively click Create NodeNetworkConfigurationPolicy to createa policy using form.
NoteTo create policy using YAML, click Create, and select With YAML option. The following steps are applicable to create a policy only by using form.
- Optional: Check the Apply this NodeNetworkConfigurationPolicy only to specific subsets of nodes using the node selector checkbox to specify the nodes where the policy must be applied.
- Enter the policy name in the Policy name field.
- Optional: Enter the description of the policy in the Description field.
Optional: In the Policy Interface(s) section, a bridge interface is added by default with preset values in editable fields. Edit the values by executing the following steps:
- Enter the name of the interface in Interface name field.
- Select the network state from Network state dropdown. The default selected value is Up.
Select the type of interface from Type dropdown. The available values are Bridge, Bonding, and Ethernet. The default selected value is Bridge.
NoteAddition of a VLAN interface by using the form is not supported. To add a VLAN interface, you must use YAML to create the policy. Once added, you cannot edit the policy by using form.
Optional: In the IP configuration section, check IPv4 checkbox to assign an IPv4 address to the interface, and configure the IP address assignment details:
- Click IP address to configure the interface with a static IP address, or DHCP to auto-assign an IP address.
If you have selected IP address option, enter the IPv4 address in IPV4 address field, and enter the prefix length in Prefix length field.
If you have selected DHCP option, uncheck the options that you want to disable. The available options are Auto-DNS, Auto-routes, and Auto-gateway. All the options are selected by default.
- Optional: Enter the port number in Port field.
- Optional: Check the checkbox Enable STP to enable STP.
- Optional: To add an interface to the policy, click Add another interface to the policy.
- Optional: To remove an interface from the policy, click icon next to the interface.
NoteAlternatively, you can click Edit YAML on the top of the page to continue editing the form using YAML.
- Click Create to complete policy creation.
23.1.5. Updating the NodeNetworkConfigurationPolicy manifest file
To modify the network configuration for nodes in your OpenShift Container Platform cluster, you can update the NodeNetworkConfigurationPolicy manifest file.
23.1.5.1. Updating the policy by using form
Procedure
- Navigate to Networking → NodeNetworkConfigurationPolicy.
-
In the NodeNetworkConfigurationPolicy page, click the
 icon placed next to the policy you want to edit, and click Edit.
- Edit the fields that you want to update.
- Click Save.
Addition of a VLAN interface using the form is not supported. To add a VLAN interface, you must use YAML to create the policy. Once added, you cannot edit the policy using form.
23.1.5.2. Updating the policy by using YAML
Procedure
- Navigate to Networking → NodeNetworkConfigurationPolicy.
- In the NodeNetworkConfigurationPolicy page, click the policy name under the Name column for the policy you want to edit.
- Click the YAML tab, and edit the YAML.
- Click Save.
23.1.5.3. Deleting the policy
Procedure
- Navigate to Networking → NodeNetworkConfigurationPolicy.
-
In the NodeNetworkConfigurationPolicy page, click the
icon placed next to the policy you want to delete, and click Delete.
- In the pop-up window, enter the policy name to confirm deletion, and click Delete.
23.1.6. Managing the NodeNetworkConfigurationPolicy manifest file
To configure network interfaces on nodes in your OpenShift Container Platform cluster, you can manage the NodeNetworkConfigurationPolicy manifest file by using the CLI.
23.1.6.1. Creating an interface on nodes
Create an interface on nodes in the cluster by applying a NodeNetworkConfigurationPolicy (NNCP) manifest to the cluster. The manifest details the requested configuration for the interface.
By default, the manifest applies to all nodes in the cluster. To add the interface to specific nodes, add the spec: nodeSelector parameter and the appropriate <key>:<value> for your node selector.
You can configure multiple nmstate-enabled nodes concurrently. The configuration applies to 50% of the nodes in parallel. This strategy prevents the entire cluster from being unavailable if the network connection fails. To apply the policy configuration in parallel to a specific portion of the cluster, use the maxUnavailable parameter in the NodeNetworkConfigurationPolicy manifest configuration file.
If you have two nodes and you apply an NNCP manifest with the maxUnavailable parameter set to 50% to these nodes, one node at a time receives the NNCP configuration. If you then introduce an additional NNCP manifest file with the maxUnavailable parameter set to 50%, this NCCP is independent of the initial NNCP; this means that if both NNCP manifests apply a bad configuration to nodes, you can no longer guarantee that half of your cluster is functional.
Procedure
Create the
NodeNetworkConfigurationPolicymanifest. The following example configures a Linux bridge on all worker nodes and configures the DNS resolver:apiVersion: nmstate.io/v1 kind: NodeNetworkConfigurationPolicy metadata: name: br1-eth1-policy1 spec: nodeSelector:2 node-role.kubernetes.io/worker: ""3 maxUnavailable: 34 desiredState: interfaces: - name: br1 description: Linux bridge with eth1 as a port5 type: linux-bridge state: up ipv4: dhcp: true enabled: true auto-dns: false bridge: options: stp: enabled: false port: - name: eth1 dns-resolver:6 config: search: - example.com - example.org server: - 8.8.8.8- 1 1
- Name of the policy.
- 2
- Optional: If you do not include the
nodeSelectorparameter, the policy applies to all nodes in the cluster. - 3
- This example uses the
node-role.kubernetes.io/worker: ""node selector to select all worker nodes in the cluster. - 4
- Optional: Specifies the maximum number of nmstate-enabled nodes that the policy configuration can be applied to concurrently. This parameter can be set to either a percentage value (string), for example,
"10%", or an absolute value (number), such as3. - 5
- Optional: Human-readable description for the interface.
- 6
- Optional: Specifies the search and server settings for the DNS server.
Create the node network policy:
$ oc apply -f br1-eth1-policy.yaml1 - 1
- File name of the node network configuration policy manifest.
23.1.6.2. Confirming node network policy updates on nodes
When you apply a node network policy, a NodeNetworkConfigurationEnactment object is created for every node in the cluster. The node network configuration enactment is a read-only object that represents the status of execution of the policy on that node. If the policy fails to be applied on the node, the enactment for that node includes a traceback for troubleshooting.
Procedure
To confirm that a policy has been applied to the cluster, list the policies and their status:
$ oc get nncpOptional: If a policy is taking longer than expected to successfully configure, you can inspect the requested state and status conditions of a particular policy:
$ oc get nncp <policy> -o yamlOptional: If a policy is taking longer than expected to successfully configure on all nodes, you can list the status of the enactments on the cluster:
$ oc get nnceOptional: To view the configuration of a particular enactment, including any error reporting for a failed configuration:
$ oc get nnce <node>.<policy> -o yaml
23.1.6.3. Removing an interface from nodes
You can remove an interface from one or more nodes in the cluster by editing the NodeNetworkConfigurationPolicy object and setting the state of the interface to absent.
Removing an interface from a node does not automatically restore the node network configuration to a previous state. If you want to restore the previous state, you will need to define that node network configuration in the policy.
If you remove a bridge or bonding interface, any node NICs in the cluster that were previously attached or subordinate to that bridge or bonding interface are placed in a down state and become unreachable. To avoid losing connectivity, configure the node NIC in the same policy so that it has a status of up and either DHCP or a static IP address.
Deleting the node network policy that added an interface does not change the configuration of the policy on the node. Although a NodeNetworkConfigurationPolicy is an object in the cluster, the object only represents the requested configuration. Similarly, removing an interface does not delete the policy.
Procedure
Update the
NodeNetworkConfigurationPolicymanifest used to create the interface. The following example removes a Linux bridge and configures theeth1NIC with DHCP to avoid losing connectivity:apiVersion: nmstate.io/v1 kind: NodeNetworkConfigurationPolicy metadata: name: <br1-eth1-policy> spec: nodeSelector: node-role.kubernetes.io/worker: "" desiredState: interfaces: - name: br1 type: linux-bridge state: absent - name: eth1 type: ethernet state: up ipv4: dhcp: true enabled: true-
metadata.namedefines the name of the policy. -
spec.nodeSelectordefines thenodeSelectorparameter. This parameter is optional. If you do not include thenodeSelectorparameter, the policy applies to all nodes in the cluster. This example uses thenode-role.kubernetes.io/worker: ""node selector to select all worker nodes in the cluster. -
spec.desiredState.interfacesdefines the name, type, and desired state of an interface. This example creates both Linux bridge and Ethernet networking interfaces. Settingstate: absentremoves the interface. -
spec.desiredState.interfaces.ipv4definesipv4settings for the interface. These settings are optional. If you do not usedhcp, you can either set a static IP or leave the interface without an IP address. Settingenabled: trueenablesipv4in this example.
-
Update the policy on the node and remove the interface:
$ oc apply -f <filename.yaml>Where
<filename.yaml>is the filename of the policy manifest.
23.1.7. Example policy configurations for different interfaces
Before you read the different example NodeNetworkConfigurationPolicy (NNCP) manifest configurations, consider the following factors when you apply a policy to nodes so that your cluster runs under its best performance conditions:
- If you want to apply multiple NNCP CRs to a node, you must create the NNCPs in a logical order that is based on the alphanumeric sorting of the policy names. The Kubernetes NMState Operator continuously checks for a newly created NNCP CR so that the Operator can instantly apply the CR to node.
-
When you need to apply a policy to many nodes but you only want to create a single NNCP for all the nodes, the Kubernetes NMState Operator applies the policy to each node in sequence. You can set the speed and coverage of policy application for target nodes with the
maxUnavailableparameter in the cluster’s configuration file. By setting a lower percentage value for the parameter, you can reduce the risk of a cluster-wide outage if the outage impacts the small percentage of nodes that are receiving the policy application. -
If you set the
maxUnavailableparameter to50%in two NNCP manifests, the policy configuration coverage applies to 100% of the nodes in your cluster. - When a node restarts, the Kubernetes NMState Operator cannot control the order to which it applies policies to nodes. The Kubernetes NMState Operator might apply interdependent policies in a sequence that results in a degraded network object.
- Consider specifying all related network configurations in a single policy.
23.1.7.1. Example: Ethernet interface node network configuration policy
Configure an Ethernet interface on nodes in the cluster by applying a NodeNetworkConfigurationPolicy manifest to the cluster.
The following YAML file is an example of a manifest for an Ethernet interface. It includes sample values that you must replace with your own information.
apiVersion: nmstate.io/v1
kind: NodeNetworkConfigurationPolicy
metadata:
name: eth1-policy
spec:
nodeSelector:
kubernetes.io/hostname: <node01>
desiredState:
interfaces:
- name: eth1
description: Configuring eth1 on node01
type: ethernet
state: up
ipv4:
dhcp: true
enabled: true - 1
- Name of the policy.
- 2
- Optional: If you do not include the
nodeSelectorparameter, the policy applies to all nodes in the cluster. - 3
- This example uses a
hostnamenode selector. - 4
- Name of the interface.
- 5
- Optional: Human-readable description of the interface.
- 6
- The type of interface. This example creates an Ethernet networking interface.
- 7
- The requested state for the interface after creation.
- 8
- Optional: If you do not use
dhcp, you can either set a static IP or leave the interface without an IP address. - 9
- Enables
ipv4in this example.
23.1.7.2. Example: Linux bridge interface node network configuration policy
Create a Linux bridge interface on nodes in the cluster by applying a NodeNetworkConfigurationPolicy manifest to the cluster.
The following YAML file is an example of a manifest for a Linux bridge interface. It includes samples values that you must replace with your own information.
apiVersion: nmstate.io/v1
kind: NodeNetworkConfigurationPolicy
metadata:
name: br1-eth1-policy
spec:
nodeSelector:
kubernetes.io/hostname: <node01>
desiredState:
interfaces:
- name: br1
description: Linux bridge with eth1 as a port
type: linux-bridge
state: up
ipv4:
dhcp: true
enabled: true
bridge:
options:
stp:
enabled: false
port:
- name: eth1 - 1
- Name of the policy.
- 2
- Optional: If you do not include the
nodeSelectorparameter, the policy applies to all nodes in the cluster. - 3
- This example uses a
hostnamenode selector. - 4
- Name of the interface.
- 5
- Optional: Human-readable description of the interface.
- 6
- The type of interface. This example creates a bridge.
- 7
- The requested state for the interface after creation.
- 8
- Optional: If you do not use
dhcp, you can either set a static IP or leave the interface without an IP address. - 9
- Enables
ipv4in this example. - 10
- Disables
stpin this example. - 11
- The node NIC to which the bridge attaches.
23.1.7.3. Example: VLAN interface node network configuration policy
Create a VLAN interface on nodes in the cluster by applying a NodeNetworkConfigurationPolicy manifest to the cluster.
Define all related configurations for the VLAN interface of a node in a single NodeNetworkConfigurationPolicy manifest. For example, define the VLAN interface for a node and the related routes for the VLAN interface in the same NodeNetworkConfigurationPolicy manifest.
When a node restarts, the Kubernetes NMState Operator cannot control the order in which policies are applied. Therefore, if you use separate policies for related network configurations, the Kubernetes NMState Operator might apply these policies in a sequence that results in a degraded network object.
The following YAML file is an example of a manifest for a VLAN interface. It includes samples values that you must replace with your own information.
apiVersion: nmstate.io/v1
kind: NodeNetworkConfigurationPolicy
metadata:
name: vlan-eth1-policy
spec:
nodeSelector:
kubernetes.io/hostname: <node01>
desiredState:
interfaces:
- name: eth1.102
description: VLAN using eth1
type: vlan
state: up
vlan:
base-iface: eth1
id: 102 - 1
- Name of the policy.
- 2
- Optional: If you do not include the
nodeSelectorparameter, the policy applies to all nodes in the cluster. - 3
- This example uses a
hostnamenode selector. - 4
- Name of the interface. When deploying on bare metal, only the
<interface_name>.<vlan_number>VLAN format is supported. - 5
- Optional: Human-readable description of the interface.
- 6
- The type of interface. This example creates a VLAN.
- 7
- The requested state for the interface after creation.
- 8
- The node NIC to which the VLAN is attached.
- 9
- The VLAN tag.
Additional resources
23.1.7.4. Example: Bond interface node network configuration policy
Create a bond interface on nodes in the cluster by applying a NodeNetworkConfigurationPolicy manifest to the cluster.
OpenShift Container Platform only supports the following bond modes:
-
active-backup
-
balance-xor
-
802.3ad
Other bond modes are not supported.
The balance-xor and 802.3ad bond modes require switch configuration to establish an "EtherChannel" or similar port grouping. Those two modes also require additional load-balancing configuration, depending on the source and destination of traffic being passed through the interface. The active-backup bond mode does not require any switch configuration. Other bond modes are not supported.
The following YAML file is an example of a manifest for a bond interface. It includes samples values that you must replace with your own information.
apiVersion: nmstate.io/v1
kind: NodeNetworkConfigurationPolicy
metadata:
name: bond0-eth1-eth2-policy
spec:
nodeSelector:
kubernetes.io/hostname: <node01>
desiredState:
interfaces:
- name: bond0
description: Bond with ports eth1 and eth2
type: bond
state: up
ipv4:
dhcp: true
enabled: true
link-aggregation:
mode: active-backup
options:
miimon: '140'
port:
- eth1
- eth2
mtu: 1450 - 1
- Name of the policy.
- 2
- Optional: If you do not include the
nodeSelectorparameter, the policy applies to all nodes in the cluster. - 3
- This example uses a
hostnamenode selector. - 4
- Name of the interface.
- 5
- Optional: Human-readable description of the interface.
- 6
- The type of interface. This example creates a bond.
- 7
- The requested state for the interface after creation.
- 8
- Optional: If you do not use
dhcp, you can either set a static IP or leave the interface without an IP address. - 9
- Enables
ipv4in this example. - 10
- The driver mode for the bond. This example uses
active backup. - 11
- Optional: This example uses miimon to inspect the bond link every 140ms.
- 12
- The subordinate node NICs in the bond.
- 13
- Optional: The maximum transmission unit (MTU) for the bond. If not specified, this value is set to
1500by default.
23.1.7.5. Example: Source load balancing (SLB) on a secondary bond interface
You can run the Open vSwitch (OVS) balance-slb mode on a secondary bond interface so to isolate traffic from the primary network. This configuration for managing traffic provides your cluster with high availability and traffic segmentation capabilities.
The following YAML file shows an example of a manifest for a secondary bond interface. The file includes samples values that you must replace with your own information.
apiVersion: nmstate.io/v1
kind: NodeNetworkConfigurationPolicy
metadata:
name: bond1-policy
spec:
nodeSelector:
kubernetes.io/hostname: <node01>
desiredState:
interfaces:
- name: br1
type: ovs-interface
state: up
copy-mac-from: enp2s0
ipv4:
enabled: true
dhcp: true
- name: br1
type: ovs-bridge
state: up
ipv4:
enabled: false
dhcp: false
bridge:
port:
- name: br1
- name: bond0
link-aggregation:
mode: balance-slb
port:
- name: enp2s0
- name: enp3s0
- name: enp2s0
type: ethernet
state: up
ipv4:
enabled: false
ipv6:
enabled: false
- name: enp3s0
type: ethernet
state: up
ipv4:
enabled: false
ipv6:
enabled: false
# ...- 1
- Name of the policy.
- 2
- Specifies the virtual interface managed by Open vSwitch (OVS).
- 3
- Ensures the virtual interface inherits the MAC address of the physical network interface controller (NIC),
enp2s0. - 4
- The name of the OVS bridge. Note that the
br0interface name is reserved so you cannot use that name with NMstate configurations. - 5
- Sets the bonding mode to SLB, so that distribution of traffic happens based on the source MAC address and the VLAN.
- 6
- Lists physical interfaces that get included in the secondary bond interface.
23.1.7.6. Example: Multiple interfaces in the same node network configuration policy
You can create multiple interfaces in the same node network configuration policy. These interfaces can reference each other, allowing you to build and deploy a network configuration by using a single policy manifest.
If multiple interfaces use the same default configuration, a single Network Manager connection profile activates on multiple interfaces simultaneously and this causes connections to have the same universally unique identifier (UUID). To avoid this issue, ensure that each interface has a specific configuration that is different from the default configuration.
The following example YAML file creates a bond that is named bond10 across two NICs and VLAN that is named bond10.103 that connects to the bond.
apiVersion: nmstate.io/v1
kind: NodeNetworkConfigurationPolicy
metadata:
name: bond-vlan
spec:
nodeSelector:
kubernetes.io/hostname: <node01>
desiredState:
interfaces:
- name: bond10
description: Bonding eth2 and eth3
type: bond
state: up
link-aggregation:
mode: balance-xor
options:
miimon: '140'
port:
- eth2
- eth3
- name: bond10.103
description: vlan using bond10
type: vlan
state: up
vlan:
base-iface: bond10
id: 103
ipv4:
dhcp: true
enabled: true - 1
- Name of the policy.
- 2
- Optional: If you do not include the
nodeSelectorparameter, the policy applies to all nodes in the cluster. - 3
- This example uses
hostnamenode selector. - 4 11
- Name of the interface.
- 5 12
- Optional: Human-readable description of the interface.
- 6 13
- The type of interface.
- 7 14
- The requested state for the interface after creation.
- 8
- The driver mode for the bond.
- 9
- Optional: This example uses miimon to inspect the bond link every 140ms.
- 10
- The subordinate node NICs in the bond.
- 15
- The node NIC to which the VLAN is attached.
- 16
- The VLAN tag.
- 17
- Optional: If you do not use dhcp, you can either set a static IP or leave the interface without an IP address.
- 18
- Enables ipv4 in this example.
23.1.7.7. Example: Node network configuration policy for virtual functions (Technology Preview)
Update host network settings for Single Root I/O Virtualization (SR-IOV) network virtual functions (VF) in an existing cluster by applying a NodeNetworkConfigurationPolicy manifest.
Updating host network settings for SR-IOV network VFs is a Technology Preview feature only. Technology Preview features are not supported with Red Hat production service level agreements (SLAs) and might not be functionally complete. Red Hat does not recommend using them in production. These features provide early access to upcoming product features, enabling customers to test functionality and provide feedback during the development process.
For more information about the support scope of Red Hat Technology Preview features, see Technology Preview Features Support Scope.
You can apply a NodeNetworkConfigurationPolicy manifest to an existing cluster to complete the following tasks:
- Configure QoS host network settings for VFs to optimize performance.
- Add, remove, or update VFs for a network interface.
- Manage VF bonding configurations.
To update host network settings for SR-IOV VFs by using NMState on physical functions that are also managed through the SR-IOV Network Operator, you must set the externallyManaged parameter in the relevant SriovNetworkNodePolicy resource to true. For more information, see the Additional resources section.
The following YAML file is an example of a manifest that defines QoS policies for a VF. This file includes samples values that you must replace with your own information.
apiVersion: nmstate.io/v1
kind: NodeNetworkConfigurationPolicy
metadata:
name: qos
spec:
nodeSelector:
node-role.kubernetes.io/worker: ""
desiredState:
interfaces:
- name: ens1f0
description: Change QOS on VF0
type: ethernet
state: up
ethernet:
sr-iov:
total-vfs: 3
vfs:
- id: 0
max-tx-rate: 200 - 1
- Name of the policy.
- 2
- Optional: If you do not include the
nodeSelectorparameter, the policy applies to all nodes in the cluster. - 3
- This example applies to all nodes with the
workerrole. - 4
- Name of the physical function (PF) network interface.
- 5
- Optional: Human-readable description of the interface.
- 6
- The type of interface.
- 7
- The requested state for the interface after configuration.
- 8
- The total number of VFs.
- 9
- Identifies the VF with an ID of
0. - 10
- Sets a maximum transmission rate, in Mbps, for the VF. This sample value sets a rate of 200 Mbps.
The following YAML file is an example of a manifest that creates a VLAN interface on top of a VF and adds it to a bonded network interface. It includes samples values that you must replace with your own information.
apiVersion: nmstate.io/v1
kind: NodeNetworkConfigurationPolicy
metadata:
name: addvf
spec:
nodeSelector:
node-role.kubernetes.io/worker: ""
maxUnavailable: 3
desiredState:
interfaces:
- name: ens1f0v1
type: ethernet
state: up
- name: ens1f0v1.477
type: vlan
state: up
vlan:
base-iface: ens1f0v1
id: 477
- name: bond0
description: Add vf
type: bond
state: up
link-aggregation:
mode: active-backup
options:
primary: ens1f1v0.477
port:
- ens1f1v0.477
- ens1f0v0.477
- ens1f0v1.477 - 1
- Name of the policy.
- 2
- Optional: If you do not include the
nodeSelectorparameter, the policy applies to all nodes in the cluster. - 3
- This example applies to all nodes with the
workerrole. - 4
- Name of the VF network interface.
- 5
- Name of the VLAN network interface.
- 6
- The VF network interface to which the VLAN interface is attached.
- 7
- Name of the bonding network interface.
- 8
- Optional: Human-readable description of the interface.
- 9
- The type of interface.
- 10
- The requested state for the interface after configuration.
- 11
- The bonding policy for the bond.
- 12
- The primary attached bonding port.
- 13
- The ports for the bonded network interface.
- 14
- In this example, this VLAN network interface is added as an additional interface to the bonded network interface.
23.1.7.8. Example: Network interface with a VRF instance node network configuration policy
Associate a Virtual Routing and Forwarding (VRF) instance with a network interface by applying a NodeNetworkConfigurationPolicy custom resource (CR).
Associating a VRF instance with a network interface is a Technology Preview feature only. Technology Preview features are not supported with Red Hat production service level agreements (SLAs) and might not be functionally complete. Red Hat does not recommend using them in production. These features provide early access to upcoming product features, enabling customers to test functionality and provide feedback during the development process.
For more information about the support scope of Red Hat Technology Preview features, see Technology Preview Features Support Scope.
By associating a VRF instance with a network interface, you can support traffic isolation, independent routing decisions, and the logical separation of network resources.
When configuring Virtual Route Forwarding (VRF), you must change the VRF value to a table ID lower than 1000 because a value higher than 1000 is reserved for OpenShift Container Platform.
In a bare-metal environment, you can announce load balancer services through interfaces belonging to a VRF instance by using MetalLB. For more information, see the Additional resources section.
The following YAML file is an example of associating a VRF instance to a network interface. It includes samples values that you must replace with your own information.
apiVersion: nmstate.io/v1
kind: NodeNetworkConfigurationPolicy
metadata:
name: vrfpolicy
spec:
nodeSelector:
vrf: "true"
maxUnavailable: 3
desiredState:
interfaces:
- name: ens4vrf
type: vrf
state: up
vrf:
port:
- ens4
route-table-id: 2 Additional resources
23.1.8. Creating an IP over InfiniBand interface on nodes
On the OpenShift Container Platform web console, you can install a Red Hat certified third-party Operator, such as the NVIDIA Network Operator, that supports IP over InfiniBand (IPoIB) mode. Typically, you would use the third-party Operator with other vendor infrastructure to manage resources in an OpenShift Container Platform cluster. To create an IPoIB interface on nodes in your cluster, you must define an InfiniBand (IPoIB) interface in a NodeNetworkConfigurationPolicy (NNCP) manifest file.
If you need to attach IPoIB to a bond interface, only the active-backup mode supports this configuration.
The OpenShift Container Platform documentation describes defining only the IPoIB interface configuration in a NodeNetworkConfigurationPolicy (NNCP) manifest file. You must refer to the NVIDIA and other third-party vendor documentation for the majority of the configuring steps. Red Hat support does not extend to anything external to the NNCP configuration.
For more information about the NVIDIA Operator, see Getting Started with Red Hat OpenShift (NVIDIA Docs Hub).
Prerequisites
- You installed a Red Hat certified third-party Operator that supports an IPoIB interface.
Procedure
Create or edit a
NodeNetworkConfigurationPolicy(NNCP) manifest file, and then specify an IPoIB interface in the file.apiVersion: nmstate.io/v1 kind: NodeNetworkConfigurationPolicy metadata: name: worker-0-ipoib spec: # ... interfaces: - description: "" infiniband: mode: datagram pkey: "0xffff" ipv4: address: - ip: 100.125.3.4 prefix-length: 16 dhcp: false enabled: true ipv6: enabled: false name: ibp27s0 state: up identifier: mac-address mac-address: 20:00:55:04:01:FE:80:00:00:00:00:00:00:00:02:C9:02:00:23:13:92 type: infiniband # ...where:
<mode>-
datagramis the default mode for an IPoIB interface. This mode provides improved CPU performance and low-latency capabilitities for pod-to-pod communication.connectedmode is a supported mode but consider only using this mode when you need to adjust the maximum transmission unit (MTU) value to improve node connectivity with surrounding network devices. <pkey>-
Supports a string or an integer value. The parameter defines the protection key, or P-key, for the interface for the purposes of authentication and encrypted communications with a third-party vendor, such as NVIDIA. Values
Noneand0xffffindicate the protection key for the base interface in an InfiniBand system. <identifier>-
Supported values include
name, the default value, andmac-address. Thenamevalue applies a configuration to an interface that holds a specified interface name. <mac-address>- Holds the MAC address of an interface. For an IP-over-InfiniBand (IPoIB) interface, the address is a 20-byte string.
<type>-
Sets the type of interface to
infiniband.
Apply the NNCP configuration to each node in your cluster by running the following command. The Kubernetes NMState Operator can then create an IPoIB interface on each node.
$ oc apply -f <nncp_file_name>where:
<nncp_file_name>-
Replace
<nncp_file_name>with the name of your NNCP file.
23.1.9. Capturing the static IP of a NIC attached to a bridge
The following example configuration snippets show how to capture the static IP of a NIC when it is attached to a bridge.
Capturing the static IP of a NIC is a Technology Preview feature only. Technology Preview features are not supported with Red Hat production service level agreements (SLAs) and might not be functionally complete. Red Hat does not recommend using them in production. These features provide early access to upcoming product features, enabling customers to test functionality and provide feedback during the development process.
For more information about the support scope of Red Hat Technology Preview features, see Technology Preview Features Support Scope.
Create a Linux bridge interface on nodes in the cluster and transfer the static IP configuration of the NIC to the bridge by applying a single NodeNetworkConfigurationPolicy manifest to the cluster.
The following YAML file is an example of a manifest for a Linux bridge interface. It includes sample values that you must replace with your own information.
apiVersion: nmstate.io/v1
kind: NodeNetworkConfigurationPolicy
metadata:
name: br1-eth1-copy-ipv4-policy
spec:
nodeSelector:
node-role.kubernetes.io/worker: ""
capture:
eth1-nic: interfaces.name=="eth1"
eth1-routes: routes.running.next-hop-interface=="eth1"
br1-routes: capture.eth1-routes | routes.running.next-hop-interface := "br1"
desiredState:
interfaces:
- name: br1
description: Linux bridge with eth1 as a port
type: linux-bridge
state: up
ipv4: "{{ capture.eth1-nic.interfaces.0.ipv4 }}"
bridge:
options:
stp:
enabled: false
port:
- name: eth1
routes:
config: "{{ capture.br1-routes.routes.running }}"- 1
- The name of the policy.
- 2
- Optional: If you do not include the
nodeSelectorparameter, the policy applies to all nodes in the cluster. This example uses thenode-role.kubernetes.io/worker: ""node selector to select all worker nodes in the cluster. - 3
- The reference to the node NIC to which the bridge attaches.
- 4
- The type of interface. This example creates a bridge.
- 5
- The IP address of the bridge interface. This value matches the IP address of the NIC which is referenced by the
spec.capture.eth1-nicentry. - 6
- The node NIC to which the bridge attaches.
Additional resources
23.1.10. Examples: IP management
The following example configuration snippets show different methods of IP management.
These examples use the ethernet interface type to simplify the example while showing the related context in the policy configuration. These IP management examples can be used with the other interface types.
23.1.10.1. Static
The following snippet statically configures an IP address on the Ethernet interface:
# ...
interfaces:
- name: eth1
description: static IP on eth1
type: ethernet
state: up
ipv4:
dhcp: false
address:
- ip: 192.168.122.250
prefix-length: 24
enabled: true
# ...- 1
- Replace this value with the static IP address for the interface.
23.1.10.2. No IP address
The following snippet ensures that the interface has no IP address:
# ...
interfaces:
- name: eth1
description: No IP on eth1
type: ethernet
state: up
ipv4:
enabled: false
# ...
Always set the state parameter to up when you set both the ipv4.enabled and the ipv6.enabled parameter to false to disable an interface. If you set state: down with this configuration, the interface receives a DHCP IP address because of automatic DHCP assignment.
23.1.10.3. Dynamic host configuration
The following snippet configures an Ethernet interface that uses a dynamic IP address, gateway address, and DNS:
# ...
interfaces:
- name: eth1
description: DHCP on eth1
type: ethernet
state: up
ipv4:
dhcp: true
enabled: true
# ...The following snippet configures an Ethernet interface that uses a dynamic IP address but does not use a dynamic gateway address or DNS:
# ...
interfaces:
- name: eth1
description: DHCP without gateway or DNS on eth1
type: ethernet
state: up
ipv4:
dhcp: true
auto-gateway: false
auto-dns: false
enabled: true
# ...23.1.10.4. Media Access Control (MAC) address
You can use a MAC address to identify a network interface instead of using the name of the network interface. A network interface name can change for various reasons, such as an operating system configuration change. However, every network interface has a unique MAC address that does not change. This means that using a MAC address is a more permanent way to identify a specific network interface.
Supported values for the identifier parameter include the default name value and the value mac-address. The name value applies a configuration to an interface that holds a specified interface name.
Using a mac-address value for the identifier parameter indicates that a MAC address is the identifier for the network interface. If you set the identifier value to mac-address, you must enter a specific MAC address in the following mac-address parameter field.
You can still specify a value for the name parameter, but setting the identifier: mac-address value means that a MAC address is used as the primary identifier for a network interface. If you specify an incorrect MAC address, nmstate reports an invalid argument error.
The following snippet specifies a MAC address as the primary identifier for an Ethernet device, named eth1, with a MAC address of 8A:8C:92:1A:F6:98:
# ...
interfaces:
- name: eth1
profile-name: wan0
type: ethernet
state: up
identifier: mac-address
mac-address: 8A:8C:92:1A:F6:98
# ...23.1.10.5. DNS
By default, the nmstate API stores DNS values globally as against storing them in a network interface. For certain situations, you must configure a network interface to store DNS values.
Setting a DNS configuration is comparable to modifying the /etc/resolv.conf file.
To define a DNS configuration for a network interface, you must initially specify the dns-resolver section in the network interface’s YAML configuration file. To apply an NNCP configuration to your network interface, you need to run the oc apply -f <nncp_file_name> command.
The following example shows a default situation that stores DNS values globally:
Configure a static DNS without a network interface. Note that when updating the
/etc/resolv.conffile on a host node, you do not need to specify an interface, IPv4 or IPv6, in theNodeNetworkConfigurationPolicy(NNCP) manifest.Example of a DNS configuration for a network interface that globally stores DNS values
apiVersion: nmstate.io/v1 kind: NodeNetworkConfigurationPolicy metadata: name: worker-0-dns-testing spec: nodeSelector: kubernetes.io/hostname: <target_node> desiredState: dns-resolver: config: server: - 2001:db8:f::1 - 192.0.2.251 search: - example.com - example.org # ...ImportantYou can specify DNS options under the
dns-resolver.configsection of your NNCP file as demonstrated in the following example:# ... desiredState: dns-resolver: config: options: - timeout:2 - attempts:3 # ...If you want to remove the DNS options from your network interface, apply the following configuration to your NNCP and then run the
oc apply -f <nncp_file_name>command:# ... dns-resolver: config: {} interfaces: [] # ...
The following examples show situations that require configuring a network interface to store DNS values:
If you want to rank a static DNS name server over a dynamic DNS name server, define the interface that runs either the Dynamic Host Configuration Protocol (DHCP) or the IPv6 Autoconfiguration (
autoconf) mechanism in the network interface YAML configuration file.Example configuration that adds
192.0.2.1to DNS name servers retrieved from the DHCPv4 network protocol# ... dns-resolver: config: server: - 192.0.2.1 interfaces: - name: eth1 type: ethernet state: up ipv4: enabled: true dhcp: true auto-dns: true # ...If you need to configure a network interface to store DNS values instead of adopting the default method, which uses the
nmstateAPI to store DNS values globally, you can set static DNS values and static IP addresses in the network interface YAML file.ImportantStoring DNS values at the network interface level might cause name resolution issues after you attach the interface to network components, such as an Open vSwitch (OVS) bridge, a Linux bridge, or a bond.
Example configuration that stores DNS values at the interface level
# ... dns-resolver: config: server: - 2001:db8:1::d1 - 2001:db8:1::d2 - 192.0.2.1 search: - example.com - example.org interfaces: - name: eth1 type: ethernet state: up ipv4: address: - ip: 192.0.2.251 prefix-length: 24 dhcp: false enabled: true ipv6: address: - ip: 2001:db8:1::1 prefix-length: 64 dhcp: false enabled: true autoconf: false # ...If you want to set static DNS search domains and static DNS name servers for your network interface, define the static interface that runs either the Dynamic Host Configuration Protocol (DHCP) or the IPv6 Autoconfiguration (
autoconf) mechanism in the network interface YAML configuration file.ImportantSpecifying the following
dns-resolverconfigurations in the network interface YAML file might cause a race condition at reboot that prevents theNodeNetworkConfigurationPolicy(NNCP) from applying to pods that run in your cluster:- Setting static DNS search domains and dynamic DNS name servers for your network interface.
-
Specifying domain suffixes for the
searchparameter and not setting IP addresses for theserverparameter.
Example configuration that sets
example.comandexample.orgstatic DNS search domains along with static DNS name server settings# ... dns-resolver: config: server: - 2001:db8:f::1 - 192.0.2.251 search: - example.com - example.org interfaces: - name: eth1 type: ethernet state: up ipv4: enabled: true dhcp: true auto-dns: true ipv6: enabled: true dhcp: true autoconf: true auto-dns: true # ...
23.1.11. Routes and route rules
After you configure an IP address for a network interface, you can configure routes and route rules in the NMState configuration for cluster nodes.
You cannot use the OVN-Kubernetes br-ex bridge as the next hop interface when configuring a static route unless you manually configured a customized br-ex bridge.
For more information, see "Creating a manifest object that includes a customized br-ex bridge" in the Deploying installer-provisioned clusters on bare metal document or the Installing a user-provisioned cluster on bare metal document.
The routes parameter defines static routes and these routes determine the traffic that leaves the network interfaces and the destination network for the traffic. Supported values include running and config.
After you apply an NMState configuration to cluster nodes and you want to change existing routes, you must specify the old route with the state: absent parameter and the new route with the state: present parameter. The NMState Operator can then delete the old route and apply the new route to cluster nodes.
Setting the state parameter to ignore means that the Operator ignores certain routes.
The route-rules parameter implements a policy-based routing capability for cluster nodes. This capability allows traffic that originates from a different source IP address to be segregated and routed through different gateways and network paths.
The following YAML configuration shows a static route and a static IP confiuration on interface eth1:
dns-resolver:
config:
# ...
interfaces:
- name: eth1
description: Static routing on eth1
type: ethernet
state: up
ipv4:
dhcp: false
enabled: true
address:
- ip: 192.0.2.251
prefix-length: 24
route-rules:
config:
- ip-from: 198.51.100.0/24
priority: 1000
route-table: 200
routes:
config:
- destination: 198.51.100.0/24
next-hop-interface: eth1
next-hop-address: 192.0.2.1
metric: 150
table-id: 200
# ...-
config.ip-from: Applies a rule to any network packet that originates from the specified IP address. -
config.priority: Sets the priority order for the rule. -
config.route-table: Specifies the routing table that the Operator uses to check that network traffic matches theip-fromcondition. -
address.ip: The static IP address for the Ethernet interface. -
config.next-hop-address: The next hop address for the node traffic. This must be in the same subnet as the IP address set for the Ethernet interface.
23.2. Troubleshooting node network configuration
If the node network configuration encounters an issue, the policy is automatically rolled back and the enactments report failure. This includes issues such as:
- The configuration fails to be applied on the host.
- The host loses connection to the default gateway.
- The host loses connection to the API server.
23.2.1. Troubleshooting an incorrect node network configuration policy configuration
You can apply changes to the node network configuration across your entire cluster by applying a node network configuration policy.
If you applied an incorrect configuration, you can use the following example to troubleshoot and correct the failed node network policy. The example attempts to apply a Linux bridge policy to a cluster that has three control plane nodes and three compute nodes. The policy is not applied because the policy references the wrong interface.
To find an error, you need to investigate the available NMState resources. You can then update the policy with the correct configuration.
Prerequisites
-
You ensured that an
ens01interface does not exist on your Linux system.
Procedure
Create a policy on your cluster. The following example creates a simple bridge,
br1that hasens01as its member:apiVersion: nmstate.io/v1 kind: NodeNetworkConfigurationPolicy metadata: name: ens01-bridge-testfail spec: desiredState: interfaces: - name: br1 description: Linux bridge with the wrong port type: linux-bridge state: up ipv4: dhcp: true enabled: true bridge: options: stp: enabled: false port: - name: ens01 # ...Apply the policy to your network interface:
$ oc apply -f ens01-bridge-testfail.yamlExample output
nodenetworkconfigurationpolicy.nmstate.io/ens01-bridge-testfail createdVerify the status of the policy by running the following command:
$ oc get nncpThe output shows that the policy failed:
Example output
NAME STATUS ens01-bridge-testfail FailedToConfigureThe policy status alone does not indicate if it failed on all nodes or a subset of nodes.
List the node network configuration enactments to see if the policy was successful on any of the nodes. If the policy failed for only a subset of nodes, the output suggests that the problem is with a specific node configuration. If the policy failed on all nodes, the output suggests that the problem is with the policy.
$ oc get nnceThe output shows that the policy failed on all nodes:
Example output
NAME STATUS control-plane-1.ens01-bridge-testfail FailedToConfigure control-plane-2.ens01-bridge-testfail FailedToConfigure control-plane-3.ens01-bridge-testfail FailedToConfigure compute-1.ens01-bridge-testfail FailedToConfigure compute-2.ens01-bridge-testfail FailedToConfigure compute-3.ens01-bridge-testfail FailedToConfigureView one of the failed enactments. The following command uses the output tool
jsonpathto filter the output:$ oc get nnce compute-1.ens01-bridge-testfail -o jsonpath='{.status.conditions[?(@.type=="Failing")].message}'Example output
[2024-10-10T08:40:46Z INFO nmstatectl] Nmstate version: 2.2.37 NmstateError: InvalidArgument: Controller interface br1 is holding unknown port ens01The previous example shows the output from an
InvalidArgumenterror that indicates that theens01is an unknown port. For this example, you might need to change the port configuration in the policy configuration file.To ensure that the policy is configured properly, view the network configuration for one or all of the nodes by requesting the
NodeNetworkStateobject. The following command returns the network configuration for thecontrol-plane-1node:$ oc get nns control-plane-1 -o yamlThe output shows that the interface name on the nodes is
ens1but the failed policy incorrectly usesens01:Example output
- ipv4: # ... name: ens1 state: up type: ethernetCorrect the error by editing the existing policy:
$ oc edit nncp ens01-bridge-testfail# ... port: - name: ens1Save the policy to apply the correction.
Check the status of the policy to ensure it updated successfully:
$ oc get nncpExample output
NAME STATUS ens01-bridge-testfail SuccessfullyConfiguredThe updated policy is successfully configured on all nodes in the cluster.
23.2.2. Troubleshooting DNS connectivity issues in a disconnected environment
If you experience health check probe issues when configuring nmstate in a disconnected environment, you can configure the DNS server to resolve the custom domain name instead of the default root-servers.net domain.
Ensure that the DNS server includes a name server (NS) entry for the root-servers.net zone. The DNS server does not need to forward a query to an upstream resolver, but the server must return a correct answer for the NS query.
23.2.2.1. Configuring the bind9 DNS named server
For a cluster configured to query a bind9 DNS server, you can add the root-servers.net zone to a configuration file that contains at least one NS record. For example you can use the /var/named/named.localhost as a zone file that already matches this criteria.
Procedure
Add the
root-servers.netzone at the end of the/etc/named.confconfiguration file by running the following command:$ cat >> /etc/named.conf <<EOF zone "root-servers.net" IN { type master; file "named.localhost"; }; EOFRestart the
namedservice by running the following command:$ systemctl restart namedConfirm that the
root-servers.netzone is present by running the following command:$ journalctl -u named|grep root-servers.netExample output
Jul 03 15:16:26 rhel-8-10 bash[xxxx]: zone root-servers.net/IN: loaded serial 0 Jul 03 15:16:26 rhel-8-10 named[xxxx]: zone root-servers.net/IN: loaded serial 0Verify that the DNS server can resolve the NS record for the
root-servers.netdomain by running the following command:$ host -t NS root-servers.net. 127.0.0.1Example output
Using domain server: Name: 127.0.0.1 Address: 127.0.0.53 Aliases: root-servers.net name server root-servers.net.
23.2.2.2. Configuring the dnsmasq DNS server
If you are using dnsmasq as the DNS server, you can delegate resolution of the root-servers.net domain to another DNS server, for example, by creating a new configuration file that resolves root-servers.net using a DNS server that you specify.
Procedure
Create a configuration file that delegates the domain
root-servers.netto another DNS server by running the following command:$ echo 'server=/root-servers.net/<DNS_server_IP>'> /etc/dnsmasq.d/delegate-root-servers.net.confRestart the
dnsmasqservice by running the following command:$ systemctl restart dnsmasqConfirm that the
root-servers.netdomain is delegated to another DNS server by running the following command:$ journalctl -u dnsmasq|grep root-servers.netExample output
Jul 03 15:31:25 rhel-8-10 dnsmasq[1342]: using nameserver 192.168.1.1#53 for domain root-servers.netVerify that the DNS server can resolve the NS record for the
root-servers.netdomain by running the following command:$ host -t NS root-servers.net. 127.0.0.1Example output
Using domain server: Name: 127.0.0.1 Address: 127.0.0.1#53 Aliases: root-servers.net name server root-servers.net.
Chapter 24. Configuring the cluster-wide proxy
To enable your OpenShift Container Platform cluster to use an HTTP or HTTPS proxy when direct internet access is denied, you can configure cluster-wide proxy settings by modifying the Proxy object for existing clusters or by configuring proxy settings in the install-config.yaml file for new clusters.
After you enable a cluster-wide egress proxy for your cluster on a supported platform, Red Hat Enterprise Linux CoreOS (RHCOS) populates the status.noProxy parameter with the values of the networking.machineNetwork[].cidr, networking.clusterNetwork[].cidr, and networking.serviceNetwork[] fields from your install-config.yaml file that exists on the supported platform.
As a postinstallation task, you can change the networking.clusterNetwork[].cidr value, but not the networking.machineNetwork[].cidr and the networking.serviceNetwork[] values. For more information, see "Configuring the cluster network range".
For installations on Amazon Web Services (AWS), Google Cloud, Microsoft Azure, and Red Hat OpenStack Platform (RHOSP), the status.noProxy parameter is also populated with the instance metadata endpoint, 169.254.169.254.
Example of values added to the status: segment of a Proxy object by RHCOS
apiVersion: config.openshift.io/v1
kind: Proxy
metadata:
name: cluster
# ...
networking:
clusterNetwork:
- cidr: <ip_address_from_cidr>
hostPrefix: 23
network type: OVNKubernetes
machineNetwork:
- cidr: <ip_address_from_cidr>
serviceNetwork:
- 172.30.0.0/16
# ...
status:
noProxy:
- localhost
- .cluster.local
- .svc
- 127.0.0.1
- <api_server_internal_url>
# ...where:
<ip_address_from_cidr>-
Specifies IP address blocks from which pod IP addresses are allocated. The default value is
10.128.0.0/14with a host prefix of/23. <ip_address_from_cidr>-
Specifies IP address blocks for machines. The default value is
10.0.0.0/16. <ip_address_from_cidr>-
Specifies IP address block for services. The default value is
172.30.0.0/16. <api_server_internal_url>-
You can find the URL of the internal API server by running the
oc get infrastructures.config.openshift.io cluster -o jsonpath='{.status.etcdDiscoveryDomain}'command.
If your installation type does not include setting the networking.machineNetwork[].cidr field, you must include the machine IP addresses manually in the .status.noProxy field to make sure that the traffic between nodes can bypass the proxy.
24.1. Prerequisites
Review the sites that your cluster requires access to and determine whether any of them must bypass the proxy. By default, all cluster system egress traffic is proxied, including calls to the cloud provider API for the cloud that hosts your cluster. The system-wide proxy affects system components only, not user workloads. If necessary, add sites to the spec.noProxy parameter of the Proxy object to bypass the proxy.
24.2. Enabling the cluster-wide proxy
To enable the cluster-wide egress proxy for your OpenShift Container Platform cluster, you can modify the Proxy object to configure HTTP and HTTPS proxy settings and specify domains that bypass the proxy.
When a cluster is installed or upgraded without the proxy configured, a Proxy object is still generated but it has a nil spec. For example:
apiVersion: config.openshift.io/v1
kind: Proxy
metadata:
name: cluster
spec:
trustedCA:
name: ""
status:
Only the Proxy object named cluster is supported, and no additional proxies can be created.
A cluster administrator can configure the proxy for OpenShift Container Platform by modifying the cluster Proxy object.
After you enable the cluster-wide proxy capability for your cluster and you save the Proxy object file, the Machine Config Operator (MCO) reboots all nodes in your cluster so that each node can access connections that exist outside of the cluster. You do not need to manually reboot these nodes.
Prerequisites
- You have cluster administrator permissions.
-
You installed the OpenShift Container Platform
ocCLI tool.
Procedure
Create a config map that contains any additional CA certificates required for proxying HTTPS connections.
NoteYou can skip this step if the identity certificate of the proxy is signed by an authority from the Red Hat Enterprise Linux CoreOS (RHCOS) trust bundle.
Create a file called
user-ca-bundle.yaml, and provide the values of your PEM-encoded certificates:apiVersion: v1 data: ca-bundle.crt: |1 <MY_PEM_ENCODED_CERTS>2 kind: ConfigMap metadata: name: user-ca-bundle3 namespace: openshift-config4 where:
data.ca-bundle.crt-
Specifies the data key that must be named
ca-bundle.crt. <MY_PEM_ENCODED_CERTS>- Specifies one or more PEM-encoded X.509 certificates used to sign the proxy’s identity certificate.
user-ca-bundle-
Specifies the config map name that is referenced from the
Proxyobject. openshift-config- Specifies the namespace that the config map must exist in.
Create the config map from the
user-ca-bundle.yamlfile by entering the following command:$ oc create -f user-ca-bundle.yaml
Use the
oc editcommand to modify theProxyobject:$ oc edit proxy/clusterConfigure the necessary fields for the proxy:
apiVersion: config.openshift.io/v1 kind: Proxy metadata: name: cluster spec: httpProxy: http://<username>:<pswd>@<ip>:<port>1 httpsProxy: https://<username>:<pswd>@<ip>:<port>2 noProxy: example.com3 readinessEndpoints: - http://www.google.com4 - https://www.google.com trustedCA: name: user-ca-bundle5 where:
httpProxy-
Specifies the proxy URL to use for creating HTTP connections outside the cluster. The URL scheme must be
http. httpsProxy-
Specifies the proxy URL to use for creating HTTPS connections outside the cluster. The URL scheme must be either
httporhttps. Specify a URL for the proxy that supports the URL scheme. For example, most proxies report an error if they are configured to usehttpsbut they only supporthttp. This failure message may not propagate to the logs and can appear to be a network connection failure instead. If using a proxy that listens forhttpsconnections from the cluster, you might need to configure the cluster to accept the CAs and certificates that the proxy uses. noProxySpecifies a comma-separated list of destination domain names, domains, IP addresses (or other network CIDRs), and port numbers to exclude proxying. Note that Port numbers are only supported when configuring IPv6 addresses. Port numbers are not supported when configuring IPv4 addresses.
Preface a domain with
.to match subdomains only. For example,.y.commatchesx.y.com, but noty.com. Use*to bypass proxy for all destinations.If your
noproxyfield needs to include a domain address, you must explicitly specify that FQDN, or prefix-matched subdomain, in thenoproxyfield. You cannot use the IP address or CIDR range that encapsulates the domain. This is because the cluster does not wait for DNS to return the IP address before assigning the route connection, and checks explicitly against the request being made. For example, if you have a CIDR block value, such as10.0.0.0/24, for thenoproxyfield and the field attempts to accesshttps://10.0.0.11, the addresses successfully match. However, attempting to accesshttps://exampleserver.externaldomain.com, whose A record entry is10.0.0.11, fails. An additional value of.externaldomain.comfor yournoproxyfield is necessary.If you scale up compute nodes that are not included in the network defined by the
networking.machineNetwork[].cidrfield from the installation configuration, you must add them to this list to prevent connection issues.This field is ignored if neither the
httpProxyorhttpsProxyfields are set.readinessEndpoints-
Specifies one or more URLs external to the cluster to use to perform a readiness check before writing the
httpProxyandhttpsProxyvalues to status. trustedCA-
Specifies a reference to the config map in the
openshift-confignamespace that contains additional CA certificates required for proxying HTTPS connections. Note that the config map must already exist before referencing it here. This field is required unless the proxy’s identity certificate is signed by an authority from the RHCOS trust bundle.
- Save the file to apply the changes.
24.3. Removing the cluster-wide proxy
The cluster Proxy object cannot be deleted. To remove the cluster-wide proxy configuration from your OpenShift Container Platform cluster, you can remove all spec fields from the Proxy object by using the oc edit command.
Prerequisites
- Cluster administrator permissions
-
OpenShift Container Platform
ocCLI tool installed
Procedure
Use the
oc editcommand to modify the proxy:$ oc edit proxy/clusterRemove all
specfields from the Proxy object. For example:apiVersion: config.openshift.io/v1 kind: Proxy metadata: name: cluster spec: {}- Save the file to apply the changes.
24.4. Verifying the cluster-wide proxy configuration
To verify that your cluster-wide proxy configuration is working correctly in OpenShift Container Platform, you can check the Proxy object status, review Machine Config Operator logs, and confirm that system components are routing external requests through the proxy.
Prerequisites
- You have cluster administrator permissions.
-
You have the OpenShift Container Platform
ocCLI tool installed.
Procedure
Check the proxy configuration status using the
occommand:$ oc get proxy/cluster -o yaml-
Verify the proxy fields in the output to ensure they match your configuration. Specifically, check the
spec.httpProxy,spec.httpsProxy,spec.noProxy, andspec.trustedCAfields. Inspect the status of the
Proxyobject:$ oc get proxy/cluster -o jsonpath='{.status}'Example output
{ status: httpProxy: http://user:xxx@xxxx:3128 httpsProxy: http://user:xxx@xxxx:3128 noProxy: .cluster.local,.svc,10.0.0.0/16,10.128.0.0/14,127.0.0.1,169.254.169.254,172.30.0.0/16,localhost,test.no-proxy.com }Check the logs of the Machine Config Operator (MCO) to ensure that the configuration changes were applied successfully:
$ oc logs -n openshift-machine-config-operator $(oc get pods -n openshift-machine-config-operator -l k8s-app=machine-config-operator -o name)- Look for messages that indicate the proxy settings were applied and the nodes were rebooted if necessary.
Verify that system components are using the proxy by checking the logs of a component that makes external requests, such as the Cluster Version Operator (CVO):
$ oc logs -n openshift-cluster-version $(oc get pods -n openshift-cluster-version -l k8s-app=machine-config-operator -o name)- Look for log entries that show that external requests have been routed through the proxy.
Chapter 25. Configuring a custom PKI
To ensure secure communication between internal components in your OpenShift Container Platform cluster, you can add your organization’s custom Certificate Authority (CA) certificates to the cluster-wide truststore.
You can leverage the Proxy API to add cluster-wide trusted CA certificates. You must do this either during installation or at runtime.
During installation, configure the cluster-wide proxy. You must define your privately signed CA certificates in the
install-config.yamlfile’sadditionalTrustBundlesetting.The installation program generates a ConfigMap that is named
user-ca-bundlethat contains the additional CA certificates you defined. The Cluster Network Operator then creates atrusted-ca-bundleConfigMap that merges these CA certificates with the Red Hat Enterprise Linux CoreOS (RHCOS) trust bundle; this ConfigMap is referenced in the Proxy object’strustedCAfield.-
At runtime, modify the default Proxy object to include your privately signed CA certificates (part of cluster’s proxy enablement workflow). This involves creating a ConfigMap that contains the privately signed CA certificates that should be trusted by the cluster, and then modifying the proxy resource with the
trustedCAreferencing the privately signed certificates' ConfigMap.
The installer configuration’s additionalTrustBundle field and the proxy resource’s trustedCA field are used to manage the cluster-wide trust bundle; additionalTrustBundle is used at install time and the proxy’s trustedCA is used at runtime.
The trustedCA field is a reference to a ConfigMap containing the custom certificate and key pair used by the cluster component.
25.1. Configuring the cluster-wide proxy during installation
To enable internet access in environments that deny direct connections, configure a cluster-wide proxy in the install-config.yaml file. This configuration ensures that the new OpenShift Container Platform cluster routes traffic through the specified HTTP or HTTPS proxy.
Prerequisites
You have reviewed the sites that your cluster requires access to and determined whether any of them need to bypass the proxy. By default, all cluster egress traffic is proxied, including calls to hosting cloud provider APIs. You added sites to the
Proxyobject’sspec.noProxyfield to bypass the proxy if necessary.NoteThe
Proxyobjectstatus.noProxyfield is populated with the values of thenetworking.machineNetwork[].cidr,networking.clusterNetwork[].cidr, andnetworking.serviceNetwork[]fields from your installation configuration.For installations on Amazon Web Services (AWS), Google Cloud, Microsoft Azure, and Red Hat OpenStack Platform (RHOSP), the
Proxyobjectstatus.noProxyfield is also populated with the instance metadata endpoint (169.254.169.254).
Procedure
Edit your
install-config.yamlfile and add the proxy settings. For example:apiVersion: v1 baseDomain: my.domain.com proxy: httpProxy: http://<username>:<pswd>@<ip>:<port> httpsProxy: https://<username>:<pswd>@<ip>:<port> noProxy: ec2.<aws_region>.amazonaws.com,elasticloadbalancing.<aws_region>.amazonaws.com,s3.<aws_region>.amazonaws.com additionalTrustBundle: | -----BEGIN CERTIFICATE----- <MY_TRUSTED_CA_CERT> -----END CERTIFICATE----- additionalTrustBundlePolicy: <policy_to_add_additionalTrustBundle> # ...where:
proxy.httpProxy-
Specifies a proxy URL to use for creating HTTP connections outside the cluster. The URL scheme must be
http. proxy.httpsProxy- Specifies a proxy URL to use for creating HTTPS connections outside the cluster.
proxy.noProxy-
Specifies a comma-separated list of destination domain names, IP addresses, or other network CIDRs to exclude from proxying. Preface a domain with
.to match subdomains only. For example,.y.commatchesx.y.com, but noty.com. Use*to bypass the proxy for all destinations. If you have added the AmazonEC2,Elastic Load Balancing, andS3VPC endpoints to your VPC, you must add these endpoints to thenoProxyfield. additionalTrustBundle-
If provided, the installation program generates a config map that is named
user-ca-bundlein theopenshift-confignamespace to hold the additional CA certificates. If you provideadditionalTrustBundleand at least one proxy setting, theProxyobject is configured to reference theuser-ca-bundleconfig map in thetrustedCAfield. The Cluster Network Operator then creates atrusted-ca-bundleconfig map that merges the contents specified for thetrustedCAparameter with the RHCOS trust bundle. TheadditionalTrustBundlefield is required unless the proxy’s identity certificate is signed by an authority from the RHCOS trust bundle. additionalTrustBundlePolicySpecifies the policy that determines the configuration of the
Proxyobject to reference theuser-ca-bundleconfig map in thetrustedCAfield. The allowed values areProxyonlyandAlways. UseProxyonlyto reference theuser-ca-bundleconfig map only whenhttp/httpsproxy is configured. UseAlwaysto always reference theuser-ca-bundleconfig map. The default value isProxyonly. Optional parameter.NoteThe installation program does not support the proxy
readinessEndpointsfield.NoteIf the installation program times out, restart and then complete the deployment by using the
wait-forcommand of the installation program. For example:$ ./openshift-install wait-for install-complete --log-level debug
Save the file and reference it when installing OpenShift Container Platform.
The installation program creates a cluster-wide proxy that is named
clusterthat uses the proxy settings in the providedinstall-config.yamlfile. If no proxy settings are provided, aclusterProxyobject is still created, but it will have a nilspec.NoteOnly the
Proxyobject namedclusteris supported, and no additional proxies can be created.
25.2. Enabling the cluster-wide proxy
To enable the cluster-wide egress proxy for your OpenShift Container Platform cluster, you can modify the Proxy object to configure HTTP and HTTPS proxy settings and specify domains that bypass the proxy.
When a cluster is installed or upgraded without the proxy configured, a Proxy object is still generated but it has a nil spec. For example:
apiVersion: config.openshift.io/v1
kind: Proxy
metadata:
name: cluster
spec:
trustedCA:
name: ""
status:
Only the Proxy object named cluster is supported, and no additional proxies can be created.
A cluster administrator can configure the proxy for OpenShift Container Platform by modifying the cluster Proxy object.
After you enable the cluster-wide proxy capability for your cluster and you save the Proxy object file, the Machine Config Operator (MCO) reboots all nodes in your cluster so that each node can access connections that exist outside of the cluster. You do not need to manually reboot these nodes.
Prerequisites
- You have cluster administrator permissions.
-
You installed the OpenShift Container Platform
ocCLI tool.
Procedure
Create a config map that contains any additional CA certificates required for proxying HTTPS connections.
NoteYou can skip this step if the identity certificate of the proxy is signed by an authority from the Red Hat Enterprise Linux CoreOS (RHCOS) trust bundle.
Create a file called
user-ca-bundle.yaml, and provide the values of your PEM-encoded certificates:apiVersion: v1 data: ca-bundle.crt: |1 <MY_PEM_ENCODED_CERTS>2 kind: ConfigMap metadata: name: user-ca-bundle3 namespace: openshift-config4 where:
data.ca-bundle.crt-
Specifies the data key that must be named
ca-bundle.crt. <MY_PEM_ENCODED_CERTS>- Specifies one or more PEM-encoded X.509 certificates used to sign the proxy’s identity certificate.
user-ca-bundle-
Specifies the config map name that is referenced from the
Proxyobject. openshift-config- Specifies the namespace that the config map must exist in.
Create the config map from the
user-ca-bundle.yamlfile by entering the following command:$ oc create -f user-ca-bundle.yaml
Use the
oc editcommand to modify theProxyobject:$ oc edit proxy/clusterConfigure the necessary fields for the proxy:
apiVersion: config.openshift.io/v1 kind: Proxy metadata: name: cluster spec: httpProxy: http://<username>:<pswd>@<ip>:<port>1 httpsProxy: https://<username>:<pswd>@<ip>:<port>2 noProxy: example.com3 readinessEndpoints: - http://www.google.com4 - https://www.google.com trustedCA: name: user-ca-bundle5 where:
httpProxy-
Specifies the proxy URL to use for creating HTTP connections outside the cluster. The URL scheme must be
http. httpsProxy-
Specifies the proxy URL to use for creating HTTPS connections outside the cluster. The URL scheme must be either
httporhttps. Specify a URL for the proxy that supports the URL scheme. For example, most proxies report an error if they are configured to usehttpsbut they only supporthttp. This failure message may not propagate to the logs and can appear to be a network connection failure instead. If using a proxy that listens forhttpsconnections from the cluster, you might need to configure the cluster to accept the CAs and certificates that the proxy uses. noProxySpecifies a comma-separated list of destination domain names, domains, IP addresses (or other network CIDRs), and port numbers to exclude proxying. Note that Port numbers are only supported when configuring IPv6 addresses. Port numbers are not supported when configuring IPv4 addresses.
Preface a domain with
.to match subdomains only. For example,.y.commatchesx.y.com, but noty.com. Use*to bypass proxy for all destinations.If your
noproxyfield needs to include a domain address, you must explicitly specify that FQDN, or prefix-matched subdomain, in thenoproxyfield. You cannot use the IP address or CIDR range that encapsulates the domain. This is because the cluster does not wait for DNS to return the IP address before assigning the route connection, and checks explicitly against the request being made. For example, if you have a CIDR block value, such as10.0.0.0/24, for thenoproxyfield and the field attempts to accesshttps://10.0.0.11, the addresses successfully match. However, attempting to accesshttps://exampleserver.externaldomain.com, whose A record entry is10.0.0.11, fails. An additional value of.externaldomain.comfor yournoproxyfield is necessary.If you scale up compute nodes that are not included in the network defined by the
networking.machineNetwork[].cidrfield from the installation configuration, you must add them to this list to prevent connection issues.This field is ignored if neither the
httpProxyorhttpsProxyfields are set.readinessEndpoints-
Specifies one or more URLs external to the cluster to use to perform a readiness check before writing the
httpProxyandhttpsProxyvalues to status. trustedCA-
Specifies a reference to the config map in the
openshift-confignamespace that contains additional CA certificates required for proxying HTTPS connections. Note that the config map must already exist before referencing it here. This field is required unless the proxy’s identity certificate is signed by an authority from the RHCOS trust bundle.
- Save the file to apply the changes.
25.3. Certificate injection using Operators
In OpenShift Container Platform, certificate injection using Operators merges your custom Certificate Authorities (CAs) with system certificates and injects the merged bundle into Operators that request it. You can use this feature so your Operators trust custom certificates without requiring manual certificate bundle management.
After adding a config.openshift.io/inject-trusted-cabundle="true" label to the config map, existing data in it is deleted. The Cluster Network Operator takes ownership of a config map and only accepts ca-bundle as data. You must use a separate config map to store service-ca.crt by using the service.beta.openshift.io/inject-cabundle=true annotation or a similar configuration. Adding a config.openshift.io/inject-trusted-cabundle="true" label and service.beta.openshift.io/inject-cabundle=true annotation on the same config map can cause issues.
Operators request this injection by creating an empty ConfigMap with the following label:
config.openshift.io/inject-trusted-cabundle="true"An example of the empty ConfigMap:
apiVersion: v1
data: {}
kind: ConfigMap
metadata:
labels:
config.openshift.io/inject-trusted-cabundle: "true"
name: ca-inject
namespace: apachewhere:
metadata.name- Specifies the empty ConfigMap name.
The Operator mounts this ConfigMap into the container’s local trust store.
Adding a trusted CA certificate is only needed if the certificate is not included in the Red Hat Enterprise Linux CoreOS (RHCOS) trust bundle.
Certificate injection is not limited to Operators. The Cluster Network Operator injects certificates across any namespace when an empty ConfigMap is created with the config.openshift.io/inject-trusted-cabundle=true label.
The ConfigMap can reside in any namespace, but the ConfigMap must be mounted as a volume to each container within a pod that requires a custom CA. For example:
apiVersion: apps/v1
kind: Deployment
metadata:
name: my-example-custom-ca-deployment
namespace: my-example-custom-ca-ns
spec:
...
spec:
...
containers:
- name: my-container-that-needs-custom-ca
volumeMounts:
- name: trusted-ca
mountPath: /etc/pki/ca-trust/extracted/pem
readOnly: true
volumes:
- name: trusted-ca
configMap:
name: ca-inject
items:
- key: ca-bundle.crt
path: tls-ca-bundle.pemwhere:
volumes.items.key- Specifies the ConfigMap key.
volumes.items.path- Specifies the ConfigMap path.
Chapter 26. Load balancing on RHOSP
To distribute network traffic and communications activity evenly across your compute instances in RHOSP, configure load balancing services.
26.1. Limitations of load balancer services
To optimise network resource management and mitigate operational risks in OpenShift Container Platform clusters on Red Hat OpenStack Platform (RHOSP), review the implementation of Octavia for load balancer services.
OpenShift Container Platform clusters on Red Hat OpenStack Platform (RHOSP) use Octavia to handle load balancer services. As a result, your cluster has several functional limitations.
RHOSP Octavia has two supported providers: Amphora and OVN. These providers differ in available features and implementation details. These distinctions affect load balancer services that you create on your cluster.
26.1.1. Local external traffic policies
You can set the external traffic policy (ETP) parameter, .spec.externalTrafficPolicy, on a load balancer service to preserve the source IP address of incoming traffic when it reaches service endpoint pods.
If your cluster uses the Amphora Octavia provider, the source IP of the traffic is replaced with the IP address of the Amphora VM. This behavior does not occur if your cluster uses the OVN Octavia provider.
Having the ETP option set to Local requires creating health monitors for the load balancer. Without health monitors, traffic can be routed to a node that does not have a functional endpoint, which causes the connection to drop. To force Cloud Provider OpenStack to create health monitors, you must set the value of the create-monitor option in the cloud provider configuration to true.
In RHOSP 16.2, the OVN Octavia provider does not support health monitors. Therefore, setting the ETP to Local is unsupported.
In RHOSP 16.2, the Amphora Octavia provider does not support HTTP monitors on UDP pools. As a result, UDP load balancer services have UDP-CONNECT monitors created instead. Due to implementation details, this configuration only functions properly with the OVN-Kubernetes CNI plugin. When the OpenShift SDN CNI plugin is used, the UDP services alive nodes are detected unreliably. This issue also affects the OVN Octavia provider in any RHOSP version because the driver does not support HTTP health monitors.
26.2. Scaling clusters for application traffic by using Octavia
To distribute traffic across multiple virtual machines (VMs), configure your cluster that runs on Red Hat OpenStack Platform (RHOSP) to use the Octavia load balancing service. By using this feature, you can mitigate the bottleneck that single machines or addresses create.
You must create your own Octavia load balancer to use it for application network scaling.
26.2.1. Scaling clusters by using Octavia
To ensure high availability and distribute traffic across multiple cluster API access points in OpenShift Container Platform on RHOSP, create an Octavia load balancer. Configuring your cluster to use multiple balancers prevents network bottlenecks and ensures continuous access to your API services.
Prerequisites
- Octavia is available on your Red Hat OpenStack Platform (RHOSP) deployment.
Procedure
From the command-line interface (CLI), create an Octavia load balancer that uses the Amphora driver:
$ openstack loadbalancer create --name API_OCP_CLUSTER --vip-subnet-id <id_of_worker_vms_subnet>You can use a name of your choice instead of
API_OCP_CLUSTER.After the load balancer becomes active, create listeners:
$ openstack loadbalancer listener create --name API_OCP_CLUSTER_6443 --protocol HTTPS--protocol-port 6443 API_OCP_CLUSTERNoteTo view the status of the load balancer, enter
openstack loadbalancer list.Create a pool that uses the round-robin algorithm and has session persistence enabled:
$ openstack loadbalancer pool create --name API_OCP_CLUSTER_pool_6443 --lb-algorithm ROUND_ROBIN --session-persistence type=<source_IP_address> --listener API_OCP_CLUSTER_6443 --protocol HTTPSTo ensure that control-plane machines are available, create a health monitor:
$ openstack loadbalancer healthmonitor create --delay 5 --max-retries 4 --timeout 10 --type TCP API_OCP_CLUSTER_pool_6443Add the control plane machines as members of the load balancer pool:
$ for SERVER in $(MASTER-0-IP MASTER-1-IP MASTER-2-IP) do openstack loadbalancer member create --address $SERVER --protocol-port 6443 API_OCP_CLUSTER_pool_6443 doneOptional: To reuse the cluster API floating IP address, unset it:
$ openstack floating ip unset $API_FIPAdd either the unset
API_FIPor a new address to the created load balancer VIP:$ openstack floating ip set --port $(openstack loadbalancer show -c <vip_port_id> -f value API_OCP_CLUSTER) $API_FIPYour cluster now uses Octavia for load balancing.
26.3. Services for a user-managed load balancer
To integrate your infrastructure with existing network standards or gain more control over traffic management in OpenShift Container Platform on Red Hat OpenStack Platform (RHOSP) , configure services for a user-managed load balancer.
Configuring a user-managed load balancer depends on your vendor’s load balancer.
The information and examples in this section are for guideline purposes only. Consult the vendor documentation for more specific information about the vendor’s load balancer.
Red Hat supports the following services for a user-managed load balancer:
- Ingress Controller
- OpenShift API
- OpenShift MachineConfig API
You can choose whether you want to configure one or all of these services for a user-managed load balancer. Configuring only the Ingress Controller service is a common configuration option. To better understand each service, view the following diagrams:
Figure 26.1. Example network workflow that shows an Ingress Controller operating in an OpenShift Container Platform environment
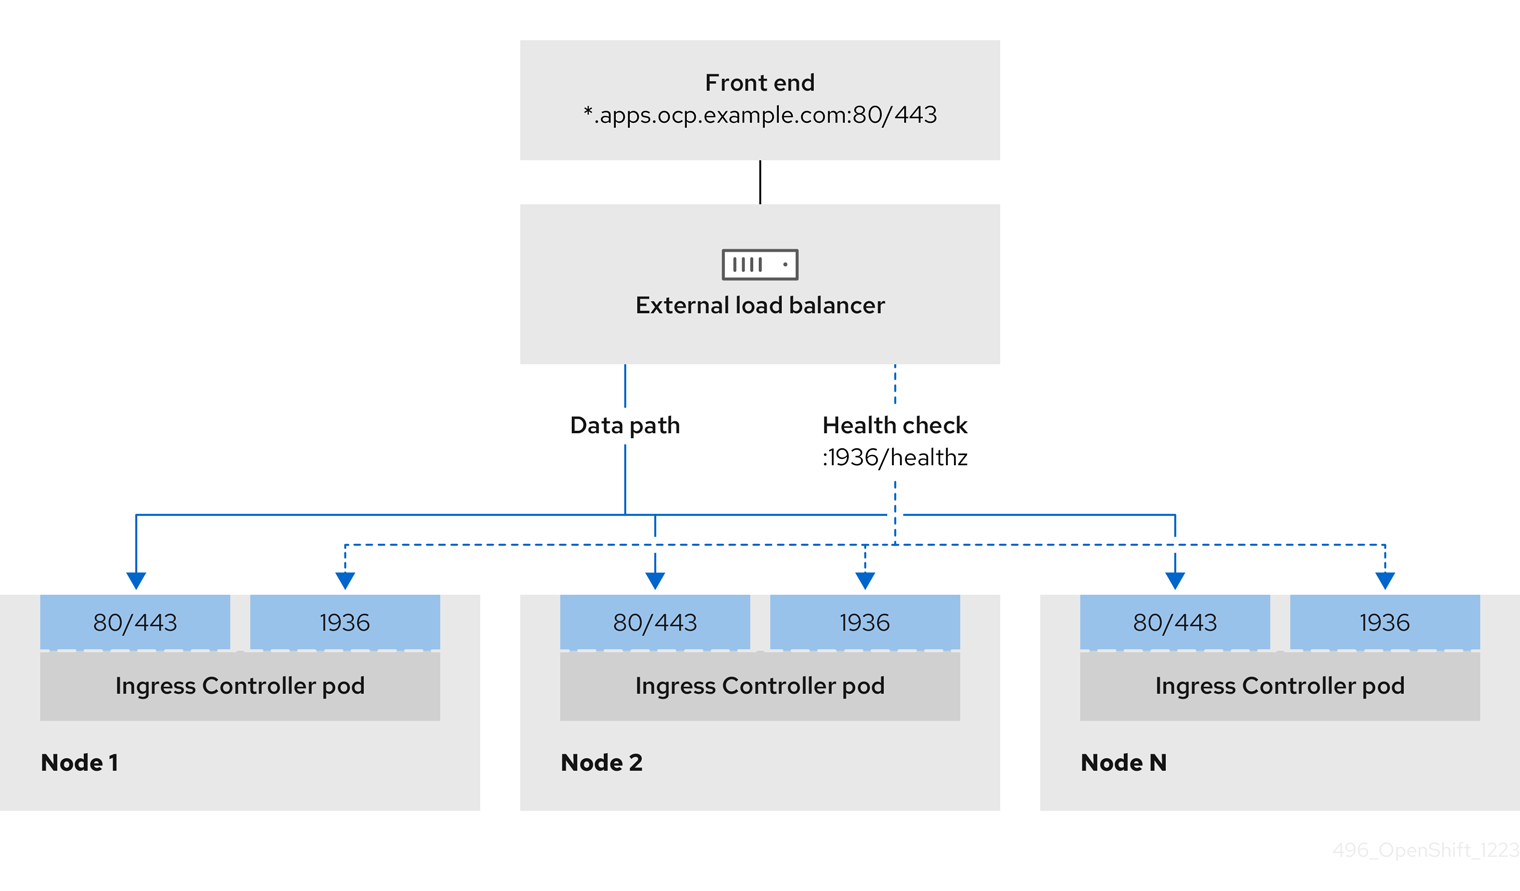
Figure 26.2. Example network workflow that shows an OpenShift API operating in an OpenShift Container Platform environment

Figure 26.3. Example network workflow that shows an OpenShift MachineConfig API operating in an OpenShift Container Platform environment
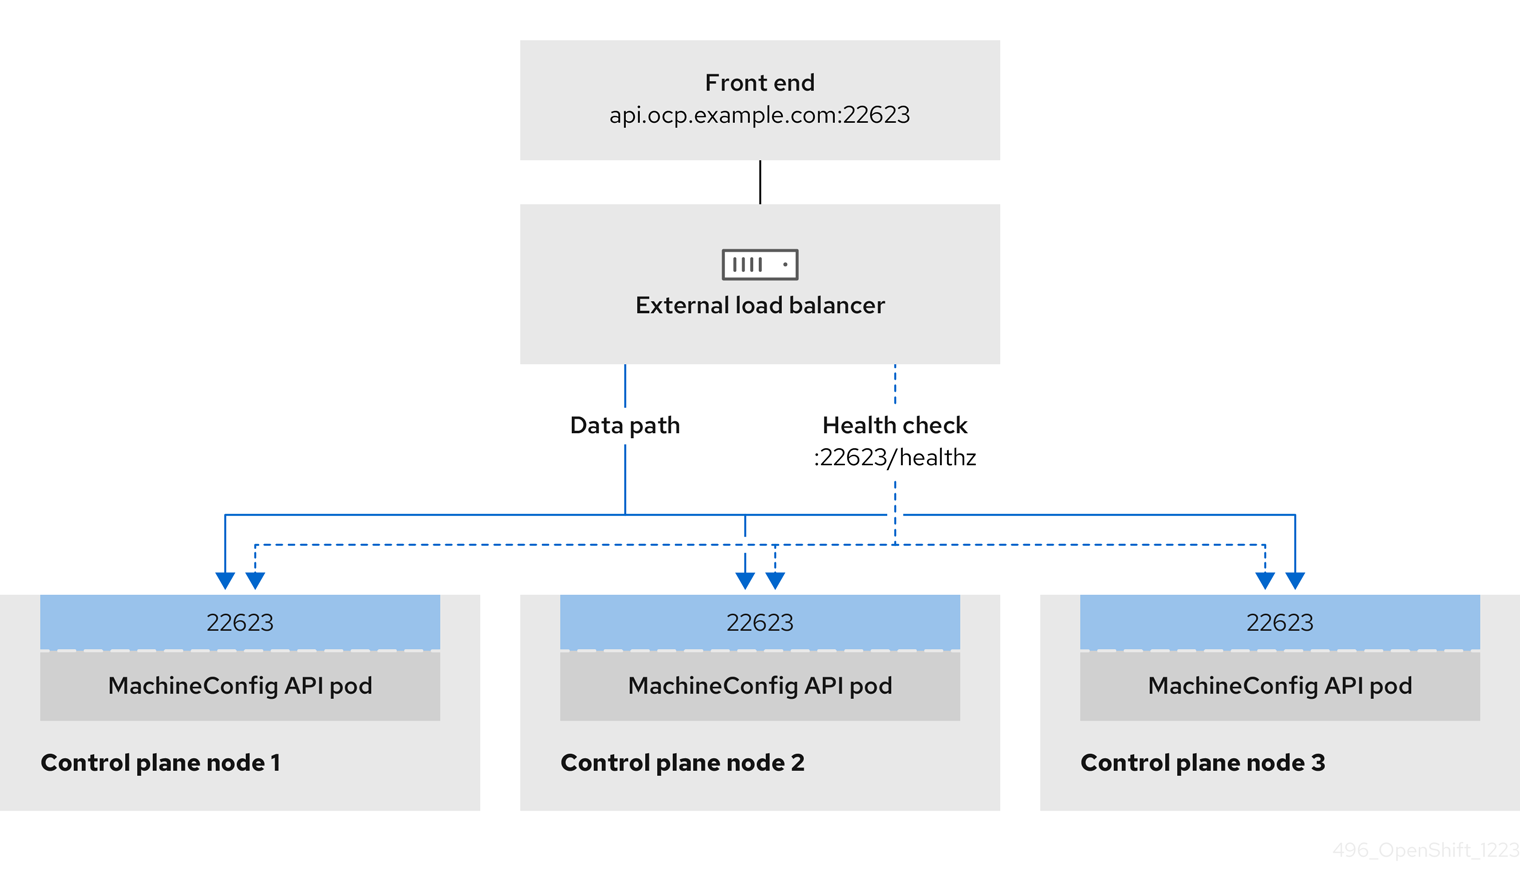
The following configuration options are supported for user-managed load balancers:
- Use a node selector to map the Ingress Controller to a specific set of nodes. You must assign a static IP address to each node in this set, or configure each node to receive the same IP address from the Dynamic Host Configuration Protocol (DHCP). Infrastructure nodes commonly receive this type of configuration.
Target all IP addresses on a subnet. This configuration can reduce maintenance overhead, because you can create and destroy nodes within those networks without reconfiguring the load balancer targets. If you deploy your ingress pods by using a machine set on a smaller network, such as a
/27or/28, you can simplify your load balancer targets.TipYou can list all IP addresses that exist in a network by checking the machine config pool’s resources.
Before you configure a user-managed load balancer for your OpenShift Container Platform cluster, consider the following information:
- For a front-end IP address, you can use the same IP address for the front-end IP address, the Ingress Controller’s load balancer, and API load balancer. Check the vendor’s documentation for this capability.
For a back-end IP address, ensure that an IP address for an OpenShift Container Platform control plane node does not change during the lifetime of the user-managed load balancer. You can achieve this by completing one of the following actions:
- Assign a static IP address to each control plane node.
- Configure each node to receive the same IP address from the DHCP every time the node requests a DHCP lease. Depending on the vendor, the DHCP lease might be in the form of an IP reservation or a static DHCP assignment.
- Manually define each node that runs the Ingress Controller in the user-managed load balancer for the Ingress Controller back-end service. For example, if the Ingress Controller moves to an undefined node, a connection outage can occur.
26.3.1. Configuring a user-managed load balancer
To integrate your infrastructure with existing network standards or gain more control over traffic management in OpenShift Container Platform on Red Hat OpenStack Platform (RHOSP) , use a user-managed load balancer in place of the default load balancer.
Before you configure a user-managed load balancer, ensure that you read the "Services for a user-managed load balancer" section.
Read the following prerequisites that apply to the service that you want to configure for your user-managed load balancer.
MetalLB, which runs on a cluster, functions as a user-managed load balancer.
Prerequisites
The following list details OpenShift API prerequisites:
- You defined a front-end IP address.
TCP ports 6443 and 22623 are exposed on the front-end IP address of your load balancer. Check the following items:
- Port 6443 provides access to the OpenShift API service.
- Port 22623 can provide ignition startup configurations to nodes.
- The front-end IP address and port 6443 are reachable by all users of your system with a location external to your OpenShift Container Platform cluster.
- The front-end IP address and port 22623 are reachable only by OpenShift Container Platform nodes.
- The load balancer backend can communicate with OpenShift Container Platform control plane nodes on port 6443 and 22623.
The following list details Ingress Controller prerequisites:
- You defined a front-end IP address.
- TCP port 443 and port 80 are exposed on the front-end IP address of your load balancer.
- The front-end IP address, port 80 and port 443 are reachable by all users of your system with a location external to your OpenShift Container Platform cluster.
- The front-end IP address, port 80 and port 443 are reachable by all nodes that operate in your OpenShift Container Platform cluster.
- The load balancer backend can communicate with OpenShift Container Platform nodes that run the Ingress Controller on ports 80, 443, and 1936.
The following list details prerequisites for health check URL specifications:
You can configure most load balancers by setting health check URLs that determine if a service is available or unavailable. OpenShift Container Platform provides these health checks for the OpenShift API, Machine Configuration API, and Ingress Controller backend services.
The following example shows a Kubernetes API health check specification for a backend service:
Path: HTTPS:6443/readyz
Healthy threshold: 2
Unhealthy threshold: 2
Timeout: 10
Interval: 10The following example shows a Machine Config API health check specification for a backend service:
Path: HTTPS:22623/healthz
Healthy threshold: 2
Unhealthy threshold: 2
Timeout: 10
Interval: 10The following example shows a Ingress Controller health check specification for a backend service:
Path: HTTP:1936/healthz/ready
Healthy threshold: 2
Unhealthy threshold: 2
Timeout: 5
Interval: 10Procedure
Configure the HAProxy Ingress Controller, so that you can enable access to the cluster from your load balancer on ports 6443, 22623, 443, and 80. Depending on your needs, you can specify the IP address of a single subnet or IP addresses from multiple subnets in your HAProxy configuration.
Example HAProxy configuration with one listed subnet
# ... listen my-cluster-api-6443 bind 192.168.1.100:6443 mode tcp balance roundrobin option httpchk http-check connect http-check send meth GET uri /readyz http-check expect status 200 server my-cluster-master-2 192.168.1.101:6443 check inter 10s rise 2 fall 2 server my-cluster-master-0 192.168.1.102:6443 check inter 10s rise 2 fall 2 server my-cluster-master-1 192.168.1.103:6443 check inter 10s rise 2 fall 2 listen my-cluster-machine-config-api-22623 bind 192.168.1.100:22623 mode tcp balance roundrobin option httpchk http-check connect http-check send meth GET uri /healthz http-check expect status 200 server my-cluster-master-2 192.168.1.101:22623 check inter 10s rise 2 fall 2 server my-cluster-master-0 192.168.1.102:22623 check inter 10s rise 2 fall 2 server my-cluster-master-1 192.168.1.103:22623 check inter 10s rise 2 fall 2 listen my-cluster-apps-443 bind 192.168.1.100:443 mode tcp balance roundrobin option httpchk http-check connect http-check send meth GET uri /healthz/ready http-check expect status 200 server my-cluster-worker-0 192.168.1.111:443 check port 1936 inter 10s rise 2 fall 2 server my-cluster-worker-1 192.168.1.112:443 check port 1936 inter 10s rise 2 fall 2 server my-cluster-worker-2 192.168.1.113:443 check port 1936 inter 10s rise 2 fall 2 listen my-cluster-apps-80 bind 192.168.1.100:80 mode tcp balance roundrobin option httpchk http-check connect http-check send meth GET uri /healthz/ready http-check expect status 200 server my-cluster-worker-0 192.168.1.111:80 check port 1936 inter 10s rise 2 fall 2 server my-cluster-worker-1 192.168.1.112:80 check port 1936 inter 10s rise 2 fall 2 server my-cluster-worker-2 192.168.1.113:80 check port 1936 inter 10s rise 2 fall 2 # ...Example HAProxy configuration with multiple listed subnets
# ... listen api-server-6443 bind *:6443 mode tcp server master-00 192.168.83.89:6443 check inter 1s server master-01 192.168.84.90:6443 check inter 1s server master-02 192.168.85.99:6443 check inter 1s server bootstrap 192.168.80.89:6443 check inter 1s listen machine-config-server-22623 bind *:22623 mode tcp server master-00 192.168.83.89:22623 check inter 1s server master-01 192.168.84.90:22623 check inter 1s server master-02 192.168.85.99:22623 check inter 1s server bootstrap 192.168.80.89:22623 check inter 1s listen ingress-router-80 bind *:80 mode tcp balance source server worker-00 192.168.83.100:80 check inter 1s server worker-01 192.168.83.101:80 check inter 1s listen ingress-router-443 bind *:443 mode tcp balance source server worker-00 192.168.83.100:443 check inter 1s server worker-01 192.168.83.101:443 check inter 1s listen ironic-api-6385 bind *:6385 mode tcp balance source server master-00 192.168.83.89:6385 check inter 1s server master-01 192.168.84.90:6385 check inter 1s server master-02 192.168.85.99:6385 check inter 1s server bootstrap 192.168.80.89:6385 check inter 1s listen inspector-api-5050 bind *:5050 mode tcp balance source server master-00 192.168.83.89:5050 check inter 1s server master-01 192.168.84.90:5050 check inter 1s server master-02 192.168.85.99:5050 check inter 1s server bootstrap 192.168.80.89:5050 check inter 1s # ...Use the
curlCLI command to verify that the user-managed load balancer and its resources are operational:Verify that the cluster machine configuration API is accessible to the Kubernetes API server resource, by running the following command and observing the response:
$ curl https://<loadbalancer_ip_address>:6443/version --insecureIf the configuration is correct, you receive a JSON object in response:
{ "major": "1", "minor": "11+", "gitVersion": "v1.11.0+ad103ed", "gitCommit": "ad103ed", "gitTreeState": "clean", "buildDate": "2019-01-09T06:44:10Z", "goVersion": "go1.10.3", "compiler": "gc", "platform": "linux/amd64" }Verify that the cluster machine configuration API is accessible to the Machine config server resource, by running the following command and observing the output:
$ curl -v https://<loadbalancer_ip_address>:22623/healthz --insecureIf the configuration is correct, the output from the command shows the following response:
HTTP/1.1 200 OK Content-Length: 0Verify that the controller is accessible to the Ingress Controller resource on port 80, by running the following command and observing the output:
$ curl -I -L -H "Host: console-openshift-console.apps.<cluster_name>.<base_domain>" http://<load_balancer_front_end_IP_address>If the configuration is correct, the output from the command shows the following response:
HTTP/1.1 302 Found content-length: 0 location: https://console-openshift-console.apps.ocp4.private.opequon.net/ cache-control: no-cacheVerify that the controller is accessible to the Ingress Controller resource on port 443, by running the following command and observing the output:
$ curl -I -L --insecure --resolve console-openshift-console.apps.<cluster_name>.<base_domain>:443:<Load Balancer Front End IP Address> https://console-openshift-console.apps.<cluster_name>.<base_domain>If the configuration is correct, the output from the command shows the following response:
HTTP/1.1 200 OK referrer-policy: strict-origin-when-cross-origin set-cookie: csrf-token=UlYWOyQ62LWjw2h003xtYSKlh1a0Py2hhctw0WmV2YEdhJjFyQwWcGBsja261dGLgaYO0nxzVErhiXt6QepA7g==; Path=/; Secure; SameSite=Lax x-content-type-options: nosniff x-dns-prefetch-control: off x-frame-options: DENY x-xss-protection: 1; mode=block date: Wed, 04 Oct 2023 16:29:38 GMT content-type: text/html; charset=utf-8 set-cookie: 1e2670d92730b515ce3a1bb65da45062=1bf5e9573c9a2760c964ed1659cc1673; path=/; HttpOnly; Secure; SameSite=None cache-control: private
Configure the DNS records for your cluster to target the front-end IP addresses of the user-managed load balancer. You must update records to your DNS server for the cluster API and applications over the load balancer. The following examples shows modified DNS records:
<load_balancer_ip_address> A api.<cluster_name>.<base_domain> A record pointing to Load Balancer Front End<load_balancer_ip_address> A apps.<cluster_name>.<base_domain> A record pointing to Load Balancer Front EndImportantDNS propagation might take some time for each DNS record to become available. Ensure that each DNS record propagates before validating each record.
For your OpenShift Container Platform cluster to use the user-managed load balancer, you must specify the following configuration in your cluster’s
install-config.yamlfile:# ... platform: openstack: loadBalancer: type: UserManaged apiVIPs: - <api_ip>1 ingressVIPs: - <ingress_ip>2 # ...where:
loadBalancer.type-
Set
UserManagedfor thetypeparameter to specify a user-managed load balancer for your cluster. The parameter defaults toOpenShiftManagedDefault, which denotes the default internal load balancer. For services defined in anopenshift-kni-infranamespace, a user-managed load balancer can deploy thecorednsservice to pods in your cluster but ignoreskeepalivedandhaproxyservices. loadBalancer.<api_ip>- Specifies a user-managed load balancer. Specify the user-managed load balancer’s public IP address, so that the Kubernetes API can communicate with the user-managed load balancer. Mandatory parameter.
loadBalancer.<ingress_ip>- Specifies a user-managed load balancer. Specify the user-managed load balancer’s public IP address, so that the user-managed load balancer can manage ingress traffic for your cluster. Mandatory parameter.
Verification
Use the
curlCLI command to verify that the user-managed load balancer and DNS record configuration are operational:Verify that you can access the cluster API, by running the following command and observing the output:
$ curl https://api.<cluster_name>.<base_domain>:6443/version --insecureIf the configuration is correct, you receive a JSON object in response:
{ "major": "1", "minor": "11+", "gitVersion": "v1.11.0+ad103ed", "gitCommit": "ad103ed", "gitTreeState": "clean", "buildDate": "2019-01-09T06:44:10Z", "goVersion": "go1.10.3", "compiler": "gc", "platform": "linux/amd64" }Verify that you can access the cluster machine configuration, by running the following command and observing the output:
$ curl -v https://api.<cluster_name>.<base_domain>:22623/healthz --insecureIf the configuration is correct, the output from the command shows the following response:
HTTP/1.1 200 OK Content-Length: 0Verify that you can access each cluster application on port 80, by running the following command and observing the output:
$ curl http://console-openshift-console.apps.<cluster_name>.<base_domain> -I -L --insecureIf the configuration is correct, the output from the command shows the following response:
HTTP/1.1 302 Found content-length: 0 location: https://console-openshift-console.apps.<cluster-name>.<base domain>/ cache-control: no-cacheHTTP/1.1 200 OK referrer-policy: strict-origin-when-cross-origin set-cookie: csrf-token=39HoZgztDnzjJkq/JuLJMeoKNXlfiVv2YgZc09c3TBOBU4NI6kDXaJH1LdicNhN1UsQWzon4Dor9GWGfopaTEQ==; Path=/; Secure x-content-type-options: nosniff x-dns-prefetch-control: off x-frame-options: DENY x-xss-protection: 1; mode=block date: Tue, 17 Nov 2020 08:42:10 GMT content-type: text/html; charset=utf-8 set-cookie: 1e2670d92730b515ce3a1bb65da45062=9b714eb87e93cf34853e87a92d6894be; path=/; HttpOnly; Secure; SameSite=None cache-control: privateVerify that you can access each cluster application on port 443, by running the following command and observing the output:
$ curl https://console-openshift-console.apps.<cluster_name>.<base_domain> -I -L --insecureIf the configuration is correct, the output from the command shows the following response:
HTTP/1.1 200 OK referrer-policy: strict-origin-when-cross-origin set-cookie: csrf-token=UlYWOyQ62LWjw2h003xtYSKlh1a0Py2hhctw0WmV2YEdhJjFyQwWcGBsja261dGLgaYO0nxzVErhiXt6QepA7g==; Path=/; Secure; SameSite=Lax x-content-type-options: nosniff x-dns-prefetch-control: off x-frame-options: DENY x-xss-protection: 1; mode=block date: Wed, 04 Oct 2023 16:29:38 GMT content-type: text/html; charset=utf-8 set-cookie: 1e2670d92730b515ce3a1bb65da45062=1bf5e9573c9a2760c964ed1659cc1673; path=/; HttpOnly; Secure; SameSite=None cache-control: private
Chapter 27. Load balancing with MetalLB
27.1. Configuring MetalLB address pools
As a cluster administrator, you can add, modify, and delete address pools. The MetalLB Operator uses the address pool custom resources to set the IP addresses that MetalLB can assign to services. The namespace used in the examples assume the namespace is metallb-system.
For more information about how to install the MetalLB Operator, see About MetalLB and the MetalLB Operator.
27.1.1. About the IPAddressPool custom resource
The fields for the IPAddressPool custom resource are described in the following tables.
| Field | Type | Description |
|---|---|---|
|
|
|
Specifies the name for the address pool. When you add a service, you can specify this pool name in the |
|
|
| Specifies the namespace for the address pool. Specify the same namespace that the MetalLB Operator uses. |
|
|
|
Optional: Specifies the key value pair assigned to the |
|
|
| Specifies a list of IP addresses for MetalLB Operator to assign to services. You can specify multiple ranges in a single pool; they will all share the same settings. Specify each range in CIDR notation or as starting and ending IP addresses separated with a hyphen. |
|
|
|
Optional: Specifies whether MetalLB automatically assigns IP addresses from this pool. Specify Note
For IP address pool configurations, ensure the addresses field specifies only IPs that are available and not in use by other network devices, especially gateway addresses, to prevent conflicts when |
|
|
|
Optional: This ensures when enabled that IP addresses ending |
You can assign IP addresses from an IPAddressPool to services and namespaces by configuring the spec.serviceAllocation specification.
| Field | Type | Description |
|---|---|---|
|
|
| Optional: Defines the priority between IP address pools when more than one IP address pool matches a service or namespace. A lower number indicates a higher priority. |
|
|
| Optional: Specifies a list of namespaces that you can assign to IP addresses in an IP address pool. |
|
|
| Optional: Specifies namespace labels that you can assign to IP addresses from an IP address pool by using label selectors in a list format. |
|
|
| Optional: Specifies service labels that you can assign to IP addresses from an address pool by using label selectors in a list format. |
27.1.2. Configuring an address pool
As a cluster administrator, you can add address pools to your cluster to control the IP addresses that MetalLB can assign to load-balancer services.
Prerequisites
-
Install the OpenShift CLI (
oc). -
Log in as a user with
cluster-adminprivileges.
Procedure
Create a file, such as
ipaddresspool.yaml, with content like the following example:apiVersion: metallb.io/v1beta1 kind: IPAddressPool metadata: namespace: metallb-system name: doc-example labels:1 zone: east spec: addresses: - 203.0.113.1-203.0.113.10 - 203.0.113.65-203.0.113.75 # ...Apply the configuration for the IP address pool:
$ oc apply -f ipaddresspool.yaml
Verification
View the address pool by entering the following command:
$ oc describe -n metallb-system IPAddressPool doc-exampleExample output
Name: doc-example Namespace: metallb-system Labels: zone=east Annotations: <none> API Version: metallb.io/v1beta1 Kind: IPAddressPool Metadata: ... Spec: Addresses: 203.0.113.1-203.0.113.10 203.0.113.65-203.0.113.75 Auto Assign: true Events: <none>-
Confirm that the address pool name, such as
doc-example, and the IP address ranges exist in the output.
27.1.3. Configure MetalLB address pool for VLAN
As a cluster administrator, you can add address pools to your cluster to control the IP addresses on a created VLAN that MetalLB can assign to load-balancer services
Prerequisites
-
Install the OpenShift CLI (
oc). - Configure a separate VLAN.
-
Log in as a user with
cluster-adminprivileges.
Procedure
Create a file, such as
ipaddresspool-vlan.yaml, that is similar to the following example:apiVersion: metallb.io/v1beta1 kind: IPAddressPool metadata: namespace: metallb-system name: doc-example-vlan labels: zone: east1 spec: addresses: - 192.168.100.1-192.168.100.2542 - 1
- This label assigned to the
IPAddressPoolcan be referenced by theipAddressPoolSelectorsin theBGPAdvertisementCRD to associate theIPAddressPoolwith the advertisement. - 2
- This IP range must match the subnet assigned to the VLAN on your network. To support layer 2 (L2) mode, the IP address range must be within the same subnet as the cluster nodes.
Apply the configuration for the IP address pool:
$ oc apply -f ipaddresspool-vlan.yamlTo ensure this configuration applies to the VLAN you need to set the
specgatewayConfig.ipForwardingtoGlobal.Run the following command to edit the network configuration custom resource (CR):
$ oc edit network.operator.openshift/clusterUpdate the
spec.defaultNetwork.ovnKubernetesConfigsection to include thegatewayConfig.ipForwardingset toGlobal. It should look something like this:Example
... spec: clusterNetwork: - cidr: 10.128.0.0/14 hostPrefix: 23 defaultNetwork: type: OVNKubernetes ovnKubernetesConfig: gatewayConfig: ipForwarding: Global ...
27.1.4. Example address pool configurations
The following examples show address pool configurations for specific scenarios.
27.1.4.1. Example: IPv4 and CIDR ranges
You can specify a range of IP addresses in classless inter-domain routing (CIDR) notation. You can combine CIDR notation with the notation that uses a hyphen to separate lower and upper bounds.
apiVersion: metallb.io/v1beta1
kind: IPAddressPool
metadata:
name: doc-example-cidr
namespace: metallb-system
spec:
addresses:
- 192.168.100.0/24
- 192.168.200.0/24
- 192.168.255.1-192.168.255.5
# ...27.1.4.2. Example: Assign IP addresses
You can set the autoAssign field to false to prevent MetalLB from automatically assigning IP addresses from the address pool. You can then assign a single IP address or multiple IP addresses from an IP address pool. To assign an IP address, append the /32 CIDR notation to the target IP address in the spec.addresses parameter. This setting ensures that only the specific IP address is avilable for assignment, leaving non-reserved IP addresses for application use.
Example IPAddressPool CR that assigns multiple IP addresses
apiVersion: metallb.io/v1beta1
kind: IPAddressPool
metadata:
name: doc-example-reserved
namespace: metallb-system
spec:
addresses:
- 192.168.100.1/32
- 192.168.200.1/32
autoAssign: false
# ...When you add a service, you can request a specific IP address from the address pool or you can specify the pool name in an annotation to request any IP address from the pool.
27.1.4.3. Example: IPv4 and IPv6 addresses
You can add address pools that use IPv4 and IPv6. You can specify multiple ranges in the addresses list, just like several IPv4 examples.
Whether the service is assigned a single IPv4 address, a single IPv6 address, or both is determined by how you add the service. The spec.ipFamilies and spec.ipFamilyPolicy fields control how IP addresses are assigned to the service.
apiVersion: metallb.io/v1beta1
kind: IPAddressPool
metadata:
name: doc-example-combined
namespace: metallb-system
spec:
addresses:
- 10.0.100.0/28
- 2002:2:2::1-2002:2:2::100
# ...- 1
- Where
10.0.100.0/28is the local network IP address followed by the/28network prefix.
27.1.4.4. Example: Assign IP address pools to services or namespaces
You can assign IP addresses from an IPAddressPool to services and namespaces that you specify.
If you assign a service or namespace to more than one IP address pool, MetalLB uses an available IP address from the higher-priority IP address pool. If no IP addresses are available from the assigned IP address pools with a high priority, MetalLB uses available IP addresses from an IP address pool with lower priority or no priority.
You can use the matchLabels label selector, the matchExpressions label selector, or both, for the namespaceSelectors and serviceSelectors specifications. This example demonstrates one label selector for each specification.
apiVersion: metallb.io/v1beta1
kind: IPAddressPool
metadata:
name: doc-example-service-allocation
namespace: metallb-system
spec:
addresses:
- 192.168.20.0/24
serviceAllocation:
priority: 50
namespaces:
- namespace-a
- namespace-b
namespaceSelectors:
- matchLabels:
zone: east
serviceSelectors:
- matchExpressions:
- key: security
operator: In
values:
- S1
# ...- 1
- Assign a priority to the address pool. A lower number indicates a higher priority.
- 2
- Assign one or more namespaces to the IP address pool in a list format.
- 3
- Assign one or more namespace labels to the IP address pool by using label selectors in a list format.
- 4
- Assign one or more service labels to the IP address pool by using label selectors in a list format.
27.1.5. Next steps
27.2. About advertising for the IP address pools
You can configure MetalLB so that the IP address is advertised with layer 2 protocols, the BGP protocol, or both. With layer 2, MetalLB provides a fault-tolerant external IP address. With BGP, MetalLB provides fault-tolerance for the external IP address and load balancing.
MetalLB supports advertising using L2 and BGP for the same set of IP addresses.
MetalLB provides the flexibility to assign address pools to specific BGP peers effectively to a subset of nodes on the network. This allows for more complex configurations, for example facilitating the isolation of nodes or the segmentation of the network.
27.2.1. About the BGPAdvertisement custom resource
The fields for the BGPAdvertisements object are defined in the following table:
| Field | Type | Description |
|---|---|---|
|
|
| Specifies the name for the BGP advertisement. |
|
|
| Specifies the namespace for the BGP advertisement. Specify the same namespace that the MetalLB Operator uses. |
|
|
|
Optional: Specifies the number of bits to include in a 32-bit CIDR mask. To aggregate the routes that the speaker advertises to BGP peers, the mask is applied to the routes for several service IP addresses and the speaker advertises the aggregated route. For example, with an aggregation length of |
|
|
|
Optional: Specifies the number of bits to include in a 128-bit CIDR mask. For example, with an aggregation length of |
|
|
| Optional: Specifies one or more BGP communities. Each community is specified as two 16-bit values separated by the colon character. Well-known communities must be specified as 16-bit values:
|
|
|
| Optional: Specifies the local preference for this advertisement. This BGP attribute applies to BGP sessions within the Autonomous System. |
|
|
|
Optional: The list of |
|
|
|
Optional: A selector for the |
|
|
|
Optional: |
|
|
|
Optional: Use a list to specify the |
27.2.2. Configuring MetalLB with a BGP advertisement and a basic use case
Configure MetalLB as follows so that the peer BGP routers receive one 203.0.113.200/32 route and one fc00:f853:ccd:e799::1/128 route for each load-balancer IP address that MetalLB assigns to a service. Because the localPref and communities fields are not specified, the routes are advertised with localPref set to zero and no BGP communities.
27.2.2.1. Example: Advertise a basic address pool configuration with BGP
Configure MetalLB as follows so that the IPAddressPool is advertised with the BGP protocol.
Prerequisites
-
Install the OpenShift CLI (
oc). -
Log in as a user with
cluster-adminprivileges.
Procedure
Create an IP address pool.
Create a file, such as
ipaddresspool.yaml, with content like the following example:apiVersion: metallb.io/v1beta1 kind: IPAddressPool metadata: namespace: metallb-system name: doc-example-bgp-basic spec: addresses: - 203.0.113.200/30 - fc00:f853:ccd:e799::/124Apply the configuration for the IP address pool:
$ oc apply -f ipaddresspool.yaml
Create a BGP advertisement.
Create a file, such as
bgpadvertisement.yaml, with content like the following example:apiVersion: metallb.io/v1beta1 kind: BGPAdvertisement metadata: name: bgpadvertisement-basic namespace: metallb-system spec: ipAddressPools: - doc-example-bgp-basicApply the configuration:
$ oc apply -f bgpadvertisement.yaml
27.2.3. Configuring MetalLB with a BGP advertisement and an advanced use case
Configure MetalLB as follows so that MetalLB assigns IP addresses to load-balancer services in the ranges between 203.0.113.200 and 203.0.113.203 and between fc00:f853:ccd:e799::0 and fc00:f853:ccd:e799::f.
To explain the two BGP advertisements, consider an instance when MetalLB assigns the IP address of 203.0.113.200 to a service. With that IP address as an example, the speaker advertises two routes to BGP peers:
-
203.0.113.200/32, withlocalPrefset to100and the community set to the numeric value of theNO_ADVERTISEcommunity. This specification indicates to the peer routers that they can use this route but they should not propagate information about this route to BGP peers. -
203.0.113.200/30, aggregates the load-balancer IP addresses assigned by MetalLB into a single route. MetalLB advertises the aggregated route to BGP peers with the community attribute set to8000:800. BGP peers propagate the203.0.113.200/30route to other BGP peers. When traffic is routed to a node with a speaker, the203.0.113.200/32route is used to forward the traffic into the cluster and to a pod that is associated with the service.
As you add more services and MetalLB assigns more load-balancer IP addresses from the pool, peer routers receive one local route, 203.0.113.20x/32, for each service, as well as the 203.0.113.200/30 aggregate route. Each service that you add generates the /30 route, but MetalLB deduplicates the routes to one BGP advertisement before communicating with peer routers.
27.2.3.1. Example: Advertise an advanced address pool configuration with BGP
Configure MetalLB as follows so that the IPAddressPool is advertised with the BGP protocol.
Prerequisites
-
Install the OpenShift CLI (
oc). -
Log in as a user with
cluster-adminprivileges.
Procedure
Create an IP address pool.
Create a file, such as
ipaddresspool.yaml, with content like the following example:apiVersion: metallb.io/v1beta1 kind: IPAddressPool metadata: namespace: metallb-system name: doc-example-bgp-adv labels: zone: east spec: addresses: - 203.0.113.200/30 - fc00:f853:ccd:e799::/124 autoAssign: falseApply the configuration for the IP address pool:
$ oc apply -f ipaddresspool.yaml
Create a BGP advertisement.
Create a file, such as
bgpadvertisement1.yaml, with content like the following example:apiVersion: metallb.io/v1beta1 kind: BGPAdvertisement metadata: name: bgpadvertisement-adv-1 namespace: metallb-system spec: ipAddressPools: - doc-example-bgp-adv communities: - 65535:65282 aggregationLength: 32 localPref: 100Apply the configuration:
$ oc apply -f bgpadvertisement1.yamlCreate a file, such as
bgpadvertisement2.yaml, with content like the following example:apiVersion: metallb.io/v1beta1 kind: BGPAdvertisement metadata: name: bgpadvertisement-adv-2 namespace: metallb-system spec: ipAddressPools: - doc-example-bgp-adv communities: - 8000:800 aggregationLength: 30 aggregationLengthV6: 124Apply the configuration:
$ oc apply -f bgpadvertisement2.yaml
27.2.4. Advertising an IP address pool from a subset of nodes
To advertise an IP address from an IP addresses pool, from a specific set of nodes only, use the .spec.nodeSelector specification in the BGPAdvertisement custom resource. This specification associates a pool of IP addresses with a set of nodes in the cluster. This is useful when you have nodes on different subnets in a cluster and you want to advertise an IP addresses from an address pool from a specific subnet, for example a public-facing subnet only.
Prerequisites
-
Install the OpenShift CLI (
oc). -
Log in as a user with
cluster-adminprivileges.
Procedure
Create an IP address pool by using a custom resource:
apiVersion: metallb.io/v1beta1 kind: IPAddressPool metadata: namespace: metallb-system name: pool1 spec: addresses: - 4.4.4.100-4.4.4.200 - 2001:100:4::200-2001:100:4::400Control which nodes in the cluster the IP address from
pool1advertises from by defining the.spec.nodeSelectorvalue in the BGPAdvertisement custom resource:apiVersion: metallb.io/v1beta1 kind: BGPAdvertisement metadata: name: example spec: ipAddressPools: - pool1 nodeSelector: - matchLabels: kubernetes.io/hostname: NodeA - matchLabels: kubernetes.io/hostname: NodeB
In this example, the IP address from pool1 advertises from NodeA and NodeB only.
27.2.5. About the L2Advertisement custom resource
The fields for the l2Advertisements object are defined in the following table:
| Field | Type | Description |
|---|---|---|
|
|
| Specifies the name for the L2 advertisement. |
|
|
| Specifies the namespace for the L2 advertisement. Specify the same namespace that the MetalLB Operator uses. |
|
|
|
Optional: The list of |
|
|
|
Optional: A selector for the |
|
|
|
Optional: Important Limiting the nodes to announce as next hops is a Technology Preview feature only. Technology Preview features are not supported with Red Hat production service level agreements (SLAs) and might not be functionally complete. Red Hat does not recommend using them in production. These features provide early access to upcoming product features, enabling customers to test functionality and provide feedback during the development process. For more information about the support scope of Red Hat Technology Preview features, see Technology Preview Features Support Scope. |
|
|
|
Optional: The list of |
27.2.6. Configuring MetalLB with an L2 advertisement
Configure MetalLB as follows so that the IPAddressPool is advertised with the L2 protocol.
Prerequisites
-
Install the OpenShift CLI (
oc). -
Log in as a user with
cluster-adminprivileges.
Procedure
Create an IP address pool.
Create a file, such as
ipaddresspool.yaml, with content like the following example:apiVersion: metallb.io/v1beta1 kind: IPAddressPool metadata: namespace: metallb-system name: doc-example-l2 spec: addresses: - 4.4.4.0/24 autoAssign: falseApply the configuration for the IP address pool:
$ oc apply -f ipaddresspool.yaml
Create a L2 advertisement.
Create a file, such as
l2advertisement.yaml, with content like the following example:apiVersion: metallb.io/v1beta1 kind: L2Advertisement metadata: name: l2advertisement namespace: metallb-system spec: ipAddressPools: - doc-example-l2Apply the configuration:
$ oc apply -f l2advertisement.yaml
27.2.7. Configuring MetalLB with a L2 advertisement and label
The ipAddressPoolSelectors field in the BGPAdvertisement and L2Advertisement custom resource definitions is used to associate the IPAddressPool to the advertisement based on the label assigned to the IPAddressPool instead of the name itself.
This example shows how to configure MetalLB so that the IPAddressPool is advertised with the L2 protocol by configuring the ipAddressPoolSelectors field.
Prerequisites
-
Install the OpenShift CLI (
oc). -
Log in as a user with
cluster-adminprivileges.
Procedure
Create an IP address pool.
Create a file, such as
ipaddresspool.yaml, with content like the following example:apiVersion: metallb.io/v1beta1 kind: IPAddressPool metadata: namespace: metallb-system name: doc-example-l2-label labels: zone: east spec: addresses: - 172.31.249.87/32Apply the configuration for the IP address pool:
$ oc apply -f ipaddresspool.yaml
Create a L2 advertisement advertising the IP using
ipAddressPoolSelectors.Create a file, such as
l2advertisement.yaml, with content like the following example:apiVersion: metallb.io/v1beta1 kind: L2Advertisement metadata: name: l2advertisement-label namespace: metallb-system spec: ipAddressPoolSelectors: - matchExpressions: - key: zone operator: In values: - eastApply the configuration:
$ oc apply -f l2advertisement.yaml
27.2.8. Configuring MetalLB with an L2 advertisement for selected interfaces
By default, the IP addresses from IP address pool that has been assigned to the service, is advertised from all the network interfaces. The interfaces field in the L2Advertisement custom resource definition is used to restrict those network interfaces that advertise the IP address pool.
This example shows how to configure MetalLB so that the IP address pool is advertised only from the network interfaces listed in the interfaces field of all nodes.
Prerequisites
-
You have installed the OpenShift CLI (
oc). -
You are logged in as a user with
cluster-adminprivileges.
Procedure
Create an IP address pool.
Create a file, such as
ipaddresspool.yaml, and enter the configuration details like the following example:apiVersion: metallb.io/v1beta1 kind: IPAddressPool metadata: namespace: metallb-system name: doc-example-l2 spec: addresses: - 4.4.4.0/24 autoAssign: falseApply the configuration for the IP address pool like the following example:
$ oc apply -f ipaddresspool.yaml
Create a L2 advertisement advertising the IP with
interfacesselector.Create a YAML file, such as
l2advertisement.yaml, and enter the configuration details like the following example:apiVersion: metallb.io/v1beta1 kind: L2Advertisement metadata: name: l2advertisement namespace: metallb-system spec: ipAddressPools: - doc-example-l2 interfaces: - interfaceA - interfaceBApply the configuration for the advertisement like the following example:
$ oc apply -f l2advertisement.yaml
The interface selector does not affect how MetalLB chooses the node to announce a given IP by using L2. The chosen node does not announce the service if the node does not have the selected interface.
27.2.9. Configuring MetalLB with secondary networks
From OpenShift Container Platform 4.14 the default network behavior is to not allow forwarding of IP packets between network interfaces. Therefore, when MetalLB is configured on a secondary interface, you need to add a machine configuration to enable IP forwarding for only the required interfaces.
OpenShift Container Platform clusters upgraded from 4.13 are not affected because a global parameter is set during upgrade to enable global IP forwarding.
To enable IP forwarding for the secondary interface, you have two options:
- Enable IP forwarding for all interfaces.
Enable IP forwarding for a specific interface.
NoteEnabling IP forwarding for a specific interface provides more granular control, while enabling it for all interfaces applies a global setting.
Procedure
Enable forwarding for a specific secondary interface, such as
bridge-netby creating and applying aMachineConfigCR.-
Create the
MachineConfigCR to enable IP forwarding for the specified secondary interface namedbridge-net. Save the following YAML in the
enable-ip-forward.yamlfile:apiVersion: machineconfiguration.openshift.io/v1 kind: MachineConfig metadata: labels: machineconfiguration.openshift.io/role: <node_role>1 name: 81-enable-global-forwarding spec: config: ignition: version: 3.2.0 storage: files: - contents: source: data:text/plain;charset=utf-8;base64,`echo -e "net.ipv4.conf.bridge-net.forwarding = 1\nnet.ipv6.conf.bridge-net.forwarding = 1\nnet.ipv4.conf.bridge-net.rp_filter = 0\nnet.ipv6.conf.bridge-net.rp_filter = 0" | base64 -w0` verification: {} filesystem: root mode: 644 path: /etc/sysctl.d/enable-global-forwarding.conf osImageURL: ""- 1
- Node role where you want to enable IP forwarding, for example,
worker
Apply the configuration by running the following command:
$ oc apply -f enable-ip-forward.yaml
-
Create the
Alternatively, you can enable IP forwarding globally by running the following command:
$ oc patch network.operator cluster -p '{"spec":{"defaultNetwork":{"ovnKubernetesConfig":{"gatewayConfig":{"ipForwarding": "Global"}}}}}' --type=merge
27.3. Configuring MetalLB BGP peers
As a cluster administrator, you can add, modify, and delete Border Gateway Protocol (BGP) peers. The MetalLB Operator uses the BGP peer custom resources to identify which peers that MetalLB speaker pods contact to start BGP sessions. The peers receive the route advertisements for the load-balancer IP addresses that MetalLB assigns to services.
27.3.1. About the BGP peer custom resource
The fields for the BGP peer custom resource are described in the following table.
| Field | Type | Description |
|---|---|---|
|
|
| Specifies the name for the BGP peer custom resource. |
|
|
| Specifies the namespace for the BGP peer custom resource. |
|
|
|
Specifies the Autonomous System Number (ASN) for the local end of the BGP session. In all BGP peer custom resources that you add, specify the same value. The range is |
|
|
|
Specifies the ASN for the remote end of the BGP session. The range is |
|
|
|
Detects the ASN to use for the remote end of the session without explicitly setting it. Specify |
|
|
| Specifies the IP address of the peer to contact for establishing the BGP session. |
|
|
| Optional: Specifies the IP address to use when establishing the BGP session. The value must be an IPv4 address. |
|
|
|
Optional: Specifies the network port of the peer to contact for establishing the BGP session. The range is |
|
|
|
Optional: Specifies the duration for the hold time to propose to the BGP peer. The minimum value is 3 seconds ( |
|
|
|
Optional: Specifies the maximum interval between sending keep-alive messages to the BGP peer. If you specify this field, you must also specify a value for the |
|
|
| Optional: Specifies the router ID to advertise to the BGP peer. If you specify this field, you must specify the same value in every BGP peer custom resource that you add. |
|
|
| Optional: Specifies the MD5 password to send to the peer for routers that enforce TCP MD5 authenticated BGP sessions. |
|
|
|
Optional: Specifies name of the authentication secret for the BGP Peer. The secret must live in the |
|
|
| Optional: Specifies the name of a BFD profile. |
|
|
| Optional: Specifies a selector, using match expressions and match labels, to control which nodes can connect to the BGP peer. |
|
|
|
Optional: Specifies that the BGP peer is multiple network hops away. If the BGP peer is not directly connected to the same network, the speaker cannot establish a BGP session unless this field is set to |
The passwordSecret field is mutually exclusive with the password field, and contains a reference to a secret containing the password to use. Setting both fields results in a failure of the parsing.
27.3.2. Configuring a BGP peer
As a cluster administrator, you can add a BGP peer custom resource to exchange routing information with network routers and advertise the IP addresses for services.
Prerequisites
-
Install the OpenShift CLI (
oc). -
Log in as a user with
cluster-adminprivileges. - Configure MetalLB with a BGP advertisement.
Procedure
Create a file, such as
bgppeer.yaml, with content like the following example:apiVersion: metallb.io/v1beta2 kind: BGPPeer metadata: namespace: metallb-system name: doc-example-peer spec: peerAddress: 10.0.0.1 peerASN: 64501 myASN: 64500 routerID: 10.10.10.10Apply the configuration for the BGP peer:
$ oc apply -f bgppeer.yaml
27.3.3. Configure a specific set of BGP peers for a given address pool
This procedure illustrates how to:
-
Configure a set of address pools (
pool1andpool2). -
Configure a set of BGP peers (
peer1andpeer2). -
Configure BGP advertisement to assign
pool1topeer1andpool2topeer2.
Prerequisites
-
Install the OpenShift CLI (
oc). -
Log in as a user with
cluster-adminprivileges.
Procedure
Create address pool
pool1.Create a file, such as
ipaddresspool1.yaml, with content like the following example:apiVersion: metallb.io/v1beta1 kind: IPAddressPool metadata: namespace: metallb-system name: pool1 spec: addresses: - 4.4.4.100-4.4.4.200 - 2001:100:4::200-2001:100:4::400Apply the configuration for the IP address pool
pool1:$ oc apply -f ipaddresspool1.yaml
Create address pool
pool2.Create a file, such as
ipaddresspool2.yaml, with content like the following example:apiVersion: metallb.io/v1beta1 kind: IPAddressPool metadata: namespace: metallb-system name: pool2 spec: addresses: - 5.5.5.100-5.5.5.200 - 2001:100:5::200-2001:100:5::400Apply the configuration for the IP address pool
pool2:$ oc apply -f ipaddresspool2.yaml
Create BGP
peer1.Create a file, such as
bgppeer1.yaml, with content like the following example:apiVersion: metallb.io/v1beta2 kind: BGPPeer metadata: namespace: metallb-system name: peer1 spec: peerAddress: 10.0.0.1 peerASN: 64501 myASN: 64500 routerID: 10.10.10.10Apply the configuration for the BGP peer:
$ oc apply -f bgppeer1.yaml
Create BGP
peer2.Create a file, such as
bgppeer2.yaml, with content like the following example:apiVersion: metallb.io/v1beta2 kind: BGPPeer metadata: namespace: metallb-system name: peer2 spec: peerAddress: 10.0.0.2 peerASN: 64501 myASN: 64500 routerID: 10.10.10.10Apply the configuration for the BGP peer2:
$ oc apply -f bgppeer2.yaml
Create BGP advertisement 1.
Create a file, such as
bgpadvertisement1.yaml, with content like the following example:apiVersion: metallb.io/v1beta1 kind: BGPAdvertisement metadata: name: bgpadvertisement-1 namespace: metallb-system spec: ipAddressPools: - pool1 peers: - peer1 communities: - 65535:65282 aggregationLength: 32 aggregationLengthV6: 128 localPref: 100Apply the configuration:
$ oc apply -f bgpadvertisement1.yaml
Create BGP advertisement 2.
Create a file, such as
bgpadvertisement2.yaml, with content like the following example:apiVersion: metallb.io/v1beta1 kind: BGPAdvertisement metadata: name: bgpadvertisement-2 namespace: metallb-system spec: ipAddressPools: - pool2 peers: - peer2 communities: - 65535:65282 aggregationLength: 32 aggregationLengthV6: 128 localPref: 100Apply the configuration:
$ oc apply -f bgpadvertisement2.yaml
27.3.4. Exposing a service through a network VRF
You can expose a service through a virtual routing and forwarding (VRF) instance by associating a VRF on a network interface with a BGP peer.
Exposing a service through a VRF on a BGP peer is a Technology Preview feature only. Technology Preview features are not supported with Red Hat production service level agreements (SLAs) and might not be functionally complete. Red Hat does not recommend using them in production. These features provide early access to upcoming product features, enabling customers to test functionality and provide feedback during the development process.
For more information about the support scope of Red Hat Technology Preview features, see Technology Preview Features Support Scope.
By using a VRF on a network interface to expose a service through a BGP peer, you can segregate traffic to the service, configure independent routing decisions, and enable multi-tenancy support on a network interface.
By establishing a BGP session through an interface belonging to a network VRF, MetalLB can advertise services through that interface and enable external traffic to reach the service through this interface. However, the network VRF routing table is different from the default VRF routing table used by OVN-Kubernetes. Therefore, the traffic cannot reach the OVN-Kubernetes network infrastructure.
To enable the traffic directed to the service to reach the OVN-Kubernetes network infrastructure, you must configure routing rules to define the next hops for network traffic. See the NodeNetworkConfigurationPolicy resource in "Managing symmetric routing with MetalLB" in the Additional resources section for more information.
These are the high-level steps to expose a service through a network VRF with a BGP peer:
- Define a BGP peer and add a network VRF instance.
- Specify an IP address pool for MetalLB.
- Configure a BGP route advertisement for MetalLB to advertise a route using the specified IP address pool and the BGP peer associated with the VRF instance.
- Deploy a service to test the configuration.
Prerequisites
-
You installed the OpenShift CLI (
oc). -
You logged in as a user with
cluster-adminprivileges. -
You defined a
NodeNetworkConfigurationPolicyto associate a Virtual Routing and Forwarding (VRF) instance with a network interface. For more information about completing this prerequisite, see the Additional resources section. - You installed MetalLB on your cluster.
Procedure
Create a
BGPPeercustom resources (CR):Create a file, such as
frrviavrf.yaml, with content like the following example:apiVersion: metallb.io/v1beta2 kind: BGPPeer metadata: name: frrviavrf namespace: metallb-system spec: myASN: 100 peerASN: 200 peerAddress: 192.168.130.1 vrf: ens4vrf1 - 1
- Specifies the network VRF instance to associate with the BGP peer. MetalLB can advertise services and make routing decisions based on the routing information in the VRF.
NoteYou must configure this network VRF instance in a
NodeNetworkConfigurationPolicyCR. See the Additional resources for more information.Apply the configuration for the BGP peer by running the following command:
$ oc apply -f frrviavrf.yaml
Create an
IPAddressPoolCR:Create a file, such as
first-pool.yaml, with content like the following example:apiVersion: metallb.io/v1beta1 kind: IPAddressPool metadata: name: first-pool namespace: metallb-system spec: addresses: - 192.169.10.0/32Apply the configuration for the IP address pool by running the following command:
$ oc apply -f first-pool.yaml
Create a
BGPAdvertisementCR:Create a file, such as
first-adv.yaml, with content like the following example:apiVersion: metallb.io/v1beta1 kind: BGPAdvertisement metadata: name: first-adv namespace: metallb-system spec: ipAddressPools: - first-pool peers: - frrviavrf1 - 1
- In this example, MetalLB advertises a range of IP addresses from the
first-poolIP address pool to thefrrviavrfBGP peer.
Apply the configuration for the BGP advertisement by running the following command:
$ oc apply -f first-adv.yaml
Create a
Namespace,Deployment, andServiceCR:Create a file, such as
deploy-service.yaml, with content like the following example:apiVersion: v1 kind: Namespace metadata: name: test --- apiVersion: apps/v1 kind: Deployment metadata: name: server namespace: test spec: selector: matchLabels: app: server template: metadata: labels: app: server spec: containers: - name: server image: nginx ports: - name: http containerPort: 80 --- apiVersion: v1 kind: Service metadata: name: server1 namespace: test spec: ports: - name: http port: 80 protocol: TCP targetPort: 80 selector: app: server type: LoadBalancerApply the configuration for the namespace, deployment, and service by running the following command:
$ oc apply -f deploy-service.yaml
Verification
Identify a MetalLB speaker pod by running the following command:
$ oc get -n metallb-system pods -l component=speakerExample output
NAME READY STATUS RESTARTS AGE speaker-c6c5f 6/6 Running 0 69mVerify that the state of the BGP session is
Establishedin the speaker pod by running the following command, replacing the variables to match your configuration:$ oc exec -n metallb-system <speaker_pod> -c frr -- vtysh -c "show bgp vrf <vrf_name> neigh"Example output
BGP neighbor is 192.168.30.1, remote AS 200, local AS 100, external link BGP version 4, remote router ID 192.168.30.1, local router ID 192.168.30.71 BGP state = Established, up for 04:20:09 ...Verify that the service is advertised correctly by running the following command:
$ oc exec -n metallb-system <speaker_pod> -c frr -- vtysh -c "show bgp vrf <vrf_name> ipv4"
27.3.5. Example BGP peer configurations
27.3.5.1. Example: Limit which nodes connect to a BGP peer
You can specify the node selectors field to control which nodes can connect to a BGP peer.
apiVersion: metallb.io/v1beta2
kind: BGPPeer
metadata:
name: doc-example-nodesel
namespace: metallb-system
spec:
peerAddress: 10.0.20.1
peerASN: 64501
myASN: 64500
nodeSelectors:
- matchExpressions:
- key: kubernetes.io/hostname
operator: In
values: [compute-1.example.com, compute-2.example.com]27.3.5.2. Example: Specify a BFD profile for a BGP peer
You can specify a BFD profile to associate with BGP peers. BFD compliments BGP by providing more rapid detection of communication failures between peers than BGP alone.
apiVersion: metallb.io/v1beta2
kind: BGPPeer
metadata:
name: doc-example-peer-bfd
namespace: metallb-system
spec:
peerAddress: 10.0.20.1
peerASN: 64501
myASN: 64500
holdTime: "10s"
bfdProfile: doc-example-bfd-profile-full
Deleting the bidirectional forwarding detection (BFD) profile and removing the bfdProfile added to the border gateway protocol (BGP) peer resource does not disable the BFD. Instead, the BGP peer starts using the default BFD profile. To disable BFD from a BGP peer resource, delete the BGP peer configuration and recreate it without a BFD profile. For more information, see BZ#2050824.
27.3.5.3. Example: Specify BGP peers for dual-stack networking
To support dual-stack networking, add one BGP peer custom resource for IPv4 and one BGP peer custom resource for IPv6.
apiVersion: metallb.io/v1beta2
kind: BGPPeer
metadata:
name: doc-example-dual-stack-ipv4
namespace: metallb-system
spec:
peerAddress: 10.0.20.1
peerASN: 64500
myASN: 64500
---
apiVersion: metallb.io/v1beta2
kind: BGPPeer
metadata:
name: doc-example-dual-stack-ipv6
namespace: metallb-system
spec:
peerAddress: 2620:52:0:88::104
peerASN: 64500
myASN: 6450027.3.6. Next steps
27.4. Configuring community alias
As a cluster administrator, you can configure a community alias and use it across different advertisements.
27.4.1. About the community custom resource
The community custom resource is a collection of aliases for communities. Users can define named aliases to be used when advertising ipAddressPools using the BGPAdvertisement. The fields for the community custom resource are described in the following table.
The community CRD applies only to BGPAdvertisement.
| Field | Type | Description |
|---|---|---|
|
|
|
Specifies the name for the |
|
|
|
Specifies the namespace for the |
|
|
|
Specifies a list of BGP community aliases that can be used in BGPAdvertisements. A community alias consists of a pair of name (alias) and value (number:number). Link the BGPAdvertisement to a community alias by referring to the alias name in its |
| Field | Type | Description |
|---|---|---|
|
|
|
The name of the alias for the |
|
|
|
The BGP |
27.4.2. Configuring MetalLB with a BGP advertisement and community alias
Configure MetalLB as follows so that the IPAddressPool is advertised with the BGP protocol and the community alias set to the numeric value of the NO_ADVERTISE community.
In the following example, the peer BGP router doc-example-peer-community receives one 203.0.113.200/32 route and one fc00:f853:ccd:e799::1/128 route for each load-balancer IP address that MetalLB assigns to a service. A community alias is configured with the NO_ADVERTISE community.
Prerequisites
-
Install the OpenShift CLI (
oc). -
Log in as a user with
cluster-adminprivileges.
Procedure
Create an IP address pool.
Create a file, such as
ipaddresspool.yaml, with content like the following example:apiVersion: metallb.io/v1beta1 kind: IPAddressPool metadata: namespace: metallb-system name: doc-example-bgp-community spec: addresses: - 203.0.113.200/30 - fc00:f853:ccd:e799::/124Apply the configuration for the IP address pool:
$ oc apply -f ipaddresspool.yaml
Create a community alias named
community1.apiVersion: metallb.io/v1beta1 kind: Community metadata: name: community1 namespace: metallb-system spec: communities: - name: NO_ADVERTISE value: '65535:65282'Create a BGP peer named
doc-example-bgp-peer.Create a file, such as
bgppeer.yaml, with content like the following example:apiVersion: metallb.io/v1beta2 kind: BGPPeer metadata: namespace: metallb-system name: doc-example-bgp-peer spec: peerAddress: 10.0.0.1 peerASN: 64501 myASN: 64500 routerID: 10.10.10.10Apply the configuration for the BGP peer:
$ oc apply -f bgppeer.yaml
Create a BGP advertisement with the community alias.
Create a file, such as
bgpadvertisement.yaml, with content like the following example:apiVersion: metallb.io/v1beta1 kind: BGPAdvertisement metadata: name: bgp-community-sample namespace: metallb-system spec: aggregationLength: 32 aggregationLengthV6: 128 communities: - NO_ADVERTISE1 ipAddressPools: - doc-example-bgp-community peers: - doc-example-peer- 1
- Specify the
CommunityAlias.namehere and not the community custom resource (CR) name.
Apply the configuration:
$ oc apply -f bgpadvertisement.yaml
27.5. Configuring MetalLB BFD profiles
As a cluster administrator, you can add, modify, and delete Bidirectional Forwarding Detection (BFD) profiles. The MetalLB Operator uses the BFD profile custom resources to identify which BGP sessions use BFD to provide faster path failure detection than BGP alone provides.
27.5.1. About the BFD profile custom resource
The fields for the BFD profile custom resource are described in the following table.
| Field | Type | Description |
|---|---|---|
|
|
| Specifies the name for the BFD profile custom resource. |
|
|
| Specifies the namespace for the BFD profile custom resource. |
|
|
| Specifies the detection multiplier to determine packet loss. The remote transmission interval is multiplied by this value to determine the connection loss detection timer.
For example, when the local system has the detect multiplier set to
The range is |
|
|
|
Specifies the echo transmission mode. If you are not using distributed BFD, echo transmission mode works only when the peer is also FRR. The default value is
When echo transmission mode is enabled, consider increasing the transmission interval of control packets to reduce bandwidth usage. For example, consider increasing the transmit interval to |
|
|
|
Specifies the minimum transmission interval, less jitter, that this system uses to send and receive echo packets. The range is |
|
|
| Specifies the minimum expected TTL for an incoming control packet. This field applies to multi-hop sessions only. The purpose of setting a minimum TTL is to make the packet validation requirements more stringent and avoid receiving control packets from other sessions.
The default value is |
|
|
| Specifies whether a session is marked as active or passive. A passive session does not attempt to start the connection. Instead, a passive session waits for control packets from a peer before it begins to reply. Marking a session as passive is useful when you have a router that acts as the central node of a star network and you want to avoid sending control packets that you do not need the system to send.
The default value is |
|
|
|
Specifies the minimum interval that this system is capable of receiving control packets. The range is |
|
|
|
Specifies the minimum transmission interval, less jitter, that this system uses to send control packets. The range is |
27.5.2. Configuring a BFD profile
As a cluster administrator, you can add a BFD profile and configure a BGP peer to use the profile. BFD provides faster path failure detection than BGP alone.
Prerequisites
-
Install the OpenShift CLI (
oc). -
Log in as a user with
cluster-adminprivileges.
Procedure
Create a file, such as
bfdprofile.yaml, with content like the following example:apiVersion: metallb.io/v1beta1 kind: BFDProfile metadata: name: doc-example-bfd-profile-full namespace: metallb-system spec: receiveInterval: 300 transmitInterval: 300 detectMultiplier: 3 echoMode: false passiveMode: true minimumTtl: 254Apply the configuration for the BFD profile:
$ oc apply -f bfdprofile.yaml
27.5.3. Next steps
- Configure a BGP peer to use the BFD profile.
27.6. Configuring services to use MetalLB
As a cluster administrator, when you add a service of type LoadBalancer, you can control how MetalLB assigns an IP address.
27.6.1. Request a specific IP address
Like some other load-balancer implementations, MetalLB accepts the spec.loadBalancerIP field in the service specification.
If the requested IP address is within a range from any address pool, MetalLB assigns the requested IP address. If the requested IP address is not within any range, MetalLB reports a warning.
Example service YAML for a specific IP address
apiVersion: v1
kind: Service
metadata:
name: <service_name>
annotations:
metallb.universe.tf/address-pool: <address_pool_name>
spec:
selector:
<label_key>: <label_value>
ports:
- port: 8080
targetPort: 8080
protocol: TCP
type: LoadBalancer
loadBalancerIP: <ip_address>
If MetalLB cannot assign the requested IP address, the EXTERNAL-IP for the service reports <pending> and running oc describe service <service_name> includes an event like the following example.
Example event when MetalLB cannot assign a requested IP address
...
Events:
Type Reason Age From Message
---- ------ ---- ---- -------
Warning AllocationFailed 3m16s metallb-controller Failed to allocate IP for "default/invalid-request": "4.3.2.1" is not allowed in config27.6.2. Request an IP address from a specific pool
To assign an IP address from a specific range, but you are not concerned with the specific IP address, then you can use the metallb.universe.tf/address-pool annotation to request an IP address from the specified address pool.
Example service YAML for an IP address from a specific pool
apiVersion: v1
kind: Service
metadata:
name: <service_name>
annotations:
metallb.universe.tf/address-pool: <address_pool_name>
spec:
selector:
<label_key>: <label_value>
ports:
- port: 8080
targetPort: 8080
protocol: TCP
type: LoadBalancer
If the address pool that you specify for <address_pool_name> does not exist, MetalLB attempts to assign an IP address from any pool that permits automatic assignment.
27.6.3. Accept any IP address
By default, address pools are configured to permit automatic assignment. MetalLB assigns an IP address from these address pools.
To accept any IP address from any pool that is configured for automatic assignment, no special annotation or configuration is required.
Example service YAML for accepting any IP address
apiVersion: v1
kind: Service
metadata:
name: <service_name>
spec:
selector:
<label_key>: <label_value>
ports:
- port: 8080
targetPort: 8080
protocol: TCP
type: LoadBalancer27.6.5. Configuring a service with MetalLB
You can configure a load-balancing service to use an external IP address from an address pool.
Prerequisites
-
Install the OpenShift CLI (
oc). - Install the MetalLB Operator and start MetalLB.
- Configure at least one address pool.
- Configure your network to route traffic from the clients to the host network for the cluster.
Procedure
Create a
<service_name>.yamlfile. In the file, ensure that thespec.typefield is set toLoadBalancer.Refer to the examples for information about how to request the external IP address that MetalLB assigns to the service.
Create the service:
$ oc apply -f <service_name>.yamlExample output
service/<service_name> created
Verification
Describe the service:
$ oc describe service <service_name>Example output
Name: <service_name> Namespace: default Labels: <none> Annotations: metallb.universe.tf/address-pool: doc-example1 Selector: app=service_name Type: LoadBalancer2 IP Family Policy: SingleStack IP Families: IPv4 IP: 10.105.237.254 IPs: 10.105.237.254 LoadBalancer Ingress: 192.168.100.53 Port: <unset> 80/TCP TargetPort: 8080/TCP NodePort: <unset> 30550/TCP Endpoints: 10.244.0.50:8080 Session Affinity: None External Traffic Policy: Cluster Events:4 Type Reason Age From Message ---- ------ ---- ---- ------- Normal nodeAssigned 32m (x2 over 32m) metallb-speaker announcing from node "<node_name>"- 1
- The annotation is present if you request an IP address from a specific pool.
- 2
- The service type must indicate
LoadBalancer. - 3
- The load-balancer ingress field indicates the external IP address if the service is assigned correctly.
- 4
- The events field indicates the node name that is assigned to announce the external IP address. If you experience an error, the events field indicates the reason for the error.
27.7. Managing symmetric routing with MetalLB
As a cluster administrator, you can effectively manage traffic for pods behind a MetalLB load-balancer service with multiple host interfaces by implementing features from MetalLB, NMState, and OVN-Kubernetes. By combining these features in this context, you can provide symmetric routing, traffic segregation, and support clients on different networks with overlapping CIDR addresses.
To achieve this functionality, learn how to implement virtual routing and forwarding (VRF) instances with MetalLB, and configure egress services.
Configuring symmetric traffic by using a VRF instance with MetalLB and an egress service is a Technology Preview feature only. Technology Preview features are not supported with Red Hat production service level agreements (SLAs) and might not be functionally complete. Red Hat does not recommend using them in production. These features provide early access to upcoming product features, enabling customers to test functionality and provide feedback during the development process.
For more information about the support scope of Red Hat Technology Preview features, see Technology Preview Features Support Scope.
27.7.1. Challenges of managing symmetric routing with MetalLB
When you use MetalLB with multiple host interfaces, MetalLB exposes and announces a service through all available interfaces on the host. This can present challenges relating to network isolation, asymmetric return traffic and overlapping CIDR addresses.
One option to ensure that return traffic reaches the correct client is to use static routes. However, with this solution, MetalLB cannot isolate the services and then announce each service through a different interface. Additionally, static routing requires manual configuration and requires maintenance if remote sites are added.
A further challenge of symmetric routing when implementing a MetalLB service is scenarios where external systems expect the source and destination IP address for an application to be the same. The default behavior for OpenShift Container Platform is to assign the IP address of the host network interface as the source IP address for traffic originating from pods. This is problematic with multiple host interfaces.
You can overcome these challenges by implementing a configuration that combines features from MetalLB, NMState, and OVN-Kubernetes.
27.7.2. Overview of managing symmetric routing by using VRFs with MetalLB
You can overcome the challenges of implementing symmetric routing by using NMState to configure a VRF instance on a host, associating the VRF instance with a MetalLB BGPPeer resource, and configuring an egress service for egress traffic with OVN-Kubernetes.
Figure 27.1. Network overview of managing symmetric routing by using VRFs with MetalLB
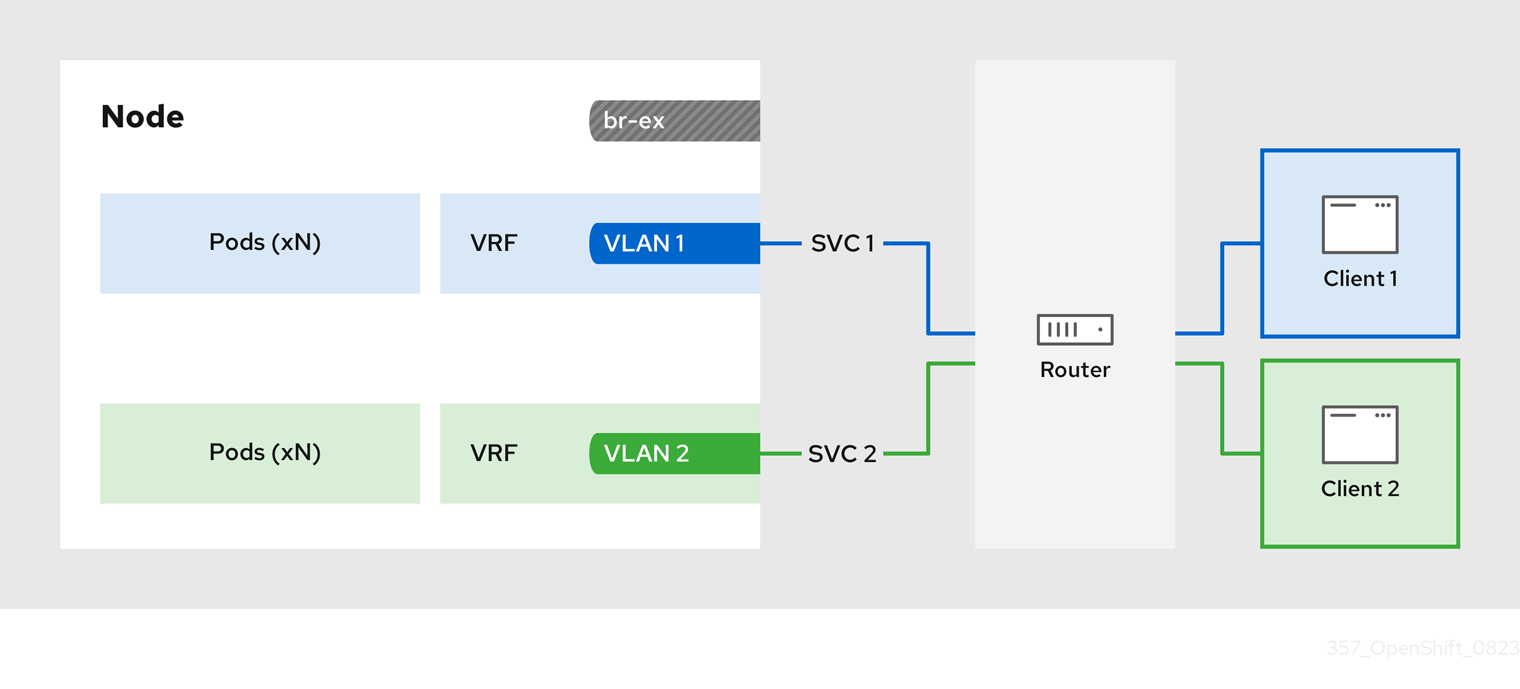
The configuration process involves three stages:
1. Define a VRF and routing rules
-
Configure a
NodeNetworkConfigurationPolicycustom resource (CR) to associate a VRF instance with a network interface. - Use the VRF routing table to direct ingress and egress traffic.
2. Link the VRF to a MetalLB BGPPeer
-
Configure a MetalLB
BGPPeerresource to use the VRF instance on a network interface. -
By associating the
BGPPeerresource with the VRF instance, the designated network interface becomes the primary interface for the BGP session, and MetalLB advertises the services through this interface.
3. Configure an egress service
- Configure an egress service to choose the network associated with the VRF instance for egress traffic.
- Optional: Configure an egress service to use the IP address of the MetalLB load-balancer service as the source IP for egress traffic.
27.7.3. Configuring symmetric routing by using VRFs with MetalLB
You can configure symmetric network routing for applications behind a MetalLB service that require the same ingress and egress network paths.
This example associates a VRF routing table with MetalLB and an egress service to enable symmetric routing for ingress and egress traffic for pods behind a LoadBalancer service.
-
If you use the
sourceIPBy: "LoadBalancerIP"setting in theEgressServiceCR, you must specify the load-balancer node in theBGPAdvertisementcustom resource (CR). -
You can use the
sourceIPBy: "Network"setting on clusters that use OVN-Kubernetes configured with thegatewayConfig.routingViaHostspecification set totrueonly. Additionally, if you use thesourceIPBy: "Network"setting, you must schedule the application workload on nodes configured with the network VRF instance.
Prerequisites
-
Install the OpenShift CLI (
oc). -
Log in as a user with
cluster-adminprivileges. - Install the Kubernetes NMState Operator.
- Install the MetalLB Operator.
Procedure
Create a
NodeNetworkConfigurationPolicyCR to define the VRF instance:Create a file, such as
node-network-vrf.yaml, with content like the following example:apiVersion: nmstate.io/v1 kind: NodeNetworkConfigurationPolicy metadata: name: vrfpolicy1 spec: nodeSelector: vrf: "true"2 maxUnavailable: 3 desiredState: interfaces: - name: ens4vrf3 type: vrf4 state: up vrf: port: - ens45 route-table-id: 26 - name: ens47 type: ethernet state: up ipv4: address: - ip: 192.168.130.130 prefix-length: 24 dhcp: false enabled: true routes:8 config: - destination: 0.0.0.0/0 metric: 150 next-hop-address: 192.168.130.1 next-hop-interface: ens4 table-id: 2 route-rules:9 config: - ip-to: 172.30.0.0/16 priority: 998 route-table: 25410 - ip-to: 10.132.0.0/14 priority: 998 route-table: 254 - ip-to: 169.254.169.0/29 priority: 998 route-table: 254- 1
- The name of the policy.
- 2
- This example applies the policy to all nodes with the label
vrf:true. - 3
- The name of the interface.
- 4
- The type of interface. This example creates a VRF instance.
- 5
- The node interface that the VRF attaches to.
- 6
- The name of the route table ID for the VRF.
- 7
- The IPv4 address of the interface associated with the VRF.
- 8
- Defines the configuration for network routes. The
next-hop-addressfield defines the IP address of the next hop for the route. Thenext-hop-interfacefield defines the outgoing interface for the route. In this example, the VRF routing table is2, which references the ID that you define in theEgressServiceCR. - 9
- Defines additional route rules. The
ip-tofields must match theCluster NetworkCIDR,Service NetworkCIDR, andInternal Masqueradesubnet CIDR. You can view the values for these CIDR address specifications by running the following command:oc describe network.operator/cluster. - 10
- The main routing table that the Linux kernel uses when calculating routes has the ID
254.
Apply the policy by running the following command:
$ oc apply -f node-network-vrf.yaml
Create a
BGPPeercustom resource (CR):Create a file, such as
frr-via-vrf.yaml, with content like the following example:apiVersion: metallb.io/v1beta2 kind: BGPPeer metadata: name: frrviavrf namespace: metallb-system spec: myASN: 100 peerASN: 200 peerAddress: 192.168.130.1 vrf: ens4vrf1 - 1
- Specifies the VRF instance to associate with the BGP peer. MetalLB can advertise services and make routing decisions based on the routing information in the VRF.
Apply the configuration for the BGP peer by running the following command:
$ oc apply -f frr-via-vrf.yaml
Create an
IPAddressPoolCR:Create a file, such as
first-pool.yaml, with content like the following example:apiVersion: metallb.io/v1beta1 kind: IPAddressPool metadata: name: first-pool namespace: metallb-system spec: addresses: - 192.169.10.0/32Apply the configuration for the IP address pool by running the following command:
$ oc apply -f first-pool.yaml
Create a
BGPAdvertisementCR:Create a file, such as
first-adv.yaml, with content like the following example:apiVersion: metallb.io/v1beta1 kind: BGPAdvertisement metadata: name: first-adv namespace: metallb-system spec: ipAddressPools: - first-pool peers: - frrviavrf1 nodeSelectors: - matchLabels: egress-service.k8s.ovn.org/test-server1: ""2 - 1
- In this example, MetalLB advertises a range of IP addresses from the
first-poolIP address pool to thefrrviavrfBGP peer. - 2
- In this example, the
EgressServiceCR configures the source IP address for egress traffic to use the load-balancer service IP address. Therefore, you must specify the load-balancer node for return traffic to use the same return path for the traffic originating from the pod.
Apply the configuration for the BGP advertisement by running the following command:
$ oc apply -f first-adv.yaml
Create an
EgressServiceCR:Create a file, such as
egress-service.yaml, with content like the following example:apiVersion: k8s.ovn.org/v1 kind: EgressService metadata: name: server11 namespace: test2 spec: sourceIPBy: "LoadBalancerIP"3 nodeSelector: matchLabels: vrf: "true"4 network: "2"5 - 1
- Specify the name for the egress service. The name of the
EgressServiceresource must match the name of the load-balancer service that you want to modify. - 2
- Specify the namespace for the egress service. The namespace for the
EgressServicemust match the namespace of the load-balancer service that you want to modify. The egress service is namespace-scoped. - 3
- This example assigns the
LoadBalancerservice ingress IP address as the source IP address for egress traffic. - 4
- If you specify
LoadBalancerfor thesourceIPByspecification, a single node handles theLoadBalancerservice traffic. In this example, only a node with the labelvrf: "true"can handle the service traffic. If you do not specify a node, OVN-Kubernetes selects a worker node to handle the service traffic. When a node is selected, OVN-Kubernetes labels the node in the following format:egress-service.k8s.ovn.org/<svc_namespace>-<svc_name>: "". - 5
- Specify the routing table ID for egress traffic. Ensure that the value matches the
route-table-idID defined in theNodeNetworkConfigurationPolicyresource, for example,route-table-id: 2.
Apply the configuration for the egress service by running the following command:
$ oc apply -f egress-service.yaml
Verification
Verify that you can access the application endpoint of the pods running behind the MetalLB service by running the following command:
$ curl <external_ip_address>:<port_number>1 - 1
- Update the external IP address and port number to suit your application endpoint.
-
Optional: If you assigned the
LoadBalancerservice ingress IP address as the source IP address for egress traffic, verify this configuration by using tools such astcpdumpto analyze packets received at the external client.
27.8. Configuring the integration of MetalLB and FRR-K8s
The FRRConfiguration custom resource is a Technology Preview feature only. Technology Preview features are not supported with Red Hat production service level agreements (SLAs) and might not be functionally complete. Red Hat does not recommend using them in production. These features provide early access to upcoming product features, enabling customers to test functionality and provide feedback during the development process.
For more information about the support scope of Red Hat Technology Preview features, see Technology Preview Features Support Scope.
FRRouting (FRR) is a free, open source internet routing protocol suite for Linux and UNIX platforms. FRR-K8s is a Kubernetes based DaemonSet that exposes a subset of the FRR API in a Kubernetes-compliant manner. As a cluster administrator, you can use the FRRConfiguration custom resource (CR) to configure MetalLB to use FRR-K8s as the backend. You can use this to avail of FRR services, for example, receiving routes. If you run MetalLB with FRR-K8s as a backend, MetalLB generates the FRR-K8s configuration corresponding to the MetalLB configuration applied.

27.8.1. Activating the integration of MetalLB and FRR-K8s
The following procedure shows you how to activate FRR-K8s as the backend for MetalLB.
Prerequisites
- You have a cluster installed on bare-metal hardware.
-
You have installed the OpenShift CLI (
oc). -
You have logged in as a user with
cluster-adminprivileges.
Procedure
Set the
bgpBackendfield of theMetalLBCR tofrr-k8sas in the following example:apiVersion: metallb.io/v1beta1 kind: MetalLB metadata: name: metallb namespace: metallb-system spec: bgpBackend: frr-k8s
27.8.2. FRR configurations
You can create multiple FRRConfiguration CRs to use FRR services in MetalLB. MetalLB generates an FRRConfiguration object which FRR-K8s merges with all other configurations that all users have created.
MetalLB generates an FRRConfiguration object which FRR-K8s merges with all other configurations that all users have created. For example, you can configure FRR-K8s to receive all of the prefixes advertised by a given neighbor. The following example configures FRR-K8s to receive all of the prefixes advertised by a BGPPeer with host 172.18.0.5:
Example FRRConfiguration CR
apiVersion: frrk8s.metallb.io/v1beta1
kind: FRRConfiguration
metadata:
name: test
namespace: metallb-system
spec:
bgp:
routers:
- asn: 64512
neighbors:
- address: 172.18.0.5
asn: 64512
toReceive:
allowed:
mode: all
You can also configure FRR-K8s to always block a set of prefixes, regardless of the configuration applied. This is useful to prevent routes to pod or ClusterIPs CIDRs that might cause cluster malfunctions. For example, you might block the clusterNetwork and serviceNetwork CIDRs. Run oc describe network.config/cluster to find these values.
The following example blocks the prefix 192.168.1.0/24:
Example MetalLB CR
apiVersion: metallb.io/v1beta1
kind: MetalLB
metadata:
name: metallb
namespace: metallb-system
spec:
frrk8sConfig:
alwaysBlock:
- 192.168.1.0/2427.8.3. Configuring the FRRConfiguration CRD
The following section provides reference examples that use the FRRConfiguration custom resource (CR).
27.8.3.1. The routers field
You can use the routers field to configure multiple routers, one for each Virtual Routing and Forwarding (VRF) resource. For each router, you must define the Autonomous System Number (ASN).
You can also define a list of Border Gateway Protocol (BGP) neighbors to connect to, as in the following example:
Example FRRConfiguration CR
apiVersion: frrk8s.metallb.io/v1beta1
kind: FRRConfiguration
metadata:
name: test
namespace: frr-k8s-system
spec:
bgp:
routers:
- asn: 64512
neighbors:
- address: 172.30.0.3
asn: 4200000000
ebgpMultiHop: true
port: 180
- address: 172.18.0.6
asn: 4200000000
port: 17927.8.3.2. The toAdvertise field
By default, FRR-K8s does not advertise the prefixes configured as part of a router configuration. In order to advertise them, you use the toAdvertise field.
You can advertise a subset of the prefixes, as in the following example:
Example FRRConfiguration CR
apiVersion: frrk8s.metallb.io/v1beta1
kind: FRRConfiguration
metadata:
name: test
namespace: frr-k8s-system
spec:
bgp:
routers:
- asn: 64512
neighbors:
- address: 172.30.0.3
asn: 4200000000
ebgpMultiHop: true
port: 180
toAdvertise:
allowed:
prefixes:
- 192.168.2.0/24
prefixes:
- 192.168.2.0/24
- 192.169.2.0/24- 1
- Advertises a subset of prefixes.
The following example shows you how to advertise all of the prefixes:
Example FRRConfiguration CR
apiVersion: frrk8s.metallb.io/v1beta1
kind: FRRConfiguration
metadata:
name: test
namespace: frr-k8s-system
spec:
bgp:
routers:
- asn: 64512
neighbors:
- address: 172.30.0.3
asn: 4200000000
ebgpMultiHop: true
port: 180
toAdvertise:
allowed:
mode: all
prefixes:
- 192.168.2.0/24
- 192.169.2.0/24- 1
- Advertises all prefixes.
27.8.3.3. The toReceive field
By default, FRR-K8s does not process any prefixes advertised by a neighbor. You can use the toReceive field to process such addresses.
You can configure for a subset of the prefixes, as in this example:
Example FRRConfiguration CR
apiVersion: frrk8s.metallb.io/v1beta1
kind: FRRConfiguration
metadata:
name: test
namespace: frr-k8s-system
spec:
bgp:
routers:
- asn: 64512
neighbors:
- address: 172.18.0.5
asn: 64512
port: 179
toReceive:
allowed:
prefixes:
- prefix: 192.168.1.0/24
- prefix: 192.169.2.0/24
ge: 25
le: 28 The following example configures FRR to handle all the prefixes announced:
Example FRRConfiguration CR
apiVersion: frrk8s.metallb.io/v1beta1
kind: FRRConfiguration
metadata:
name: test
namespace: frr-k8s-system
spec:
bgp:
routers:
- asn: 64512
neighbors:
- address: 172.18.0.5
asn: 64512
port: 179
toReceive:
allowed:
mode: all27.8.3.4. The bgp field
You can use the bgp field to define various BFD profiles and associate them with a neighbor. In the following example, BFD backs up the BGP session and FRR can detect link failures:
Example FRRConfiguration CR
apiVersion: frrk8s.metallb.io/v1beta1
kind: FRRConfiguration
metadata:
name: test
namespace: frr-k8s-system
spec:
bgp:
routers:
- asn: 64512
neighbors:
- address: 172.30.0.3
asn: 64512
port: 180
bfdProfile: defaultprofile
bfdProfiles:
- name: defaultprofile27.8.3.5. The nodeSelector field
By default, FRR-K8s applies the configuration to all nodes where the daemon is running. You can use the nodeSelector field to specify the nodes to which you want to apply the configuration. For example:
Example FRRConfiguration CR
apiVersion: frrk8s.metallb.io/v1beta1
kind: FRRConfiguration
metadata:
name: test
namespace: frr-k8s-system
spec:
bgp:
routers:
- asn: 64512
nodeSelector:
labelSelector:
foo: "bar"
The fields for the FRRConfiguration custom resource are described in the following table:
| Field | Type | Description |
|---|---|---|
|
|
| Specifies the routers that FRR is to configure (one per VRF). |
|
|
| The Autonomous System Number (ASN) to use for the local end of the session. |
|
|
|
Specifies the ID of the |
|
|
| Specifies the host vrf used to establish sessions from this router. |
|
|
| Specifies the neighbors to establish BGP sessions with. |
|
|
| Specifies the ASN to use for the remote end of the session. |
|
|
| Specifies the IP address to establish the session with. |
|
|
| Specifies the port to dial when establishing the session. Defaults to 179. |
|
|
|
Specifies the password to use for establishing the BGP session. |
|
|
|
Specifies the name of the authentication secret for the neighbor. The secret must be of type "kubernetes.io/basic-auth", and in the same namespace as the FRR-K8s daemon. The key "password" stores the password in the secret. |
|
|
| Specifies the requested BGP hold time, per RFC4271. Defaults to 180s. |
|
|
|
Specifies the requested BGP keepalive time, per RFC4271. Defaults to |
|
|
| Specifies how long BGP waits between connection attempts to a neighbor. |
|
|
| Indicates if the BGPPeer is multi-hops away. |
|
|
| Specifies the name of the BFD Profile to use for the BFD session associated with the BGP session. If not set, the BFD session is not set up. |
|
|
| Represents the list of prefixes to advertise to a neighbor, and the associated properties. |
|
|
| Specifies the list of prefixes to advertise to a neighbor. This list must match the prefixes that you define in the router. |
|
|
|
Specifies the mode to use when handling the prefixes. You can set to |
|
|
| Specifies the prefixes associated with an advertised local preference. You must specify the prefixes associated with a local preference in the prefixes allowed to be advertised. |
|
|
| Specifies the prefixes associated with the local preference. |
|
|
| Specifies the local preference associated with the prefixes. |
|
|
| Specifies the prefixes associated with an advertised BGP community. You must include the prefixes associated with a local preference in the list of prefixes that you want to advertise. |
|
|
| Specifies the prefixes associated with the community. |
|
|
| Specifies the community associated with the prefixes. |
|
|
| Specifies the prefixes to receive from a neighbor. |
|
|
| Specifies the information that you want to receive from a neighbor. |
|
|
| Specifies the prefixes allowed from a neighbor. |
|
|
|
Specifies the mode to use when handling the prefixes. When set to |
|
|
| Disables MP BGP to prevent it from separating IPv4 and IPv6 route exchanges into distinct BGP sessions. |
|
|
| Specifies all prefixes to advertise from this router instance. |
|
|
| Specifies the list of bfd profiles to use when configuring the neighbors. |
|
|
| The name of the BFD Profile to be referenced in other parts of the configuration. |
|
|
|
Specifies the minimum interval at which this system can receive control packets, in milliseconds. Defaults to |
|
|
|
Specifies the minimum transmission interval, excluding jitter, that this system wants to use to send BFD control packets, in milliseconds. Defaults to |
|
|
| Configures the detection multiplier to determine packet loss. To determine the connection loss-detection timer, multiply the remote transmission interval by this value. |
|
|
|
Configures the minimal echo receive transmission-interval that this system can handle, in milliseconds. Defaults to |
|
|
| Enables or disables the echo transmission mode. This mode is disabled by default, and not supported on multihop setups. |
|
|
| Mark session as passive. A passive session does not attempt to start the connection and waits for control packets from peers before it begins replying. |
|
|
| For multihop sessions only. Configures the minimum expected TTL for an incoming BFD control packet. |
|
|
| Limits the nodes that attempt to apply this configuration. If specified, only those nodes whose labels match the specified selectors attempt to apply the configuration. If it is not specified, all nodes attempt to apply this configuration. |
|
|
| Defines the observed state of FRRConfiguration. |
27.8.4. How FRR-K8s merges multiple configurations
In a case where multiple users add configurations that select the same node, FRR-K8s merges the configurations. Each configuration can only extend others. This means that it is possible to add a new neighbor to a router, or to advertise an additional prefix to a neighbor, but not possible to remove a component added by another configuration.
27.8.4.1. Configuration conflicts
Certain configurations can cause conflicts, leading to errors, for example:
- different ASN for the same router (in the same VRF)
- different ASN for the same neighbor (with the same IP / port)
- multiple BFD profiles with the same name but different values
When the daemon finds an invalid configuration for a node, it reports the configuration as invalid and reverts to the previous valid FRR configuration.
27.8.4.2. Merging
When merging, you can complete the following actions:
- Extend the set of IPs that you want to advertise to a neighbor.
- Add an extra neighbor with its set of IPs.
- Extend the set of IPs to which you want to associate a community.
- Allow incoming routes for a neighbor.
Each configuration must be self contained. This means, for example, that it is not possible to allow prefixes that are not defined in the router section by leveraging prefixes coming from another configuration.
If the configurations to be applied are compatible, merging works as follows:
-
FRR-K8scombines all the routers. -
FRR-K8smerges all prefixes and neighbors for each router. -
FRR-K8smerges all filters for each neighbor.
A less restrictive filter has precedence over a stricter one. For example, a filter accepting some prefixes has precedence over a filter not accepting any, and a filter accepting all prefixes has precedence over one that accepts some.
27.9. MetalLB logging, troubleshooting, and support
If you need to troubleshoot MetalLB configuration, see the following sections for commonly used commands.
27.9.1. Setting the MetalLB logging levels
MetalLB uses FRRouting (FRR) in a container with the default setting of info generates a lot of logging. You can control the verbosity of the logs generated by setting the logLevel as illustrated in this example.
Gain a deeper insight into MetalLB by setting the logLevel to debug as follows:
Prerequisites
-
You have access to the cluster as a user with the
cluster-adminrole. -
You have installed the OpenShift CLI (
oc).
Procedure
Create a file, such as
setdebugloglevel.yaml, with content like the following example:apiVersion: metallb.io/v1beta1 kind: MetalLB metadata: name: metallb namespace: metallb-system spec: logLevel: debug nodeSelector: node-role.kubernetes.io/worker: ""NoteWhile other fields like
speakerConfigcan be configured here, thebgpBackendfield must be omitted. It is reserved for internal use by MetalLB to manage the active BGP implementation.Apply the configuration:
$ oc replace -f setdebugloglevel.yamlNoteUse
oc replaceas the understanding is themetallbCR is already created and here you are changing the log level.Display the names of the
speakerpods:$ oc get -n metallb-system pods -l component=speakerExample output
NAME READY STATUS RESTARTS AGE speaker-2m9pm 4/4 Running 0 9m19s speaker-7m4qw 3/4 Running 0 19s speaker-szlmx 4/4 Running 0 9m19sNoteSpeaker and controller pods are recreated to ensure the updated logging level is applied. The logging level is modified for all the components of MetalLB.
View the
speakerlogs:$ oc logs -n metallb-system speaker-7m4qw -c speakerExample output
{"branch":"main","caller":"main.go:92","commit":"3d052535","goversion":"gc / go1.17.1 / amd64","level":"info","msg":"MetalLB speaker starting (commit 3d052535, branch main)","ts":"2022-05-17T09:55:05Z","version":""} {"caller":"announcer.go:110","event":"createARPResponder","interface":"ens4","level":"info","msg":"created ARP responder for interface","ts":"2022-05-17T09:55:05Z"} {"caller":"announcer.go:119","event":"createNDPResponder","interface":"ens4","level":"info","msg":"created NDP responder for interface","ts":"2022-05-17T09:55:05Z"} {"caller":"announcer.go:110","event":"createARPResponder","interface":"tun0","level":"info","msg":"created ARP responder for interface","ts":"2022-05-17T09:55:05Z"} {"caller":"announcer.go:119","event":"createNDPResponder","interface":"tun0","level":"info","msg":"created NDP responder for interface","ts":"2022-05-17T09:55:05Z"} I0517 09:55:06.515686 95 request.go:665] Waited for 1.026500832s due to client-side throttling, not priority and fairness, request: GET:https://172.30.0.1:443/apis/operators.coreos.com/v1alpha1?timeout=32s {"Starting Manager":"(MISSING)","caller":"k8s.go:389","level":"info","ts":"2022-05-17T09:55:08Z"} {"caller":"speakerlist.go:310","level":"info","msg":"node event - forcing sync","node addr":"10.0.128.4","node event":"NodeJoin","node name":"ci-ln-qb8t3mb-72292-7s7rh-worker-a-vvznj","ts":"2022-05-17T09:55:08Z"} {"caller":"service_controller.go:113","controller":"ServiceReconciler","enqueueing":"openshift-kube-controller-manager-operator/metrics","epslice":"{\"metadata\":{\"name\":\"metrics-xtsxr\",\"generateName\":\"metrics-\",\"namespace\":\"openshift-kube-controller-manager-operator\",\"uid\":\"ac6766d7-8504-492c-9d1e-4ae8897990ad\",\"resourceVersion\":\"9041\",\"generation\":4,\"creationTimestamp\":\"2022-05-17T07:16:53Z\",\"labels\":{\"app\":\"kube-controller-manager-operator\",\"endpointslice.kubernetes.io/managed-by\":\"endpointslice-controller.k8s.io\",\"kubernetes.io/service-name\":\"metrics\"},\"annotations\":{\"endpoints.kubernetes.io/last-change-trigger-time\":\"2022-05-17T07:21:34Z\"},\"ownerReferences\":[{\"apiVersion\":\"v1\",\"kind\":\"Service\",\"name\":\"metrics\",\"uid\":\"0518eed3-6152-42be-b566-0bd00a60faf8\",\"controller\":true,\"blockOwnerDeletion\":true}],\"managedFields\":[{\"manager\":\"kube-controller-manager\",\"operation\":\"Update\",\"apiVersion\":\"discovery.k8s.io/v1\",\"time\":\"2022-05-17T07:20:02Z\",\"fieldsType\":\"FieldsV1\",\"fieldsV1\":{\"f:addressType\":{},\"f:endpoints\":{},\"f:metadata\":{\"f:annotations\":{\".\":{},\"f:endpoints.kubernetes.io/last-change-trigger-time\":{}},\"f:generateName\":{},\"f:labels\":{\".\":{},\"f:app\":{},\"f:endpointslice.kubernetes.io/managed-by\":{},\"f:kubernetes.io/service-name\":{}},\"f:ownerReferences\":{\".\":{},\"k:{\\\"uid\\\":\\\"0518eed3-6152-42be-b566-0bd00a60faf8\\\"}\":{}}},\"f:ports\":{}}}]},\"addressType\":\"IPv4\",\"endpoints\":[{\"addresses\":[\"10.129.0.7\"],\"conditions\":{\"ready\":true,\"serving\":true,\"terminating\":false},\"targetRef\":{\"kind\":\"Pod\",\"namespace\":\"openshift-kube-controller-manager-operator\",\"name\":\"kube-controller-manager-operator-6b98b89ddd-8d4nf\",\"uid\":\"dd5139b8-e41c-4946-a31b-1a629314e844\",\"resourceVersion\":\"9038\"},\"nodeName\":\"ci-ln-qb8t3mb-72292-7s7rh-master-0\",\"zone\":\"us-central1-a\"}],\"ports\":[{\"name\":\"https\",\"protocol\":\"TCP\",\"port\":8443}]}","level":"debug","ts":"2022-05-17T09:55:08Z"}View the FRR logs:
$ oc logs -n metallb-system speaker-7m4qw -c frrExample output
Started watchfrr 2022/05/17 09:55:05 ZEBRA: client 16 says hello and bids fair to announce only bgp routes vrf=0 2022/05/17 09:55:05 ZEBRA: client 31 says hello and bids fair to announce only vnc routes vrf=0 2022/05/17 09:55:05 ZEBRA: client 38 says hello and bids fair to announce only static routes vrf=0 2022/05/17 09:55:05 ZEBRA: client 43 says hello and bids fair to announce only bfd routes vrf=0 2022/05/17 09:57:25.089 BGP: Creating Default VRF, AS 64500 2022/05/17 09:57:25.090 BGP: dup addr detect enable max_moves 5 time 180 freeze disable freeze_time 0 2022/05/17 09:57:25.090 BGP: bgp_get: Registering BGP instance (null) to zebra 2022/05/17 09:57:25.090 BGP: Registering VRF 0 2022/05/17 09:57:25.091 BGP: Rx Router Id update VRF 0 Id 10.131.0.1/32 2022/05/17 09:57:25.091 BGP: RID change : vrf VRF default(0), RTR ID 10.131.0.1 2022/05/17 09:57:25.091 BGP: Rx Intf add VRF 0 IF br0 2022/05/17 09:57:25.091 BGP: Rx Intf add VRF 0 IF ens4 2022/05/17 09:57:25.091 BGP: Rx Intf address add VRF 0 IF ens4 addr 10.0.128.4/32 2022/05/17 09:57:25.091 BGP: Rx Intf address add VRF 0 IF ens4 addr fe80::c9d:84da:4d86:5618/64 2022/05/17 09:57:25.091 BGP: Rx Intf add VRF 0 IF lo 2022/05/17 09:57:25.091 BGP: Rx Intf add VRF 0 IF ovs-system 2022/05/17 09:57:25.091 BGP: Rx Intf add VRF 0 IF tun0 2022/05/17 09:57:25.091 BGP: Rx Intf address add VRF 0 IF tun0 addr 10.131.0.1/23 2022/05/17 09:57:25.091 BGP: Rx Intf address add VRF 0 IF tun0 addr fe80::40f1:d1ff:feb6:5322/64 2022/05/17 09:57:25.091 BGP: Rx Intf add VRF 0 IF veth2da49fed 2022/05/17 09:57:25.091 BGP: Rx Intf address add VRF 0 IF veth2da49fed addr fe80::24bd:d1ff:fec1:d88/64 2022/05/17 09:57:25.091 BGP: Rx Intf add VRF 0 IF veth2fa08c8c 2022/05/17 09:57:25.091 BGP: Rx Intf address add VRF 0 IF veth2fa08c8c addr fe80::6870:ff:fe96:efc8/64 2022/05/17 09:57:25.091 BGP: Rx Intf add VRF 0 IF veth41e356b7 2022/05/17 09:57:25.091 BGP: Rx Intf address add VRF 0 IF veth41e356b7 addr fe80::48ff:37ff:fede:eb4b/64 2022/05/17 09:57:25.092 BGP: Rx Intf add VRF 0 IF veth1295c6e2 2022/05/17 09:57:25.092 BGP: Rx Intf address add VRF 0 IF veth1295c6e2 addr fe80::b827:a2ff:feed:637/64 2022/05/17 09:57:25.092 BGP: Rx Intf add VRF 0 IF veth9733c6dc 2022/05/17 09:57:25.092 BGP: Rx Intf address add VRF 0 IF veth9733c6dc addr fe80::3cf4:15ff:fe11:e541/64 2022/05/17 09:57:25.092 BGP: Rx Intf add VRF 0 IF veth336680ea 2022/05/17 09:57:25.092 BGP: Rx Intf address add VRF 0 IF veth336680ea addr fe80::94b1:8bff:fe7e:488c/64 2022/05/17 09:57:25.092 BGP: Rx Intf add VRF 0 IF vetha0a907b7 2022/05/17 09:57:25.092 BGP: Rx Intf address add VRF 0 IF vetha0a907b7 addr fe80::3855:a6ff:fe73:46c3/64 2022/05/17 09:57:25.092 BGP: Rx Intf add VRF 0 IF vethf35a4398 2022/05/17 09:57:25.092 BGP: Rx Intf address add VRF 0 IF vethf35a4398 addr fe80::40ef:2fff:fe57:4c4d/64 2022/05/17 09:57:25.092 BGP: Rx Intf add VRF 0 IF vethf831b7f4 2022/05/17 09:57:25.092 BGP: Rx Intf address add VRF 0 IF vethf831b7f4 addr fe80::f0d9:89ff:fe7c:1d32/64 2022/05/17 09:57:25.092 BGP: Rx Intf add VRF 0 IF vxlan_sys_4789 2022/05/17 09:57:25.092 BGP: Rx Intf address add VRF 0 IF vxlan_sys_4789 addr fe80::80c1:82ff:fe4b:f078/64 2022/05/17 09:57:26.094 BGP: 10.0.0.1 [FSM] Timer (start timer expire). 2022/05/17 09:57:26.094 BGP: 10.0.0.1 [FSM] BGP_Start (Idle->Connect), fd -1 2022/05/17 09:57:26.094 BGP: Allocated bnc 10.0.0.1/32(0)(VRF default) peer 0x7f807f7631a0 2022/05/17 09:57:26.094 BGP: sendmsg_zebra_rnh: sending cmd ZEBRA_NEXTHOP_REGISTER for 10.0.0.1/32 (vrf VRF default) 2022/05/17 09:57:26.094 BGP: 10.0.0.1 [FSM] Waiting for NHT 2022/05/17 09:57:26.094 BGP: bgp_fsm_change_status : vrf default(0), Status: Connect established_peers 0 2022/05/17 09:57:26.094 BGP: 10.0.0.1 went from Idle to Connect 2022/05/17 09:57:26.094 BGP: 10.0.0.1 [FSM] TCP_connection_open_failed (Connect->Active), fd -1 2022/05/17 09:57:26.094 BGP: bgp_fsm_change_status : vrf default(0), Status: Active established_peers 0 2022/05/17 09:57:26.094 BGP: 10.0.0.1 went from Connect to Active 2022/05/17 09:57:26.094 ZEBRA: rnh_register msg from client bgp: hdr->length=8, type=nexthop vrf=0 2022/05/17 09:57:26.094 ZEBRA: 0: Add RNH 10.0.0.1/32 type Nexthop 2022/05/17 09:57:26.094 ZEBRA: 0:10.0.0.1/32: Evaluate RNH, type Nexthop (force) 2022/05/17 09:57:26.094 ZEBRA: 0:10.0.0.1/32: NH has become unresolved 2022/05/17 09:57:26.094 ZEBRA: 0: Client bgp registers for RNH 10.0.0.1/32 type Nexthop 2022/05/17 09:57:26.094 BGP: VRF default(0): Rcvd NH update 10.0.0.1/32(0) - metric 0/0 #nhops 0/0 flags 0x6 2022/05/17 09:57:26.094 BGP: NH update for 10.0.0.1/32(0)(VRF default) - flags 0x6 chgflags 0x0 - evaluate paths 2022/05/17 09:57:26.094 BGP: evaluate_paths: Updating peer (10.0.0.1(VRF default)) status with NHT 2022/05/17 09:57:30.081 ZEBRA: Event driven route-map update triggered 2022/05/17 09:57:30.081 ZEBRA: Event handler for route-map: 10.0.0.1-out 2022/05/17 09:57:30.081 ZEBRA: Event handler for route-map: 10.0.0.1-in 2022/05/17 09:57:31.104 ZEBRA: netlink_parse_info: netlink-listen (NS 0) type RTM_NEWNEIGH(28), len=76, seq=0, pid=0 2022/05/17 09:57:31.104 ZEBRA: Neighbor Entry received is not on a VLAN or a BRIDGE, ignoring 2022/05/17 09:57:31.105 ZEBRA: netlink_parse_info: netlink-listen (NS 0) type RTM_NEWNEIGH(28), len=76, seq=0, pid=0 2022/05/17 09:57:31.105 ZEBRA: Neighbor Entry received is not on a VLAN or a BRIDGE, ignoring
27.9.1.1. FRRouting (FRR) log levels
The following table describes the FRR logging levels.
| Log level | Description |
|---|---|
|
| Supplies all logging information for all logging levels. |
|
|
Information that is diagnostically helpful to people. Set to |
|
| Provides information that always should be logged but under normal circumstances does not require user intervention. This is the default logging level. |
|
|
Anything that can potentially cause inconsistent |
|
|
Any error that is fatal to the functioning of |
|
| Turn off all logging. |
27.9.2. Troubleshooting BGP issues
The BGP implementation that Red Hat supports uses FRRouting (FRR) in a container in the speaker pods. As a cluster administrator, if you need to troubleshoot BGP configuration issues, you need to run commands in the FRR container.
Prerequisites
-
You have access to the cluster as a user with the
cluster-adminrole. -
You have installed the OpenShift CLI (
oc).
Procedure
Display the names of the
speakerpods:$ oc get -n metallb-system pods -l component=speakerExample output
NAME READY STATUS RESTARTS AGE speaker-66bth 4/4 Running 0 56m speaker-gvfnf 4/4 Running 0 56m ...Display the running configuration for FRR:
$ oc exec -n metallb-system speaker-66bth -c frr -- vtysh -c "show running-config"Example output
Building configuration... Current configuration: ! frr version 7.5.1_git frr defaults traditional hostname some-hostname log file /etc/frr/frr.log informational log timestamp precision 3 service integrated-vtysh-config ! router bgp 645001 bgp router-id 10.0.1.2 no bgp ebgp-requires-policy no bgp default ipv4-unicast no bgp network import-check neighbor 10.0.2.3 remote-as 645002 neighbor 10.0.2.3 bfd profile doc-example-bfd-profile-full3 neighbor 10.0.2.3 timers 5 15 neighbor 10.0.2.4 remote-as 64500 neighbor 10.0.2.4 bfd profile doc-example-bfd-profile-full neighbor 10.0.2.4 timers 5 15 ! address-family ipv4 unicast network 203.0.113.200/304 neighbor 10.0.2.3 activate neighbor 10.0.2.3 route-map 10.0.2.3-in in neighbor 10.0.2.4 activate neighbor 10.0.2.4 route-map 10.0.2.4-in in exit-address-family ! address-family ipv6 unicast network fc00:f853:ccd:e799::/124 neighbor 10.0.2.3 activate neighbor 10.0.2.3 route-map 10.0.2.3-in in neighbor 10.0.2.4 activate neighbor 10.0.2.4 route-map 10.0.2.4-in in exit-address-family ! route-map 10.0.2.3-in deny 20 ! route-map 10.0.2.4-in deny 20 ! ip nht resolve-via-default ! ipv6 nht resolve-via-default ! line vty ! bfd profile doc-example-bfd-profile-full transmit-interval 35 receive-interval 35 passive-mode echo-mode echo-interval 35 minimum-ttl 10 ! ! end- 1
- The
router bgpsection indicates the ASN for MetalLB. - 2
- Confirm that a
neighbor <ip-address> remote-as <peer-ASN>line exists for each BGP peer custom resource that you added. - 3
- If you configured BFD, confirm that the BFD profile is associated with the correct BGP peer and that the BFD profile appears in the command output.
- 4
- Confirm that the
network <ip-address-range>lines match the IP address ranges that you specified in address pool custom resources that you added.
Display the BGP summary:
$ oc exec -n metallb-system speaker-66bth -c frr -- vtysh -c "show bgp summary"Example output
IPv4 Unicast Summary: BGP router identifier 10.0.1.2, local AS number 64500 vrf-id 0 BGP table version 1 RIB entries 1, using 192 bytes of memory Peers 2, using 29 KiB of memory Neighbor V AS MsgRcvd MsgSent TblVer InQ OutQ Up/Down State/PfxRcd PfxSnt 10.0.2.3 4 64500 387 389 0 0 0 00:32:02 0 11 10.0.2.4 4 64500 0 0 0 0 0 never Active 02 Total number of neighbors 2 IPv6 Unicast Summary: BGP router identifier 10.0.1.2, local AS number 64500 vrf-id 0 BGP table version 1 RIB entries 1, using 192 bytes of memory Peers 2, using 29 KiB of memory Neighbor V AS MsgRcvd MsgSent TblVer InQ OutQ Up/Down State/PfxRcd PfxSnt 10.0.2.3 4 64500 387 389 0 0 0 00:32:02 NoNeg 10.0.2.4 4 64500 0 0 0 0 0 never Active 0 Total number of neighbors 2Display the BGP peers that received an address pool:
$ oc exec -n metallb-system speaker-66bth -c frr -- vtysh -c "show bgp ipv4 unicast 203.0.113.200/30"Replace
ipv4withipv6to display the BGP peers that received an IPv6 address pool. Replace203.0.113.200/30with an IPv4 or IPv6 IP address range from an address pool.Example output
BGP routing table entry for 203.0.113.200/30 Paths: (1 available, best #1, table default) Advertised to non peer-group peers: 10.0.2.31 Local 0.0.0.0 from 0.0.0.0 (10.0.1.2) Origin IGP, metric 0, weight 32768, valid, sourced, local, best (First path received) Last update: Mon Jan 10 19:49:07 2022- 1
- Confirm that the output includes an IP address for a BGP peer.
27.9.3. Troubleshooting BFD issues
The Bidirectional Forwarding Detection (BFD) implementation that Red Hat supports uses FRRouting (FRR) in a container in the speaker pods. The BFD implementation relies on BFD peers also being configured as BGP peers with an established BGP session. As a cluster administrator, if you need to troubleshoot BFD configuration issues, you need to run commands in the FRR container.
Prerequisites
-
You have access to the cluster as a user with the
cluster-adminrole. -
You have installed the OpenShift CLI (
oc).
Procedure
Display the names of the
speakerpods:$ oc get -n metallb-system pods -l component=speakerExample output
NAME READY STATUS RESTARTS AGE speaker-66bth 4/4 Running 0 26m speaker-gvfnf 4/4 Running 0 26m ...Display the BFD peers:
$ oc exec -n metallb-system speaker-66bth -c frr -- vtysh -c "show bfd peers brief"Example output
Session count: 2 SessionId LocalAddress PeerAddress Status ========= ============ =========== ====== 3909139637 10.0.1.2 10.0.2.3 up <.><.> Confirm that the
PeerAddresscolumn includes each BFD peer. If the output does not list a BFD peer IP address that you expected the output to include, troubleshoot BGP connectivity with the peer. If the status field indicatesdown, check for connectivity on the links and equipment between the node and the peer. You can determine the node name for the speaker pod with a command likeoc get pods -n metallb-system speaker-66bth -o jsonpath='{.spec.nodeName}'.
27.9.4. MetalLB metrics for BGP and BFD
OpenShift Container Platform captures the following Prometheus metrics for MetalLB that relate to BGP peers and BFD profiles.
| Name | Description |
|---|---|
|
| Counts the number of BFD control packets received from each BFD peer. |
|
| Counts the number of BFD control packets sent to each BFD peer. |
|
| Counts the number of BFD echo packets received from each BFD peer. |
|
| Counts the number of BFD echo packets sent to each BFD. |
|
|
Counts the number of times the BFD session with a peer entered the |
|
|
Indicates the connection state with a BFD peer. |
|
|
Counts the number of times the BFD session with a peer entered the |
|
| Counts the number of BFD Zebra notifications for each BFD peer. |
| Name | Description |
|---|---|
|
| Counts the number of load balancer IP address prefixes that are advertised to BGP peers. The terms prefix and aggregated route have the same meaning. |
|
|
Indicates the connection state with a BGP peer. |
|
| Counts the number of BGP update messages sent to each BGP peer. |
|
| Counts the number of BGP open messages sent to each BGP peer. |
|
| Counts the number of BGP open messages received from each BGP peer. |
|
| Counts the number of BGP notification messages sent to each BGP peer. |
|
| Counts the number of BGP update messages received from each BGP peer. |
|
| Counts the number of BGP keepalive messages sent to each BGP peer. |
|
| Counts the number of BGP keepalive messages received from each BGP peer. |
|
| Counts the number of BGP route refresh messages sent to each BGP peer. |
|
| Counts the number of total BGP messages sent to each BGP peer. |
|
| Counts the number of total BGP messages received from each BGP peer. |
Additional resources
- See Querying metrics for all projects with the monitoring dashboard for information about using the monitoring dashboard.
27.9.5. About collecting MetalLB data
You can use the oc adm must-gather CLI command to collect information about your cluster, your MetalLB configuration, and the MetalLB Operator. The following features and objects are associated with MetalLB and the MetalLB Operator:
- The namespace and child objects that the MetalLB Operator is deployed in
- All MetalLB Operator custom resource definitions (CRDs)
The oc adm must-gather CLI command collects the following information from FRRouting (FRR) that Red Hat uses to implement BGP and BFD:
-
/etc/frr/frr.conf -
/etc/frr/frr.log -
/etc/frr/daemonsconfiguration file -
/etc/frr/vtysh.conf
The log and configuration files in the preceding list are collected from the frr container in each speaker pod.
In addition to the log and configuration files, the oc adm must-gather CLI command collects the output from the following vtysh commands:
-
show running-config -
show bgp ipv4 -
show bgp ipv6 -
show bgp neighbor -
show bfd peer
No additional configuration is required when you run the oc adm must-gather CLI command.
Additional resources
Chapter 28. Associating secondary interfaces metrics to network attachments
To gain better visibility into cluster traffic, you can associate secondary interface metrics with specific network attachments. By using the pod_network_info metric to label interfaces based on their NetworkAttachmentDefinition resource, you can more easily monitor performance and troubleshoot connectivity issues across your network.
28.1. Extending secondary network metrics for monitoring
To monitor and manage network traffic effectively, you can extend secondary network metrics with identifying information. By using the pod_network_name_info metric to label interfaces based on their NetworkAttachmentDefinition resource, you can classify interface types to enable precise metric aggregation and alerting.
Secondary devices, or interfaces, are used for different purposes. Metrics from secondary network interfaces need to be classified to allow for effective aggregation and monitoring.
Exposed metrics contain the interface but do not specify where the interface originates. This is workable when there are no additional interfaces. However, relying on interface names alone becomes problematic when secondary interfaces are added because it is difficult to identify their purpose and use their metrics effectively..
When adding secondary interfaces, their names depend on the order in which they are added. Secondary interfaces can belong to distinct networks that can each serve a different purposes.
With pod_network_name_info it is possible to extend the current metrics with additional information that identifies the interface type. In this way, it is possible to aggregate the metrics and to add specific alarms to specific interface types.
The network type is generated from the name of the NetworkAttachmentDefinition resource, which distinguishes different secondary network classes. For example, different interfaces belonging to different networks or using different CNIs use different network attachment definition names.
28.2. Network Metrics Daemon
The Network Metrics Daemon collects and publishes network-related metrics to support performance management in complex pod environments. This component provides metadata for secondary interfaces, which is required for accurate traffic monitoring across distinct network attachments.
The kubelet is already publishing network related metrics you can observe. These metrics are:
-
container_network_receive_bytes_total -
container_network_receive_errors_total -
container_network_receive_packets_total -
container_network_receive_packets_dropped_total -
container_network_transmit_bytes_total -
container_network_transmit_errors_total -
container_network_transmit_packets_total -
container_network_transmit_packets_dropped_total
The labels in these metrics contain, among others:
- Pod name
- Pod namespace
-
Interface name (such as
eth0)
These metrics work well until new interfaces are added to the pod, for example via Multus, as it is not clear what the interface names refer to.
The interface label refers to the interface name, but it is not clear what that interface is meant for. In case of many different interfaces, it would be impossible to understand what network the metrics you are monitoring refer to.
This is addressed by introducing the new pod_network_name_info described in the following section.
28.3. Metrics with network name
To simplify the monitoring of secondary networks, you can use the pod_network_name_info metric to correlate network performance data with specific network names. By joining this metric with container network metrics, you can identify traffic patterns and errors across distinct network attachment definitions.
Example of pod_network_name_info
pod_network_name_info{interface="net0",namespace="namespacename",network_name="nadnamespace/firstNAD",pod="podname"} 0
The network name label is produced using the annotation added by Multus. It is the concatenation of the namespace the network attachment definition belongs to, plus the name of the network attachment definition. The Network Metrics daemonset publishes a pod_network_name_info gauge metric, with a fixed value of 0.
The new metric alone does not provide much value, but combined with the network related container_network_* metrics, it offers better support for monitoring secondary networks.
Using a promql query like the following ones, it is possible to get a new metric containing the value and the network name retrieved from the k8s.v1.cni.cncf.io/network-status annotation:
(container_network_receive_bytes_total) + on(namespace,pod,interface) group_left(network_name) ( pod_network_name_info )
(container_network_receive_errors_total) + on(namespace,pod,interface) group_left(network_name) ( pod_network_name_info )
(container_network_receive_packets_total) + on(namespace,pod,interface) group_left(network_name) ( pod_network_name_info )
(container_network_receive_packets_dropped_total) + on(namespace,pod,interface) group_left(network_name) ( pod_network_name_info )
(container_network_transmit_bytes_total) + on(namespace,pod,interface) group_left(network_name) ( pod_network_name_info )
(container_network_transmit_errors_total) + on(namespace,pod,interface) group_left(network_name) ( pod_network_name_info )
(container_network_transmit_packets_total) + on(namespace,pod,interface) group_left(network_name) ( pod_network_name_info )
(container_network_transmit_packets_dropped_total) + on(namespace,pod,interface) group_left(network_name)
Legal Notice
Copyright © Red Hat
OpenShift documentation is licensed under the Apache License 2.0 (https://www.apache.org/licenses/LICENSE-2.0).
Modified versions must remove all Red Hat trademarks.
Portions adapted from https://github.com/kubernetes-incubator/service-catalog/ with modifications by Red Hat.
Red Hat, Red Hat Enterprise Linux, the Red Hat logo, the Shadowman logo, JBoss, OpenShift, Fedora, the Infinity logo, and RHCE are trademarks of Red Hat, Inc., registered in the United States and other countries.
Linux® is the registered trademark of Linus Torvalds in the United States and other countries.
Java® is a registered trademark of Oracle and/or its affiliates.
XFS® is a trademark of Silicon Graphics International Corp. or its subsidiaries in the United States and/or other countries.
MySQL® is a registered trademark of MySQL AB in the United States, the European Union and other countries.
Node.js® is an official trademark of the OpenJS Foundation.
The OpenStack® Word Mark and OpenStack logo are either registered trademarks/service marks or trademarks/service marks of the OpenStack Foundation, in the United States and other countries and are used with the OpenStack Foundation’s permission. We are not affiliated with, endorsed or sponsored by the OpenStack Foundation, or the OpenStack community.
All other trademarks are the property of their respective owners.