Chapter 17. How does the subscriptions service show my subscription data?
The subscriptions service shows subscription data for Red Hat offerings such as software products or product sets, organized by the Red Hat software portfolio options in the Hybrid Cloud Console. The subscriptions service shows data for the Red Hat Enterprise Linux, Red Hat OpenShift (including the products from the former Application Services page), and Red Hat Ansible software portfolios.
Only a subset of Red Hat products in each portfolio, identified by their stock-keeping units (SKUs), are tracked by the subscriptions service. The subscriptions service maintains an explicit deny list within the source code for untracked products.
- For more information about the SKUs that are not tracked, see the deny list source code in GitHub.
- For more information about the purpose of the subscriptions service deny list, see the What subscriptions (SKUs) are included in Subscription Usage? article.
For each software portfolio, the Subscription Services menu shows options for navigating to the subscriptions service product pages for the available products within the selected portfolio. The Subscription Services menu also contains options for viewing other subscription-related data or for functions that are not part of the subscriptions service. These options include services for viewing more details about your subscription inventory or working with manifests.
Each product page for the subscriptions service offers multiple views. These views enable you to explore different aspects about your subscriptions for that product. When combined, the data from these views can help you recognize and mitigate problems or trends with excess subscription usage, organize subscription allocation across all of your resources, and improve decision-making for future purchasing and renewals.
For all of these activities, and for other questions about your subscription usage, the members of your Red Hat account team can provide expertise, guidance, and additional resources. Their assistance can add context to the account data that is reported in the subscriptions service and can help you understand and comply with your responsibilities as a customer. For more information, see Your responsibilities.
17.1. How to use the subscription data in the views
The subscriptions service views can be grouped generally into the graph view and the table view.
The graph view is a visual representation of the subscription usage and capacity for your organization, where your organization is also a Red Hat account. This view helps you track usage trends and determine utilization, which is the percentage of deployed software when measured against your total subscriptions.
The table view can contain one or more tables that provide more details about the general data in the graph view. The current instances table, also referred to as the current systems table, provides details about subscription usage on individual components of your environment, for example, systems in your inventory or clusters in your cloud infrastructure or restricted network. The current subscriptions table provides details about individual subscriptions in your account. The table view helps you to find where Red Hat software is deployed in your environment, to understand how individual subscriptions contribute to your overall capacity for usage of similar types of subscriptions, to resolve questions you might have about subscription usage, and to refine plans for future deployments.
For some product pages, the table view data is derived from data in the Hybrid Cloud Console inventory service. User access to subscriptions, inventory, and other services is controlled independently by a role-based access control (RBAC) system for the Hybrid Cloud Console services, where individual users belong to groups and groups are associated with roles. More specifically, user access to the inventory service is controlled through the Inventory administrator role.
When the Inventory administrator RBAC role is enabled for the group or groups for your organization, information in the current instances table for the subscriptions service can display as links, where you can open a more detailed record in the inventory application for the listed systems or instances, as applicable. Otherwise, current instances table information displays as nonlinked information. For more information about RBAC usage in your organization, contact the Organization Administrator for your account.
The usage and utilization graph view
The graph view shows you your total subscription usage and capacity over time in a graph form. It provides perspective on your account’s subscription threshold, current subscription utilization, and remaining subscription capacity, along with the historical trend of your software usage. The graph view might contain a single graph or multiple graphs, depending upon how subscription usage for a product is measured.
The usage and capacity calculations that appear in the graph are based on data snapshots that are provided periodically as the Hybrid Cloud Console processing tools analyze information from the various data collection tools and data sources. The data snapshots for Annual subscriptions generally update once every 24 hours. The data snapshots for On-Demand subscriptions can be more frequent, updating multiple times per day.
Usage is the measurement of the consumption of Red Hat products installed on physical hardware or its equivalent. Usage is measured with a unit of measurement that is defined within the terms of a subscription.
Units of measurement differ according to the type of product and the type of subscription. The terms of Annual subscriptions determine usage as the physical hardware that is consumed, such as sockets or cores, or equivalent physical hardware that is consumed, such as a cloud platform instance that is equal to a socket. The terms of On-Demand subscriptions, such as pay-as-you-go subscriptions, can determine usage by a combination of metrics that measure consumed resources. One type of these metrics might be a compound unit, or derived unit. Examples of derived units can be a certain amount of physical hardware that is consumed during a specific period of time, such as core hours, or the availability of a Red Hat service instance, such as instance hours.
Usage is represented by a line or area graph, with different types of usage, for example, Red Hat Enterprise Linux physical, virtual, public cloud, and hypervisor usage, represented by different colors. You can hover over the graph to view more specific usage numbers for the selected time interval.
For Annual subscriptions, usage fluctuates over time as you install and uninstall the software contained in your subscriptions. For On-Demand subscriptions, usage fluctuates as you consume more or less of the resources that are measured by the terms of that subscription.
NoteUsage numbers for derived units of measurement over time, such as core hours, vCPU hours, or instance hours, might show usage as a decimal value. If so, the usage that is shown in the subscriptions service interface is rounded to 2 decimal places for display purposes. However, the data that is used for the subscriptions service calculations and that is provided to the relevant billing service is rounded to 6 decimal places.
Capacity is the upper limit of usage for a subscription, expressed in the unit of measurement and then summed for similar subscriptions across all of the contracts in your account. Similar subscriptions can be all products in a certain product portfolio, such as all RHEL subscriptions of a particular architecture or variant.
The sum of capacity for all of your active subscriptions, the maximum capacity, is also known as the subscription threshold. This value is represented by a dashed line in the usage and utilization graph for a product. Two primary reasons could prevent a subscription threshold from appearing in the graph. If a product page includes a subscription that is sold with unlimited capacity as part of its sales terms, the subscription threshold is not shown. Also, for On-Demand subscriptions or similar subscriptions that are billed for monthly usage, no capacity is set, so a subscription threshold is not shown. If filter selections remove unlimited subscriptions from a view, then the subscription threshold would appear for those filtered results.
The capacity of an individual subscription does not change over time. The subscription threshold fluctuates over time as new subscriptions are activated and old subscriptions expire, affecting the maximum capacity.
Utilization is the percentage of the maximum capacity, as indicated by the subscription threshold, that is exhausted through the deployment and usage of Red Hat software in your account. In simple terms, utilization is the usage divided by the maximum capacity. If capacity is not applicable to a certain type of subscription present in the account, such as an unlimited subscription, utilization as a percentage of the maximum capacity also does not apply.
Subscription utilization fluctuates over time due to the interaction of the changes to the usage and the subscription threshold.
Although the graph shows trends over a selected time interval, you can also view more specific information for the graph. For example, if the selected time interval is Weekly, you can hover over the graph near a date to see more specific data for a particular week.
You can also use the available filters, which can vary by product, to change the usage data that displays in the graph. For example, you can filter by the time interval, the unit of measurement, or by the subscription attribute filters such as service level agreement (SLA), as applicable. Additional filter options might include a filter by the type of usage measurement, such as physical or virtual, or a filter by variants for that product, such as a supporting architecture of x86.
The graph view: example graph
The following image shows an example RHEL usage and utilization graph in the subscriptions service. For other product pages, the graph view will contain differences in design, depending on how those products are sold and measured.
For the graph, the time filter is set to a daily view, and the graph displays a month of RHEL usage.
Figure 17.1. Usage and utilization graph example
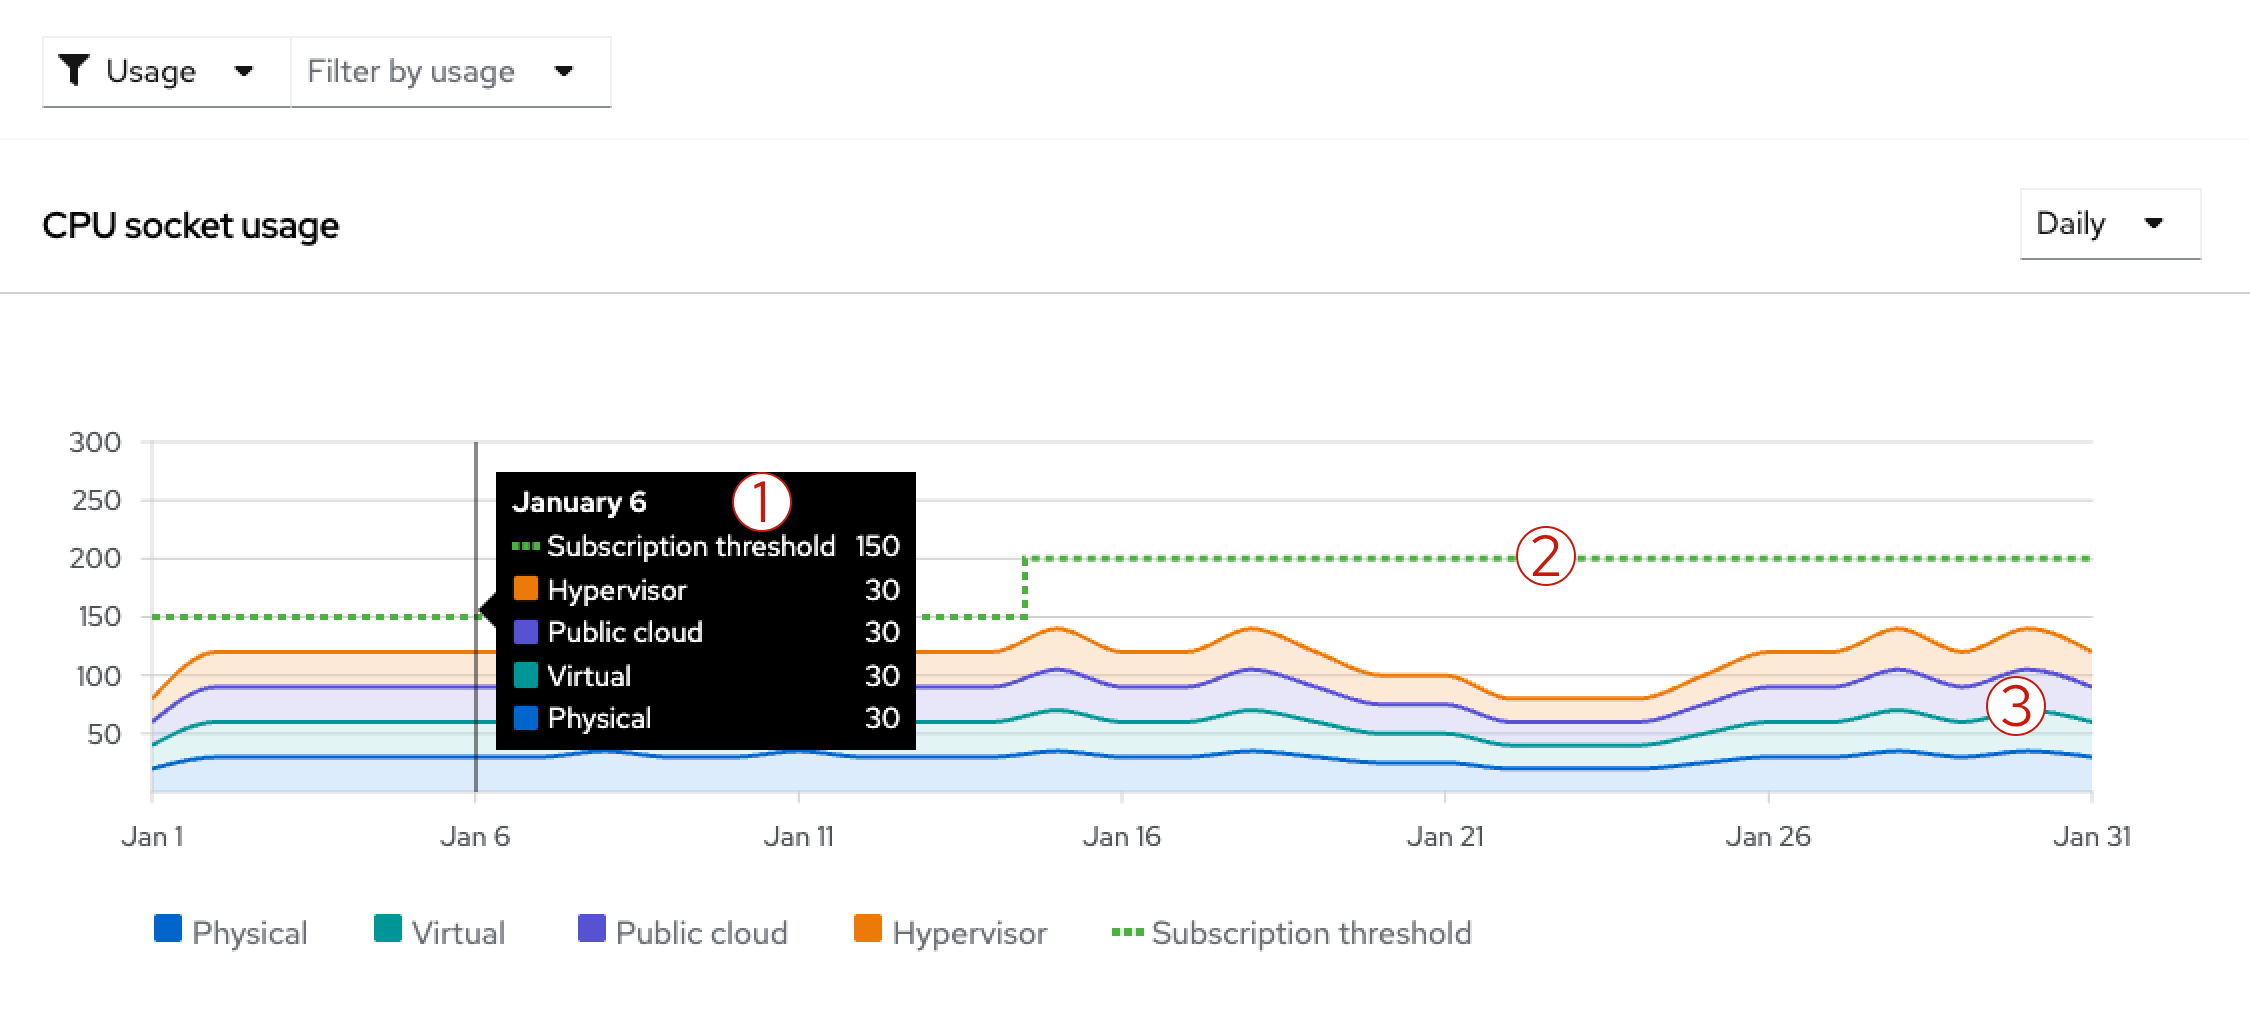
- A tooltip displays when you hover over a point in the graph. In this example, the tooltip displays more information about the subscription usage and the subscription threshold for a specific day, January 6. For this day, physical RHEL is consuming 30 sockets, virtual RHEL is consuming 30 sockets, public cloud RHEL is consuming 30 sockets, and hypervisor RHEL is consuming 30 sockets, with a total of 120 sockets for all usage types. This usage total is less than the subscription threshold of 150 sockets.
- The maximum capacity of RHEL usage, based on a unit of measurement of sockets, displays as the dashed subscription threshold line. This example shows an increase in the subscription threshold sometime between January 11 and January 16. The increase in the available capacity in this Red Hat account is due to the activation of additional RHEL subscriptions in the account.
- The RHEL subscription usage, based on a unit of measurement of sockets, displays as four different colors for RHEL installed in physical, virtual, public cloud, and hypervisor environments. The example shows how all of these types of usage fluctuate over time. Usage fluctuates according to subscription activity, such as installation and uninstallation on physical systems or launch and termination of instances in the public cloud.
The table view: current instances table
The current instances table shows you details about usage on individual components in your environment, taken from the most recent daily snapshot of the usage data. This table provides information that can help you correlate the aggregated usage totals in the graph with the current software deployments on individual components across your organization. The components and data shown in the table vary by product because of the different ways that usage is tracked for products, by socket count, core count, core hours, and so on. Also, a component that displays as an "instance" or a "system" in the table can be a physical or virtual machine, or it can be another object such as a cluster or instance. Therefore, generic references to this table as either the current instances table or the current systems table are for convenience only.
For some products such as RHEL, the data in the current instances table view contains some data that is available from the Hybrid Cloud Console inventory service, with the following differences:
- The inventory service shows significantly more system data. The current instances table view is a small subset of this data.
- Data in the inventory service can be more current because of the methods that the subscriptions service uses to update the data for some products. For these products, the current instances table view in the subscriptions service is based on a daily snapshot, so that data could be up to 24 hours old.
- Consumption of sockets or cores in the inventory service is represented as actual consumption. Usage in the subscriptions service is represented as normalized consumption, bound by the terms of subscription. For example, usage of a physical RHEL subscription is measured by socket pair, so a socket count for that type of system is always rounded to the next higher even number.
The information in the current instances table generally shows the name of the instance or system, the type of the system, the usage total for that system according to the unit of measurement, and the date that the system was last seen. However, the available columns in the table might differ according to the types of data that are relevant for that product. Columns in the table are sortable.
For the Name column that contains the name of the system, the system is the machine, either physical or virtualized, on which the product or product set is deployed. A system can also be a different component, such as an Red Hat OpenShift cluster or other object such as a node or a running instance. The system is usually represented by either its display name or its universally unique ID (UUID). For multi-guest systems such as hypervisors, you can expand the system to see more information about individual guests. For some objects in the Name column, you can also click the system name to open the full system record in a different resource, for example, in the Hybrid Cloud Console inventory service.
Currently for the display of Red Hat OpenShift Container Platform and Red Hat OpenShift Dedicated pay-as-you-go On-Demand subscription data, the Name column uses the inventory UUID. This ID is not the same as the cluster ID that is used for the cluster in Red Hat OpenShift Cluster Manager. In addition, the inventory UUID in the Name column does not provide a link to the cluster record in Red Hat OpenShift Cluster Manager. However, in both the subscriptions service and Red Hat OpenShift Cluster Manager you can use the available search filters to cross-reference these IDs.
For the Guests column that displays in the table when hypervisor usage can be tracked, the guest count is for the number of guests that are under the management of that hypervisor system. For other types of usage, the double dashed line represents a null value for that system.
For the Type column that contains the type of the system, the type is the infrastructure type on which the product or product set is deployed. A system can be a physical host, hypervisor, individual virtual machine, or other form of virtual deployment such as a public cloud instance. The information in this column might not be applicable to all products, so for some products the Type column might not appear.
For the column where the usage total for that system is displayed, the column label will vary according to how product usage is measured. For subscriptions where usage is measured with multiple metrics, multiple columns will display. The usage is the actual or equivalent amount of physical hardware that the product or product set is consuming on that system. Usage is counted according to the applicable unit of measurement, which in turn is determined by the terms of the subscription. For example, for a subscription that is sold by sockets, the usage total is the number of sockets, also known as subscribed sockets, that are consumed by a system. Other subscriptions such as On-Demand subscriptions are sold with different terms, such as by core hours, or might include multiple metrics in the terms, such as data transfer, data storage, and other workload activities in vCPU hours, and control plane consumption in instance hours or control plane hours.
The data for the usage total is based on the update, or heartbeat, cycles for the subscriptions service. For Annual subscriptions, the value that displays for the usage total is based on the 24-hour snapshot of usage for the most recently tallied day. For On-Demand subscriptions, the value is the most recently tallied data that is available to the subscriptions service, data that could be from the current day.
For the Last seen column that contains a date, that last seen date is the date that the system was last found by the Hybrid Cloud Console tools, such as the inventory service or Red Hat OpenShift Cluster Manager and other tools in the monitoring stack. As part of the underlying tasks that the subscriptions service and other tools perform to calculate usage, the inventory service and the monitoring stack help to identify and deduplicate system data that is gathered by the various data collection tools.
As with the usage and utilization graph, you can use the filters to change the data that displays in the current instances table. However, a change to the time interval, such as changing from days to weeks, has no effect on the current instances table. The data displayed is from the most recent snapshot, so it is usually no more than 24 hours old.
You can also search the current instances table for a specific system name or a group of similarly named systems by using the search field. Exact and partial strings are accepted, but common wildcard characters are treated as literal characters, not special character wildcards.
The table view: current subscriptions table
The current subscriptions table shows you details about your currently active subscriptions, taken from the most recent daily snapshot of this data. This table contains information that can help you understand the maximum capacity for your usage of that product within your account. The maximum capacity is displayed as the subscription threshold in the usage and utilization graph view.
The table shows the capacity for each subscription in the unit of measurement by which that subscription is sold, for example, sockets or cores. The sum of the capacity for all rows equals the subscription threshold.
By using the data in the current subscriptions table, you can more fully understand how individual subscriptions are contributing to the subscription threshold. This information can help you plan for any future purchasing decisions, such as adjusting the amount of existing subscriptions or purchasing different subscriptions that are more suited to your usage profile. You can also use the information in the table to anticipate upcoming events that could affect your business activities in relation to purchasing and renewals, such as contract expiration.
Currently, some On-Demand subscriptions such as Red Hat OpenShift Dedicated On-Demand are restricted to one subscription per account. Therefore, the current subscriptions table does not display for these types of products.
The information in the current subscriptions table generally shows the name of the product subscription, the service level agreement (SLA) for the subscription, the quantity of the subscription, the capacity of that subscription according to the unit of measurement, and the next renewal event for the subscription. All columns in the table are sortable.
The Product column lists unique product subscriptions that are currently active in your account. Future-dated subscriptions that are not yet active do not appear in the table. Expired subscriptions that are not renewed are removed from the table.
In general, subscriptions that share the same stock-keeping unit (SKU) appear on a single row. Subscriptions that can be grouped on the same row include these characteristics:
- Subscriptions with the same SKU, whether purchased in the same or different contracts or purchased at the same or different times.
- Subscriptions with the same SKU but with other minor differences to attributes, such as differences in quantity, that do not result in the creation of a new SKU.
However, some subscriptions might display multiple times in the Product column. These subscriptions include these characteristics:
- Subscriptions that have different SKUs but identical description text: The text that displays for a subscription is derived from the SKU description text. In some cases, this text might be identical for different SKUs. For example, two subscriptions could differ in one major attribute such as the SLA, resulting in a different SKU for the changed SLA.
- Subscriptions that have the same SKU but that are purchased through different marketplaces: Some Red Hat subscriptions are made available through multiple cloud provider marketplaces, such as Red Hat Marketplace and AWS Marketplace. A subscription of this type would have a single SKU, even though it is available in multiple locations. In the current subscriptions table, these subscriptions would appear on different rows to help clarify which marketplace was used for the purchase.
The Service level column contains the service level agreement (SLA) for a subscription, as defined within the terms of the subscription. Examples include Premium, Standard, or Self-Support. This information can sometimes help you distinguish between two subscriptions in the Product column that have identical descriptions.
The Quantity column contains the number of active subscriptions for a SKU. For example, a single table row might contain multiples of the same SKU purchased in the same transaction. It might also contain multiples of the same SKU purchased in different transactions.
For the column where the capacity for a subscription is displayed, the column label will vary according to how product usage is measured. For example, RHEL is sold in socket pairs, so the capacity column for RHEL has the label Sockets. This capacity column measures the maximum amount of available usage for the subscriptions in each table row. Usage is counted according to the applicable unit of measurement, which in turn is determined by the terms of the subscription. When summed, the total for all rows in the table represents the maximum possible capacity of usage for all subscriptions of that product. This value is also the subscription threshold in the graph view.
When a row includes a subscription that is sold with unlimited capacity, the capacity value for that row will show the infinity symbol to represent the unlimited capacity.
For some product pages, the capacity column might be replaced with a different column if capacity is not applicable. For example, for an On-Demand subscription, a Subscription type column might display the type of subscription, such as Annual or On-Demand.
The Next renewal column lists the next pending renewal event for any subscription that is included in that row.
17.2. Measurement of usage and capacity
The subscriptions service tracks certain types of Red Hat Enterprise Linux, Red Hat OpenShift, and Red Hat Ansible products. The data that is displayed for usage and capacity varies by product.
Overall usage and capacity trends display on the usage and utilization graph. The information in the current instances table provides additional detail about the most recent day of data from the graph. Where applicable, the information in the current subscriptions table provides additional detail about your currently active subscriptions.
17.2.1. Measurement of usage and capacity for Red Hat Enterprise Linux
The measurement of RHEL usage is based on the type of subscription.
Red Hat Enterprise Linux with a traditional Annual subscription
For Red Hat Enterprise Linux with a traditional Annual subscription, measurement of usage is based on the consumption of sockets, according to the terms of your subscription.
As of 6 September 2023, the subscriptions service has changed the number of reported system types in the usage data for the RHEL for x86 variant. The following system types are no longer reported in the graph and table data: RHEL Desktop, RHEL Workstation, and RHEL Compute Node. Instead, only the RHEL Server system type is reported in the graph and table for the RHEL for x86 variant. You can still use the API to access data for RHEL Workstation and RHEL Compute Node, but the data for RHEL Desktop has been removed. The change is applicable for future reporting, but not for historical data.
This reporting change is intended to streamline current and future workflows in the subscriptions service user interface by emphasizing the technical variants of the RHEL platform. Beginning with release 8, subscriptions for limited subsets of the subscriptions service content began using the same overall source repositories, eliminating technical differences between them. Because RHEL Server subscribers significantly outnumber RHEL Workstation and RHEL Compute Node subscribers, removing identical-source RHEL offerings that are not technical variants reduces the burden of viewing and understanding RHEL Server usage in the user interface.
With this change, you might notice that your overall usage numbers of RHEL for x86 are reduced in the user interface graph and table data, by an amount that previously represented the RHEL Desktop, RHEL Workstation, and RHEL Compute Node systems. You can use the rhsm-subscriptions-api API if you want to continue to monitor RHEL usage for the RHEL Workstation and RHEL Compute Node systems.
Use the following endpoints to view this system usage data. For additional information about these endpoints, see the associated API documentation:
-
Use the
/instances/product/{product_id}endpoint with the correct product ID for the{product_id}variable to see the RHEL Workstation or RHEL Compute Node instances. For more information, see the API documentation. -
Use the
/tally/products/{product_id}/{metric_id}endpoint with the correct product ID for the{productID}variable and a value ofsocketsfor the{metric_id}variable to see the RHEL Workstation or RHEL Compute Node usage. For more information, see the API documentation.
- Usage: RHEL with a traditional Annual subscription
Usage is measured in CPU sockets. Data is aggregated for all supported architectures and can be filtered by those architectures, including the supported IBM and x86 architectures. You can view usage data that is specific to each architecture or variant by selecting from the options in the Variant filter.
The usage data in the graph is divided into four sections, based on RHEL on physical systems, virtual systems, public cloud systems, or hypervisors.
- Capacity: RHEL with a traditional Annual subscription
To measure capacity, the socket contribution of each RHEL subscription is totaled.
For some Red Hat products, RHEL is included with and is installed to support that product. This inclusion is sometimes also referred to as being "bundled with" another product. For example, RHEL is included with Red Hat Satellite and is tracked separately in a Satellite page view. Bundled RHEL is not tracked or counted against the total RHEL usage or capacity that is intended for production workloads or similar purposes.
Red Hat Satellite
For Red Hat Satellite, similar to RHEL, measurement of usage is based on the consumption of sockets, according to the terms of your subscription.
- Usage: Satellite
Usage is measured in CPU sockets. Data is aggregated for all Satellite and can be filtered by those products, Satellite Server and Capsule Server. You can view usage data that is specific to each product by selecting from the options in the Variant filter.
Satellite usage is shown to help you identify the presence of RHEL that is installed in support of Satellite. An example of this type of subscription is a RHEL subscription with the Smart Management bundle. If you have known RHEL systems that are running this type of bundled RHEL, you can use the Satellite view to find those systems.
- Capacity: Satellite
Capacity is not an applicable metric for Satellite. So capacity is not tracked, nor is a subscription threshold line shown, for this type of subscription.
RHEL that is installed in support of Satellite is not counted with your overall RHEL capacity. Instead, that RHEL subscription is specifically intended to run Satellite and is not intended to be used for other workload or development purposes, based on the terms of that subscription.
Red Hat Enterprise Linux with a pay-as-you-go On-Demand subscription
For Red Hat Enterprise Linux with a pay-as-you-go On-Demand subscription, measurement of usage is based on vCPU hours, based on the terms of your subscription.
Currently, Red Hat Enterprise Linux for Third Party Linux Migration with Extended Life Cycle Support Add-on is the only RHEL pay-as-you-go On-Demand subscription offering that is tracked by the subscriptions service.
- Usage: RHEL with a pay-as-you-go On-Demand subscription
Usage of a pay-as-you-go On-Demand subscription of RHEL is measured with a single metric, in virtual CPU hours (vCPU hours). A vCPU hour is a measurement of availability for computational activity on one virtual core (as defined by the subscription terms), for a total of one hour, measured to the granularity of the meter that is used. For RHEL pay-as-you-go On-Demand subscription usage, availability for computational activity is the availability of the RHEL instance over time. To obtain usage in vCPU hours, the subscriptions service uses numerical integration, also commonly known as an "area under the curve" calculation.
The vCPU hour based usage data for the RHEL instances is summed and then displays as daily usage in the usage and utilization graph. Because of the monthly billing cycle for an On-Demand subscription, the default time interval for the graph is one month, the current calendar month. The subscriptions service uses the calendar month interval as a standard for reporting On-Demand usage because billing cycles for On-Demand subscriptions might vary across the different cloud provider marketplaces that you might purchase from.
Adjacent to the graph, daily and monthly totals display for the most current snapshot of usage.
- Capacity: RHEL with a pay-as-you-go On-Demand subscription
- Capacity is not an applicable metric for a pay-as-you-go On-Demand subscription. So capacity is not tracked, nor is a subscription threshold line shown, for this type of subscription.
17.2.2. Measurement of usage and capacity for Red Hat OpenShift
For Red Hat OpenShift, measurement of usage for many products is based upon the size of clusters. More specifically, the measurement is based on the subscribed cluster size. The unit of measurement that is used to measure the subscribed cluster size depends upon the subscription terms and type of subscription for the product.
The subscribed cluster size is the sum of the size of all the subscribed nodes, which are the nodes that process workloads. In the versions of Red Hat OpenShift where the facts about node types and node labels can be obtained, all noninfrastructure nodes plus master nodes that are schedulable are considered available for workload use. For each of the subscribed nodes, the kernel is queried for the number of sockets, the number of cores on each socket, and the number of threads supported by each core. Then the total number of threads is divided by the threads per core to determine the number of cores on the node (physical or virtual machine).
There are exceptions for some other Red Hat OpenShift products and add-ons that track consumption of resources related to different types of workloads, such as data transfer and data storage for workload activities, or instance availability for consumption of control plane resources.
For Red Hat OpenShift version 4.1 and later (including the 4.7 versions of Red Hat OpenShift Container Platform and OpenShift Dedicated for On-Demand subscriptions), the subscriptions service is able to use node type and node label data to find the subscribed nodes. In the aggregation of usage data based on cluster size for these versions of Red Hat OpenShift, the nonsubscribed node usage, such as control plane node usage, is ignored. However, for OpenShift Dedicated On-Demand, the control plane usage is tracked as instance hours, based upon the availability of clusters.
The subscriptions service is not able to make this same distinction for earlier versions of Red Hat OpenShift Container Platform, so data for subscribed and nonsubscribed nodes is displayed and counted. Analysis of cluster data indicates that approximately 15% of data displayed for earlier versions of Red Hat OpenShift Container Platform is nonsubscribed node overhead. Therefore, if your subscription profile includes Red Hat OpenShift Container Platform version 3, it is possible that you can exceed your Red Hat OpenShift subscription threshold by up to 15% but still be in compliance with your subscriptions.
For additional details about how the subscriptions service uses subscribed node and subscribed cluster size data, see the following information: What does the subscriptions service track?
For additional details about improvements to Red Hat OpenShift usage tracking in the subscriptions service, see the following information: How do vCPUs, hyper-threading, and subscription structure affect the subscriptions service usage data?
After the cluster size information is obtained, usage and capacity information is calculated according to the product and type of subscription. For more information, see the following descriptions of each product and subscription type.
Red Hat OpenShift Container Platform
- Usage: Red Hat OpenShift Container Platform with an Annual subscription
- Usage of an Annual subscription of Red Hat OpenShift Container Platform is measured in CPU cores or sockets. Data displays as an account-level view that is a sum of usage across active clusters.
- Capacity: Red Hat OpenShift Container Platform with an Annual subscription
- To measure capacity, the core or socket contribution (as applicable) of each subscription is added to a total for Annual subscriptions.
- Usage: Red Hat OpenShift Container Platform with a pay-as-you-go On-Demand subscription
Usage of a pay-as-you-go On-Demand subscription of Red Hat OpenShift Container Platform is measured in core hours. A core hour is a unit of measurement for computational activity on one core (as defined by the subscription terms), for a total of one hour, measured to the granularity of the meter that is used. To obtain usage in core hours, the subscriptions service uses numerical integration, also commonly known as an "area under the curve" calculation.
The core hour based usage data for all clusters is summed and then displays as daily usage in the usage and utilization graph. Because of the monthly billing cycle for an On-Demand subscription, the default time interval for the graph is one month, the current calendar month. The subscriptions service uses the calendar month interval as a standard for reporting On-Demand usage because billing cycles for On-Demand subscriptions might vary across the different cloud provider marketplaces that you might purchase from.
A cumulative core hours used value also displays for the most recent snapshot of the usage for that month if there is accumulated usage to display.
- Capacity: Red Hat OpenShift Container Platform with a pay-as-you-go On-Demand subscription
- Capacity is not an applicable metric for a pay-as-you-go On-Demand subscription. So capacity is not tracked, nor is a subscription threshold line shown, for this type of subscription.
Red Hat OpenShift Dedicated
- Usage: Red Hat OpenShift Dedicated with a pay-as-you-go On-Demand subscription
Usage of a pay-as-you-go On-Demand subscription of Red Hat OpenShift Dedicated is measured with two units of measurement, core hours and instance hours. Therefore, the usage and utilization graph includes a dual y-axis, also known as a primary y-axis and secondary y-axis.
- A core hour is a unit of measurement for computational activity on one core (as defined by the subscription terms), for a total of one hour, measured to the granularity of the meter that is used. For Red Hat OpenShift Dedicated On-Demand, core hours measure the workload usage on the compute machines.
- An instance hour is a unit of measurement for the availability of a Red Hat service instance, during which it can accept and execute customer workloads. For Red Hat OpenShift Dedicated On-Demand, instance hours use your cluster availability data to measure the control plane usage on the control plane machines (in older versions of Red Hat OpenShift, the master machines). This data is used to calculate the control plane cost, also known as the cluster fee, that is included in your Red Hat Marketplace invoice.
To obtain usage in core hours and instance hours, the subscriptions service uses numerical integration, also commonly known as an "area under the curve" calculation. This process samples usage multiple times per hour, normalizes the samples for a specific time interval, aggregates the normalized samples into a daily total, and then sums each day into a total that is determined by the billing terms of the subscription.
The usage data for all clusters is summed and displayed as daily usage in the usage and utilization graph. The core hour usage is plotted with the primary y-axis, and the instance hour usage is plotted with the secondary y-axis. Because of the monthly billing cycle for an On-Demand subscription, the default time interval for the graph is one month, the current month. The subscriptions service uses the calendar month interval as a standard for reporting On-Demand usage because billing cycles for On-Demand subscriptions might vary across the different cloud provider marketplaces that you might purchase from.
A cumulative core hours used value also displays for the most recent snapshot of the usage for that month if there is accumulated usage to display.
- Capacity: Red Hat OpenShift Dedicated with a pay-as-you-go On-Demand subscription
- Capacity is not an applicable metric for a pay-as-you-go On-Demand subscription. So capacity is not tracked, nor is a subscription threshold line shown, for this type of subscription.
Additional Red Hat OpenShift families, products, and add-ons
For these Red Hat OpenShift families, products, and add-ons, measurement of usage is based on metrics that generally relate to the consumption of computing resources by the platform that powers the service. These resources might include, but are not limited to, metrics concerning CPU, vCPU, RAM, network traffic, storage volume, and control plane consumption during the availability of each instance of a service. Because these services perform different jobs and consume different resources, an individual service might be measured by a single metric or a combination of these metrics. In addition, those differences in the services can result in different units of measurement being used for the basic metric types.
In the subscriptions service, an offering that is purchased multiple times through multiple cloud provider marketplaces will appear as grouped on a single page. Use the filtering function to limit the usage data to an offering that is purchased through a specific cloud provider.
Red Hat OpenShift Service on AWS Hosted Control Planes
- Usage: Red Hat OpenShift Service on AWS Hosted Control Planes with a pre-paid plus On-Demand subscription
Usage of a Red Hat OpenShift Service on AWS Hosted Control Planes (ROSA Hosted Control Planes) with a pre-paid plus On-Demand subscription is measured with two metrics, vCPU hour usage and control plane hour usage.
- A vCPU hour is a measurement of availability for computational activity on one virtual core (as defined by the subscription terms) for a total of one hour, measured to the granularity of the meter that is used. For ROSA Hosted Control Planes, availability for computational activity is the availability of the vCPUs for the ROSA Hosted Control Planes subscribed clusters over time. A subscribed cluster is comprised of subscribed nodes, which are the noninfrastructure nodes plus schedulable master nodes that are available for workload use, if applicable. Note that for ROSA Hosted Control Planes, schedulable master nodes are not applicable, unlike other products that also use this measurement. The vCPUs that are available to run the workloads for a subscribed cluster contribute to the vCPU hour count.
- A control plane hour is a measurement of the availability of the control plane that is hosted in the Red Hat account. With ROSA Hosted Control Planes, each cluster has a dedicated control plane that is isolated in a ROSA Hosted Control Planes service account that is owned by Red Hat.
To obtain usage in vCPU hours and control plane hours, the subscriptions service uses numerical integration, also commonly known as an "area under the curve" calculation. The vCPU hour subscribed cluster usage data is summed and the control plane hour based usage data is summed and then usage data for both displays as daily usage in usage and utilization graphs. Because of the monthly billing cycle for an On-Demand subscriptions, the default time interval for the graph is one month, the current calendar month. The subscriptions service uses the calendar month interval as a standard for reporting On-Demand subscriptions usage, but the actual billing cycle from AWS can vary due to the effective date of the contract.
The ROSA Hosted Control Planes usage is measured and compared against the pre-paid portion of your contract with AWS. Usage that does not exceed the pre-paid portion of your contract is recorded, but is not sent to AWS. When usage exceeds the pre-paid portion of your contract, the overage amount is sent to AWS for billing purposes.
The terms of the ROSA Hosted Control Planes contract enable users to increase the amount of pre-paid usage at any time during the contract, including during the middle of a month. If a contract is adjusted mid-month, the subscriptions service can track the contract adjustment.
If you exceed your pre-paid contract usage and begin accumulating pay-as-you-go usage during a calendar month, and you also increase your pre-paid contract usage within that same month, the previously accumulated pay-as-you-go usage does not revert to pre-paid contract usage. However, new pay-as-you-go usage does not accumulate until your usage exceeds the new pre-paid contract usage maximum plus the previously accumulated pay-as-you-go usage. This principle ensures that pay-as-you-go usage is not double-counted.
For example:
- You have a subscription for 100 units of pre-paid contract usage.
- You use 110 units before the calendar month expires. Of those units, 100 units are counted as pre-paid usage and 10 units are counted as pay-as-you-go usage.
- You increase your subscription to 200 units of pre-paid contract usage, and the change takes effect within that same month.
- Additional pay-as-you-go usage is counted only after you exceed 210 units for that month.
- Capacity: Red Hat OpenShift Service on AWS Hosted Control Planes with a pre-paid plus On-Demand subscription
- Capacity is determined by the number of vCPU hours that are purchased, as shown in the terms of the ROSA Hosted Control Planes contract.
Red Hat OpenShift AI
- Usage: Red Hat OpenShift AI with a pay-as-you-go On-Demand subscription
Usage of a pay-as-you-go On-Demand subscription of Red Hat OpenShift AI (RHOAI) is measured with a single metric, in vCPU hours. A vCPU hour is a measurement of availability for computational activity on one virtual core (as defined by the subscription terms), for a total of one hour, measured to the granularity of the meter that is used. For RHOAI pay-as-you-go On-Demand subscription usage, availability for computational activity is the availability of the RHOAI cluster over time. To obtain usage in vCPU hours, the subscriptions service uses numerical integration, also commonly known as an "area under the curve" calculation.
The vCPU hour based usage data for the RHOAI cluster is summed and then displays as daily usage in the usage and utilization graph. Because of the monthly billing cycle for an On-Demand subscription, the default time interval for the graph is one month, the current calendar month. The subscriptions service uses the calendar month interval as a standard for reporting On-Demand usage because billing cycles for On-Demand subscriptions might vary across the different cloud provider marketplaces that you might purchase from.
Adjacent to the graph, daily and monthly totals display for the most current snapshot of usage.
- Capacity: Red Hat OpenShift AI with a pay-as-you-go On-Demand subscription
- Capacity is not an applicable metric for a pay-as-you-go On-Demand subscription. So capacity is not tracked, nor is a subscription threshold line shown, for this type of subscription.
Red Hat Advanced Cluster Security for Kubernetes
- Usage: Red Hat Advanced Cluster Security for Kubernetes with a pay-as-you-go On-Demand subscription
Usage of a pay-as-you-go On-Demand subscription of Red Hat Advanced Cluster Security for Kubernetes (RHACS) is measured with a single metric, in vCPU hours. A vCPU hour is a measurement of availability for computational activity on one virtual core (as defined by the subscription terms), for a total of one hour, measured to the granularity of the meter that is used. For RHACS pay-as-you-go On-Demand subscription usage, availability for computational activity is the availability of the RHACS cluster over time. To obtain usage in vCPU hours, the subscriptions service uses numerical integration, also commonly known as an "area under the curve" calculation.
The vCPU hour based usage data for all clusters managed by RHACS is summed and then displays as daily usage in the usage and utilization graph. Because of the monthly billing cycle for an On-Demand subscription, the default time interval for the graph is one month, the current calendar month. The subscriptions service uses the calendar month interval as a standard for reporting On-Demand usage because billing cycles for On-Demand subscriptions might vary across the different cloud provider marketplaces that you might purchase from.
Adjacent to the graph, daily and monthly totals display for the most current snapshot of usage.
- Capacity: Red Hat Advanced Cluster Security for Kubernetes with a pay-as-you-go On-Demand subscription
- Capacity is not an applicable metric for a pay-as-you-go On-Demand subscription. So capacity is not tracked, nor is a subscription threshold line shown, for this type of subscription.
Red Hat Advanced Cluster Management for Kubernetes
Currently, the subscriptions service shows usage data for deployments of Red Hat Advanced Cluster Management for Kubernetes with Red Hat OpenShift Service on AWS Hosted Control Planes and Red Hat Advanced Cluster Management for Kubernetes with Red Hat OpenShift Service on AWS (classic architecture).
- Usage: Red Hat Advanced Cluster Management for Kubernetes with a pre-paid plus On-Demand subscription
Usage of a Red Hat Advanced Cluster Management for Kubernetes (RHACM) pre-paid plus On-Demand subscription subscription is measured in a single metric, in vCPU hours. A vCPU hour is a measurement of availability for computational activity on one virtual core (as defined by the subscription terms), for a total of one hour, measured to the granularity of the meter that is used. For RHACM pre-paid plus On-Demand subscription usage, the availability for computational activity is the availability of the vCPUs for the RHACM subscribed clusters over time.
A subscribed cluster is comprised of subscribed nodes, which are the noninfrastructure nodes plus the schedulable master nodes that are available for workload use, if applicable. For RHACM, both the RHACM hub cluster and the clusters under management by RHACM contain subscribed nodes. The vCPUs that are available to run the workloads for a subscribed cluster contribute to the vCPU hour count.
To obtain usage in vCPU hours, the subscriptions service uses numerical integration, also commonly known as an "area under the curve" calculation. The vCPU hour based usage data for the subscribed nodes on the RHACM hub cluster and the subscribed nodes for the clusters under RHACM management is summed and then displays as daily usage in the usage and utilization graph. Because of the monthly billing cycle for an On-Demand subscription, the default time interval for the graph is one month, the current calendar month. The subscriptions service uses the calendar month interval as a standard for reporting On-Demand usage, but the actual billing cycle of the cloud provider can vary due to the effective date of the contract.
The RHACM usage is measured and compared against the pre-paid portion of your contract with AWS. Usage that does not exceed the pre-paid portion of your contract is recorded, but is not sent to AWS. When usage exceeds the pre-paid portion of your contract, the overage amount is sent to AWS for billing purposes.
Adjacent to the graph, daily and monthly totals display for the most current snapshot of usage.
- Capacity: Red Hat Advanced Cluster Management for Kubernetes with a pre-paid plus On-Demand subscription
- Capacity is determined by the number of vCPU hours that are purchased, as shown in the terms of the Red Hat Advanced Cluster Management for Kubernetes contract.
17.2.3. Measurement of usage and capacity for Red Hat Ansible
The measurement of Red Hat Ansible usage is based on metrics that generally relate to the consumption of computing resources by the platform that powers the service.
Red Hat Ansible Automation Platform
- Usage: Red Hat Ansible Automation Platform, as a managed service
Usage of Ansible Automation Platform as a managed service is measured with two metrics, managed nodes and infrastructure hours.
- A managed node is a measurement of the number of unique managed nodes that are used within the monthly billing cycle, where the usage is tracked by the invoking of an Ansible task against that node.
- An infrastructure hour is a measurement of the availability of the Ansible Automation Platform infrastructure. Each deployment of Ansible Automation Platform has a dedicated control plane that is isolated in a service account that is owned and managed by Red Hat.
- Capacity: Red Hat Ansible Automation Platform, as a managed service
- Capacity is determined by the number of managed nodes and infrastructure hours that are purchased, as shown in the terms of the Ansible Automation Platform contract.
17.3. Units of measurement
The unit of measurement by which product usage is tracked is determined by the terms of the subscription.
17.3.1. Units of measurement for Red Hat Enterprise Linux
Red Hat Enterprise Linux with a traditional Annual subscription
In general, the subscriptions service measures your RHEL usage by sockets for traditional Annual subscriptions. However, because of the inherent differences between physical, virtual, public cloud, and hypervisor offerings and their relation to hardware, the subscriptions service tracking uses different units of measurement, as follows:
- Physical usage
The subscriptions service measures your physical RHEL installations by CPU socket pairs. Each system contributes its installed socket count, rounded upwards to the next even number. The value that displays is the total socket count after all of the system-level socket-pair rounding is applied.
In the current instances table, on-premise physical hardware displays as physical machines.
- Virtual usage
- The subscriptions service measures your virtualized RHEL installations by individual sockets, where one socket represents one virtual machine. The systems that are counted with virtual usage are stand-alone systems. In other words, they are virtual machines with no detectable hypervisor management, including no virt-who host-guest mapping data that is sent to the subscriptions service either through the Satellite inventory upload plugin or through Red Hat Subscription Management.
- Public cloud usage
The subscriptions service measures public cloud RHEL installations by socket.
The instances launched from public cloud RHEL images are recognized through Desktop Management Interfaces (DMI) fact-value pairs that are present in the image and instance metadata. The values of the DMI facts identify an instance as running in the cloud infrastructure provided by Amazon Web Services (AWS), Microsoft Azure, Google Cloud, and Alibaba Cloud. Other system profile facts are obtained from the cloud provider identity document (for example, the AWS instance identity document) and are combined with the DMI facts during the analysis of the instance. Each running instance is counted as running for the entire day and contributes a single socket to the socket count.
The cloud provider identity document includes system profile facts that help identify where an image was purchased. If an image is identified as being purchased directly from a cloud provider marketplace, the instances for that image do not contribute to the public cloud socket totals, do not count against your subscription threshold, and do not appear in the usage and utilization graph view. However, the systems that contain these types of RHEL instances do appear in the current instances table. In the table, you can identify the systems with cloud provider marketplace instances by a null value in the Sockets column, represented by double dashes (--). This null value indicates that these systems do not contribute usage data.
- Hypervisor usage
The subscriptions service measures hypervisor RHEL installations by CPU socket pairs. A system that is providing virt-who host-guest mapping data to the subscriptions service either through the Satellite inventory upload plugin or through Red Hat Subscription Management is classified as a hypervisor. Systems that are classified as hypervisors can have multi-guest virtual data center (VDC) subscriptions or have similar virtualized environments. Hypervisor usage is counted in the following ways:
- For a RHEL based hypervisor with RHEL guests, the socket count of the hypervisor is counted twice, with the socket-pair method. One count is for the node’s own copy of RHEL that is used as the operating system to run the hypervisor. A second count is for the RHEL that is used by the guest systems.
- For a non RHEL based hypervisor with RHEL guests, the socket count of the hypervisor is counted once, with the socket-pair method. The count is for the RHEL that is used by the guest systems.
Red Hat Enterprise Linux with a pay-as-you-go On-Demand subscription
The subscriptions service measures your RHEL pay-as-you-go On-Demand subscription usage in vCPU hours. A vCPU hour is a measurement of availability for computational activity on one virtual core (as defined by the subscription terms), for a total of one hour, measured to the granularity of the meter that is used. For RHEL pay-as-you-go On-Demand subscription usage, availability for computational activity is the availability of the RHEL instance over time.
Currently, Red Hat Enterprise Linux for Third Party Linux Migration with Extended Life Cycle Support Add-on is the only RHEL pay-as-you-go On-Demand subscription that is tracked by the subscriptions service.
17.3.2. Units of measurement for Red Hat OpenShift
Red Hat OpenShift Container Platform with an Annual subscription
The subscriptions service measures your Red Hat OpenShift usage in units of CPU cores or CPU sockets. For Red Hat OpenShift 4, the counting is aggregated at the cluster level, and for Red Hat OpenShift 3, the counting is aggregated at the node level. Currently, the subscriptions service cannot display a single, mixed-unit view of Red Hat OpenShift usage in environments that include core-based and socket-based clusters within the same account. You must use filtering to view that data in separate views.
You can use a filter to toggle the usage and capacity data between the two units of measurement. If subscription attributes are set on the cluster (through Red Hat OpenShift Cluster Manager for Red Hat OpenShift 4) or on the node (through the command to set the ocm.units value for Red Hat OpenShift 3), then that data can be reported by cores or sockets. If subscription attributes are not set or cannot be set, then the data is included in reports for both core-based and socket-based usage.
- Physical usage
The subscriptions service measures your core-based physical Red Hat OpenShift installations by actual core count. Socket-based physical installations are measured by socket pairs, so the count is rounded upwards to the next even number.
In the current instances table, an example of a physical system for Red Hat OpenShift is a Red Hat OpenShift cluster running on bare metal. Another example is a RHEL system reporting as a Red Hat OpenShift 3 cluster node.
- Virtual usage
The subscriptions service measures your core-based and socket-based installations by actual core and actual socket count.
In the current instances table, an example of a virtual system for Red Hat OpenShift is a cluster installed in environments such as Red Hat OpenStack Platform, Red Hat Virtualization, VMware vSphere, or on public cloud.
Red Hat OpenShift Container Platform and Red Hat OpenShift Dedicated with a pay-as-you-go On-Demand subscription
The subscriptions service measures your pay-as-you-go On-Demand subscription of Red Hat OpenShift Container Platform or Red Hat OpenShift Dedicated usage in core hours. A core hour is a unit of measurement for computational activity on one core (as defined by the subscription terms), for a total of one hour, measured to the granularity of the meter that is used.
- Physical usage
- The subscriptions service measures your core-based physical Red Hat OpenShift installations by actual core count. Socket-based physical installations are measured by socket pairs, so the count is rounded upwards to the next even number.
- Virtual usage
- The subscriptions service measures your core-based and vCPU-based virtual installations by actual core count, with vCPUs rationalized to cores using maximum efficiency. Socket-based virtual installations are measured by socket count as reported by your hypervisor. For best reporting, confirm that your hypervisor is reporting accurate socket counts for your virtual machines.
- Control plane usage
- For Red Hat OpenShift Dedicated On-Demand only, the subscriptions service also measures your cluster availability by instance hour. For Red Hat OpenShift Dedicated On-Demand, this instance hour calculation of control plane usage is based on a cluster hour unit of measurement.
Additional Red Hat OpenShift families, products, and add-ons
For Red Hat OpenShift families, products, and add-ons, measurement of usage is based on metrics that generally relate to the consumption of computing resources by the platform that powers the service.
Red Hat OpenShift Service on AWS Hosted Control Planes
The subscriptions service measures your pre-paid plus On-Demand subscription of Red Hat OpenShift Service on AWS Hosted Control Planes (ROSA Hosted Control Planes) usage in vCPU hours and in control plane hours.
- A vCPU hour is a measurement of availability for computational activity on one virtual core (as defined by the subscription terms) for a total of one hour, measured to the granularity of the meter that is used.
- A control plane hour is a measurement of the availability of the control plane. With ROSA Hosted Control Planes, each cluster has a dedicated control plane that is isolated in a ROSA Hosted Control Planes service account that is owned by Red Hat.
Red Hat OpenShift AI
The subscriptions service measures your pay-as-you-go On-Demand subscription of Red Hat OpenShift AI (RHOAI) usage in vCPU hours. A vCPU hour is a unit of measurement for computational activity on one virtual core (as defined by the subscription terms), for a total of one hour, measured to the granularity of the meter that is used.
Red Hat Advanced Cluster Security for Kubernetes
Red Hat Advanced Cluster Security for Kubernetes (RHACS) with a pay-as-you-go On-Demand subscription
The subscriptions service measures your pay-as-you-go On-Demand subscription of RHACS usage in vCPU hours. A vCPU hour is a unit of measurement for computational activity on one virtual core (as defined by the subscription terms), for a total of one hour, measured to the granularity of the meter that is used.
Red Hat Advanced Cluster Management for Kubernetes
The subscriptions service measures your pre-paid plus On-Demand subscription of RHACM usage in vCPU hours. A vCPU hour is a unit of measurement for computational activity on one virtual core (as defined by the subscription terms), for a total of one hour, measured to the granularity of the meter that is used.
17.3.3. Units of measurement for Red Hat Ansible
Red Hat Ansible Automation Platform, as a managed service
The subscriptions service measures your Red Hat Ansible Automation Platform usage in managed nodes and infrastructure hours.
- A managed node is a measurement of the number of unique managed nodes that are used within the monthly billing cycle, where the usage is tracked by the invoking of an Ansible task against that node.
- An infrastructure hour is a measurement of the availability of the Ansible Automation Platform infrastructure. Each deployment of Ansible Automation Platform has a dedicated control plane for infrastructure that is isolated in a service account that is owned and managed by Red Hat.
17.4. Filtering
You can further refine the subscriptions service data by selecting values from the available filters in the interface. When you select a filter option, the graph view (and in some cases, the tables in the table view) generally refreshes to show data that relates to that option. In other words, most of the filters are inclusive, not exclusive, for the selected option.
Filtering by time
For Annual subscriptions, you can filter data by several different time intervals, including daily (the default) and quarterly. For On-Demand subscriptions, you can filter by time interval only for the current month or by any other month in the previous 12 months. Because billing cycles for On-Demand subscriptions might vary across the different cloud provider marketplaces that you might purchase from, the calendar month interval is used in the subscriptions service to report On-Demand usage.
Filtering by time affects only the usage and utilization graph view. The current instances table and current subscriptions table views always show the most recent data that is available, whether from the most recent subscriptions service daily snapshot or from more frequent reporting offered by the monitoring stack tools, and is not affected by the time filter.
During the rapid development of the subscriptions service, the addition of new features is improving the scope and accuracy of this tool. The subscriptions service does not provide in-application capability to recalculate older usage and capacity data as these new features are being added. Therefore, the selection of a longer time interval could display results that contain inconsistencies.
Filtering by subscription attributes
You can use several filters to filter by subscription attributes, which is data that describes the characteristics and intended usage of subscription. The accuracy of those filters is dependent upon how accurately the subscription attribute data is set.
Subscription attributes might be configured from the operating system or its management tools, or from settings within the product itself. In these various tools, subscription attribute data is also known as system purpose, subscription settings, or similar names. In some cases, subscription attribute values might be derived from the subscription, such as when a subscription is sold either by sockets or cores.
You can use the subscriptions service filters to get a more focused view on usage that meets certain use cases within your subscription profile. For example, filtering your RHEL subscriptions by the SLA filter, which is the service level agreement, to show only those with an SLA of Premium could help you determine the current usage of premium subscriptions compared to your overall capacity for those premium subscriptions. In turn, this knowledge can inform decisions such as additional deployments, actions to mitigate subscription compliance issues, or future purchasing and renewals.
As another example, selecting a nonspecific value for a filter, such as the No SLA or Unspecified options, can help show subscriptions that have subscription attribute values that might be missing or that might be less common and not specifically filterable by the subscriptions service. For those subscriptions with missing subscription attributes, adding that data can improve the accuracy and usefulness of the subscriptions service reporting.
The subscriptions service provides the following filters and filter options for RHEL:
- SLA (service level agreement): Premium, Standard, Self-Support, No SLA
- Usage: Development/Test, Disaster Recovery, Production, Unspecified
The subscriptions service provides the following filter and filter options for Red Hat OpenShift:
- SLA (service level agreement): Premium, Standard, Self-Support, No SLA
- Cores: Cores (default), Sockets
If an offering is available as one subscription type only, such as with Red Hat OpenShift AI, filtering by subscription attributes is not available.
Filtering by type
You can use the Type filter to filter by the type of subscription usage when multiple types of subscription usage are tracked for a product. For example, the subscriptions service tracks RHEL physical, virtual, public cloud, and hypervisor usage to match the different infrastructure types for RHEL product deployment. This filter is different from the Usage filter that corresponds to subscription attribute (system purpose) usage.
The Type filter replaces previously available filtering of the graph display by the values in the legend of the usage and utilization graph.
Filtering by variant
You can use the Variant filter to filter on various aspects of a subscription that are appropriate for the product page that is displayed. For example, you can filter on architecture variants for RHEL or product variants for Satellite.
Filtering by name (current instances table)
You can filter the data in the current instances table by the contents of Name column, which shows either the display name or universally unique ID (UUID) of each system. To filter by name, use the search field near the Name column.
You can search for a specific system name or a group of similarly named systems. Exact and partial strings are accepted, but common wildcard characters are treated as literal characters, not special character wildcards.