Ce contenu n'est pas disponible dans la langue sélectionnée.
Chapter 1. Ceph dashboard overview
As a storage administrator, the Red Hat Ceph Storage Dashboard provides management and monitoring capabilities, allowing you to administer and configure the cluster, as well as visualize information and performance statistics related to it. The dashboard uses a web server hosted by the ceph-mgr daemon.
The dashboard is accessible from a web browser and includes many useful management and monitoring features, for example, to configure manager modules and monitor the state of OSDs.
The Ceph dashboard provides the following features:
- Multi-user and role management
The dashboard supports multiple user accounts with different permissions and roles. User accounts and roles can be managed using both, the command line and the web user interface. The dashboard supports various methods to enhance password security. Password complexity rules may be configured, requiring users to change their password after the first login or after a configurable time period.
For more information, see Managing roles on the Ceph Dashboard and Managing users on the Ceph dashboard.
- Single Sign-On (SSO)
The dashboard supports authentication with an external identity provider using the SAML 2.0 protocol.
For more information, see Enabling single sign-on for the Ceph dashboard.
- Auditing
The dashboard backend can be configured to log all PUT, POST and DELETE API requests in the Ceph manager log.
For more information about using the manager modules with the dashboard, see Viewing and editing the manager modules of the Ceph cluster on the dashboard.
Management features
The Red Hat Ceph Storage Dashboard includes various management features.
- Viewing cluster hierarchy
You can view the CRUSH map, for example, to determine which host a specific OSD ID is running on. This is helpful if an issue with an OSD occurs.
For more information, see Viewing the CRUSH map of the Ceph cluster on the dashboard.
- Configuring manager modules
You can view and change parameters for Ceph manager modules.
For more information, see Viewing and editing the manager modules of the Ceph cluster on the dashboard.
- Embedded Grafana dashboards
Ceph Dashboard Grafana dashboards might be embedded in external applications and web pages to surface information with Prometheus modules gathering the performance metrics.
For more information, see Ceph Dashboard components.
- Viewing and filtering logs
You can view event and audit cluster logs and filter them based on priority, keyword, date, or time range.
For more information, see Filtering logs of the Ceph cluster on the dashboard.
- Toggling dashboard components
You can enable and disable dashboard components so only the features you need are available.
For more information, see Toggling Ceph dashboard features.
- Managing OSD settings
You can set cluster-wide OSD flags using the dashboard. You can also Mark OSDs up, down or out, purge and reweight OSDs, perform scrub operations, modify various scrub-related configuration options, select profiles to adjust the level of backfilling activity. You can set and change the device class of an OSD, display and sort OSDs by device class. You can deploy OSDs on new drives and hosts.
For more information, see Managing Ceph OSDs on the dashboard.
- Viewing alerts
The alerts page allows you to see details of current alerts.
For more information, see Viewing alerts on the Ceph dashboard.
- Upgrading
You can upgrade the Ceph cluster version using the dashboard.
For more information, see Upgrading a cluster.
- Quality of service for images
You can set performance limits on images, for example limiting IOPS or read BPS burst rates.
For more information, see Managing block device images on the Ceph dashboard.
Monitoring features
Monitor different features from within the Red Hat Ceph Storage Dashboard.
- Username and password protection
You can access the dashboard only by providing a configurable username and password.
For more information, see Managing users on the Ceph dashboard.
- Overall cluster health
Displays performance and capacity metrics. This also displays the overall cluster status, storage utilization, for example, number of objects, raw capacity, usage per pool, a list of pools and their status and usage statistics.
For more information, see Viewing and editing the configuration of the Ceph cluster on the dashboard.
- Hosts
Provides a list of all hosts associated with the cluster along with the running services and the installed Ceph version.
For more information, see Monitoring hosts of the Ceph cluster on the dashboard.
- Performance counters
Displays detailed statistics for each running service.
For more information, see Monitoring services of the Ceph cluster on the dashboard.
- Monitors
Lists all Monitors, their quorum status and open sessions.
For more information, see Monitoring monitors of the Ceph cluster on the dashboard.
- Configuration editor
Displays all the available configuration options, their descriptions, types, default, and currently set values. These values are editable.
For more information, see Viewing and editing the configuration of the Ceph cluster on the dashboard.
- Cluster logs
Displays and filters the latest updates to the cluster’s event and audit log files by priority, date, or keyword.
For more information, see Filtering logs of the Ceph cluster on the dashboard.
- Device management
Lists all hosts known by the Orchestrator. Lists all drives attached to a host and their properties. Displays drive health predictions, SMART data, and blink enclosure LEDs.
For more information, see Monitoring hosts of the Ceph cluster on the dashboard.
- View storage cluster capacity
You can view raw storage capacity of the Red Hat Ceph Storage cluster in the Capacity pages of the Ceph dashboard.
For more information, see Understanding the landing page of the Ceph dashboard.
- Pools
Lists and manages all Ceph pools and their details. For example: applications, placement groups, replication size, EC profile, quotas, and CRUSH ruleset.
For more information, see Understanding the landing page of the Ceph dashboard and Monitoring pools of the Ceph cluster on the dashboard.
- OSDs
Lists and manages all OSDs, their status, and usage statistics. OSDs also lists detailed information, for example, attributes, OSD map, metadata, and performance counters for read and write operations. OSDs also lists all drives that are associated with an OSD.
For more information, see Monitoring Ceph OSDs on the dashboard.
- Images
Lists all Ceph Block Device (RBD) images and their properties such as size, objects, and features. Create, copy, modify and delete RBD images. Create, delete, and rollback snapshots of selected images, protect or unprotect these snapshots against modification. Copy or clone snapshots, flatten cloned images.
NoteThe performance graph for I/O changes in the Overall Performance tab for a specific image shows values only after specifying the pool that includes that image by setting the
rbd_stats_poolparameter in Cluster→Manager modules→Prometheus.For more information, see Monitoring block device images on the Ceph dashboard.
- Block device mirroring
Enables and configures Ceph Block Device (RBD) mirroring to a remote Ceph server. Lists all active sync daemons and their status, pools and RBD images including their synchronization state.
For more information, see Mirroring view on the Ceph dashboard.
- Ceph File Systems
Lists all active Ceph File System (CephFS) clients and associated pools, including their usage statistics. Evict active CephFS clients, manage CephFS quotas and snapshots, and browse a CephFS directory structure.
For more information, see Monitoring Ceph file systems on the dashboard.
- Object Gateway (RGW)
Lists all active object gateways and their performance counters. Displays and manages, including add, edit, and delete, Ceph Object Gateway users and their details, for example quotas, as well as the users’ buckets and their details, for example, owner or quotas.
For more information, see Monitoring Ceph Object Gateway daemons on the dashboard.
Security features
The dashboard provides the following security features.
- SSL and TLS support
All HTTP communication between the web browser and the dashboard is secured via SSL. A self-signed certificate can be created with a built-in command, but it is also possible to import custom certificates signed and issued by a Certificate Authority (CA).
For more information, see Ceph Dashboard installation and access.
Prerequisites
- System administrator level experience.
1.1. Ceph Dashboard components
The functionality of the dashboard is provided by multiple components.
- The Cephadm application for deployment.
-
The embedded dashboard
ceph-mgrmodule. -
The embedded Prometheus
ceph-mgrmodule. - The Prometheus time-series database.
- The Prometheus node-exporter daemon, running on each host of the storage cluster.
- The Grafana platform to provide monitoring user interface and alerting.
- The node-proxy agent, a background service on all nodes that collects hardware health data from Out-of-Band (OOB) interfaces like iLO. The hardware monitoring capability is enabled by default in IBM Storage Ceph Ceph 7.1, allowing users to view related data in the Dashboard or logs without manual configuration.
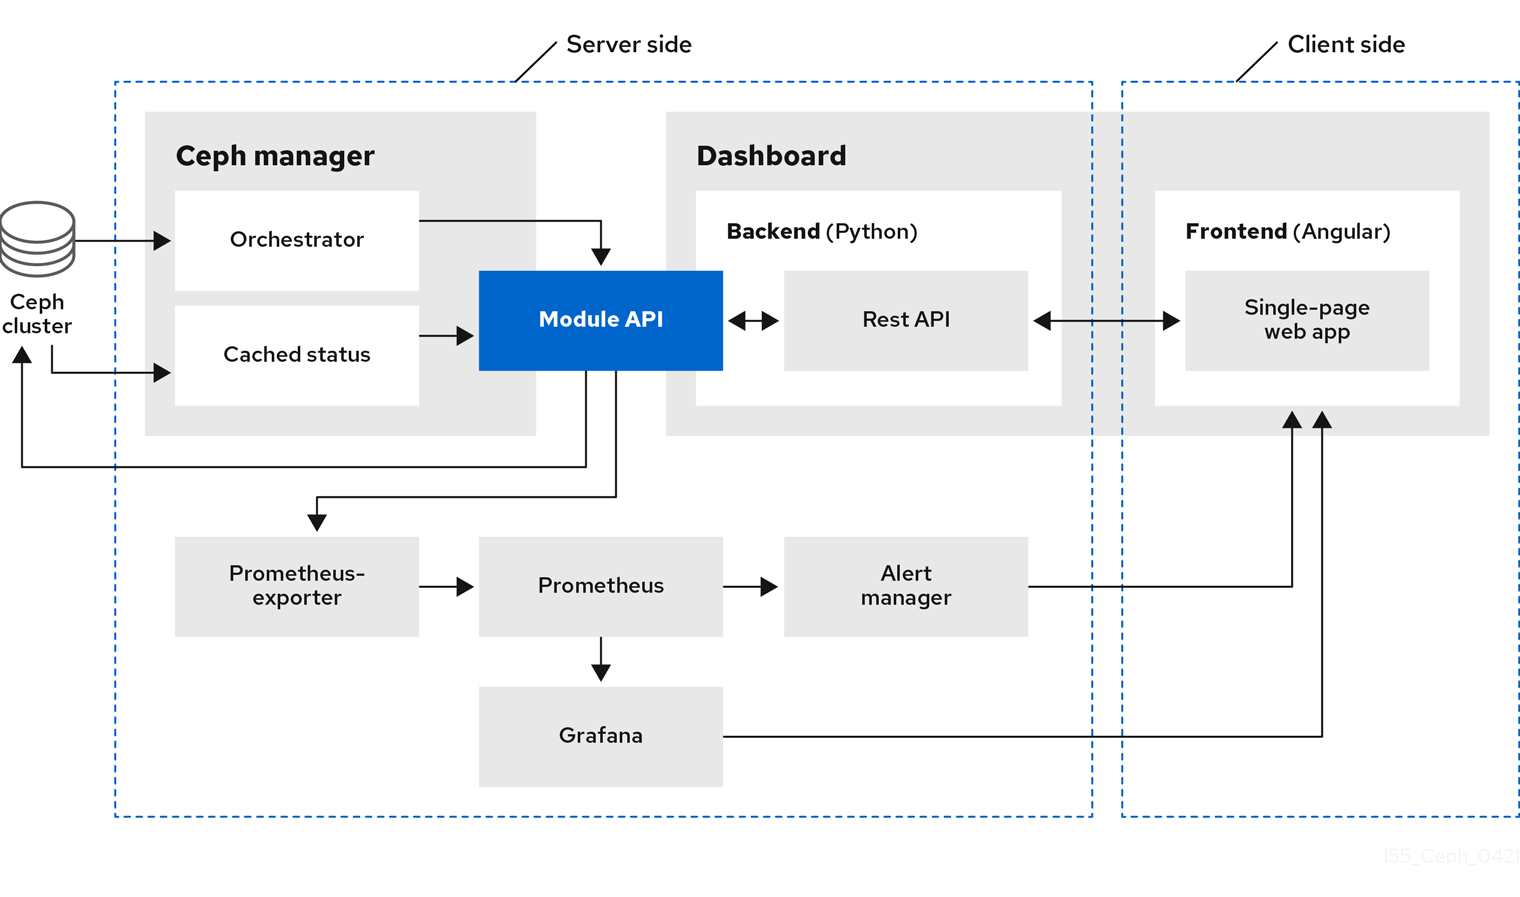
1.2. Red Hat Ceph Storage Dashboard architecture
The Dashboard architecture depends on the Ceph manager dashboard plugin and other components. See the following diagram to understand how the Ceph manager and dashboard work together.