支持
第 1 章 支持概述
红帽提供了集群管理员工具,用于为集群、监控和故障排除收集数据。
1.1. 获得支持
获取支持 :访问红帽客户门户网站查看知识库文章、提交支持问题单以及查看其他产品文档和资源。
1.2. 远程健康监控问题
远程健康监控问题 :OpenShift Dedicated 会收集有关集群的遥测和配置数据,并使用 Telemeter Client 和 Insights Operator 向红帽报告。红帽使用此数据了解并解决 连接的集群中的问题。OpenShift Dedicated 使用以下方法收集数据和监控健康状况:
Telemetry :遥测客户端收集并每 4 分 30 秒将标值上传至红帽。红帽将此数据用于:
- 监控集群。
- 推出 OpenShift Dedicated 升级。
- 改进升级体验。
Insights Operator :默认情况下,OpenShift Dedicated 安装并启用 Insights Operator,该 Operator 每两小时报告配置和组件故障状态。Insights Operator 有助于:
- 主动识别潜在的集群问题。
- 在 Red Hat OpenShift Cluster Manager 中提供解决方案和预防性操作。
您可以查看遥测信息。
如果您启用了远程健康报告,请使用 Red Hat Lightspeed 识别集群中的问题。您可以选择禁用远程健康报告。
1.3. 收集有关集群的数据
收集有关集群的数据 :红帽建议在打开支持问题单时收集您的调试信息。这有助于红帽支持执行根本原因分析。集群管理员可以使用以下方法收集有关集群的数据:
-
must-gather 工具 :使用
must-gather工具来收集有关集群的信息并调试问题。 -
sosreport :使用
sosreport工具收集配置详情、系统信息和诊断数据用于调试目的。 - 集群 ID :在向红帽支持提供信息时,获取集群的唯一标识符。
-
集群节点 journal 日志 :收集
journald单元日志和独立集群节点上的/var/log中的日志,以排除与节点相关的问题。 - 网络追踪 :从特定的 OpenShift Dedicated 集群节点或容器提供给红帽支持提供网络数据包追踪,以帮助排除与网络相关的问题。
1.4. 故障排除问题
集群管理员可以监控并排除以下 OpenShift Dedicated 组件问题:
节点问题 :集群管理员可以通过查看节点的状态、资源使用量和配置来验证和排除节点相关问题。您可以查询以下内容:
- 节点上的 kubelet 状态。
- 集群节点日志.
Operator 问题 :集群管理员可以执行以下操作来解决 Operator 问题:
- 验证 Operator 订阅状态。
- 检查 Operator pod 健康状况。
- 收集 Operator 日志。
Pod 问题 :集群管理员可以通过查看 pod 的状态并完成以下内容来排除与 pod 相关的问题:
- 查看 pod 和容器日志。
- 启动具有 root 访问权限的 debug pod。
Source-to-image 问题 :集群管理员可以观察 S2I 阶段,以确定 S2I 进程中的故障发生位置。收集以下内容来解决 Source-to-Image(S2I)问题:
- Source-to-Image 诊断数据。
- 用于调查应用程序故障的应用程序诊断数据。
存储问题 :当无法在新节点中挂载卷时,会发生多附加存储错误,因为失败的节点无法卸载附加的卷。集群管理员可执行以下操作解决多附加存储问题:
- 使用 RWX 卷启用多个附件。
- 使用 RWO 卷时,恢复或删除故障节点。
监控问题 :集群管理员可按照监控故障排除页面中的步骤进行操作。如果您的用户定义的项目的指标不可用,或者 Prometheus 消耗了大量磁盘空间,请检查以下内容:
- 调查用户定义的指标不可用的原因。
- 确定为什么 Prometheus 消耗大量磁盘空间。
-
OpenShift CLI (
oc)问题 :通过增加日志级别来调查 OpenShift CLI (oc) 问题。
第 2 章 管理集群资源
您可以在 OpenShift Dedicated 中应用全局配置选项。Operator 在集群中应用这些配置设置。
2.1. 与集群资源交互
您可以使用 OpenShift Dedicated 中的 OpenShift CLI(oc)工具与集群资源交互。运行 oc api-resources 命令后看到的集群资源可以被编辑。
先决条件
-
您可以使用具有
dedicated-admin角色的用户访问集群。 -
您可以访问 web 控制台或已安装了
ocCLI 工具。
流程
要查看应用了哪些配置 Operator,请运行以下命令:
$ oc api-resources -o name | grep config.openshift.io要查看您可以配置的集群资源,请运行以下命令:
$ oc explain <resource_name>.config.openshift.io要查看集群中的自定义资源定义(CRD)对象配置,请运行以下命令:
$ oc get <resource_name>.config -o yaml要编辑集群资源配置,请运行以下命令:
$ oc edit <resource_name>.config -o yaml
第 3 章 获取支持
3.1. 获取支持
如果您在执行本文档所述的某个流程或 OpenShift Dedicated 时遇到问题,请访问红帽客户门户。
通过红帽客户门户网站:
- 搜索或者浏览红帽知识库,了解与红帽产品相关的文章和解决方案。
- 提交问题单给红帽支持。
- 访问其他产品文档。
要识别集群中的问题,您可以在 OpenShift Cluster Manager 中使用 Red Hat Lightspeed。红帽 Lightspeed 提供有关问题的详细信息,如果有,提供了有关如何解决问题的信息。
如果您对本文档有任何改进建议,或发现了任何错误,请为相关文档组件提交 JIRA 问题。请提供具体详情,如章节名称和 OpenShift Dedicated 版本。
3.2. 关于红帽知识库
红帽知识库提供丰富的内容以帮助您最大程度地利用红帽的产品和技术。红帽知识库包括文章、产品文档和视频,概述了安装、配置和使用红帽产品的最佳实践。另外,您还可以搜索已知问题的解决方案,其提供简洁的根原因描述和补救措施。
3.3. 搜索红帽知识库
如果出现 OpenShift Dedicated 问题,您可以执行初始搜索来确定红帽知识库中是否已存在解决方案。
先决条件
- 您有红帽客户门户网站帐户。
流程
- 登录到 红帽客户门户网站。
- 点 Search。
在搜索字段中,输入与问题相关的关键字和字符串,包括:
- OpenShift Dedicated 组件(如 etcd)
- 相关步骤(比如 安装)
- 警告、错误消息和其他与输出与特定的问题相关
- 点 Enter 键。
- 可选:选择 OpenShift Dedicated 产品过滤器。
- 可选: 选择 Documentation 内容类型过滤器。
3.4. 提交支持问题单
先决条件
-
您可以使用具有
dedicated-admin角色的用户访问集群。 -
已安装 OpenShift CLI(
oc)。 - 您可以访问 Red Hat OpenShift Cluster Manager。
流程
- 登录到红帽客户门户网站的客户支持 页面。
- 点 Get support。
在 客户支持 页面的 Cases 选项卡中:
- 可选:根据需要更改预先填充的帐户和所有者详情。
- 为您的问题选择适当的类别,如 Bug 或 Defect,然后点 Continue。
输入以下信息:
- 在 Summary 字段中,输入简要但描述性问题概述,以及有关所经历的症状的详细信息,以及您的预期。
- 从 Product 下拉菜单中选择 OpenShift Dedicated。
- 查看推荐的红帽知识库解决方案列表,它们可能会与您要报告的问题相关。如果建议的文章没有解决这个问题,请点 Continue。
- 查看更新的推荐红帽知识库解决方案列表,它们可能会与您要报告的问题相关。这个列表的范围会缩小,因为您在创建问题单的过程中提供了更多信息。如果建议的文章没有解决这个问题,请点 Continue。
- 请确保提供的帐户信息是正确的,如果需要,请相应调整。
检查自动填充的 OpenShift Dedicated 集群 ID 是否正确。如果不正确,请手动提供集群 ID。
使用 OpenShift Cluster Manager 手动获取集群 ID:
- 导航到 Cluster List。
- 点您需要为其创建一个支持问题单的集群名称。
- 在 Overview 选项卡的 Details 部分的 Cluster ID 字段中找到值。
使用 OpenShift Dedicated Web 控制台手动获取集群 ID:
- 进入到 Home → Overview。
- 该值包括在 Details 中的 Cluster ID 项中。
另外,也可以通过 OpenShift Dedicated Web 控制台创建新的支持问题单,并自动填充集群 ID。
- 从工具栏导航至 (?)help → Open Support Case。
- Cluster ID 的值会被自动填充 。
要使用 OpenShift CLI(
oc)获取集群 ID,请运行以下命令:$ oc get clusterversion -o jsonpath='{.items[].spec.clusterID}{"\n"}'
完成以下提示的问题,点 Continue:
- 您遇到什么情况?您期望发生什么情况?
- 对业务的影响价值。
- 您在哪里遇到此行为?什么环境?
- 此行为何时发生?发生频率?重复发生?是否只在特定时间发生?
- 上传相关的诊断数据文件并点击 Continue。
- 输入相关问题单管理详情,点 Continue。
- 预览问题单详情,点 Submit。
第 4 章 通过连接集群进行远程健康监控
4.1. 关于远程健康监控
OpenShift Dedicated 收集集群的遥测和配置数据,并使用 Telemeter Client 和 Insights Operator 向红帽报告。提供给红帽的数据可实现本文档概述的好处。
通过 Telemetry 和 Insights Operator 向红帽报告数据的集群被称为连接的集群 (connected cluster)。
Telemetry 是红帽用来描述 OpenShift Dedicated Telemeter 客户端向红帽发送的信息的术语。轻量级属性从连接的集群发送到红帽,以便启用订阅管理自动化、监控集群的健康状态、提供支持以及改进客户体验。
Insights Operator 收集 OpenShift Dedicated 配置数据并将其发送到红帽。这些数据用于生成有关集群可能潜在存在的问题的分析报告。这些 insights 通过 OpenShift Cluster Manager 与集群管理员进行交流。
本文档中提供了有关这两个工具的更多信息。
Telemetry 和 Insights Operator 的优点
Telemetry 和 Insights Operator 为最终用户提供以下优点:
- 增强了识别和解决问题的能力。对于一些事件,最终用户可能会认为是正常的,但从更广泛深入的角度来说,红帽会对这些事件的影响有不同的评估。因此,一些问题可以被更快地识别并解决,而不需要用户创建一个支持问题单或 Jira issue。
-
高级的版本管理。OpenShift Dedicated 提供
candidate、fast和stable发行频道,供您选择一个更新策略。版本从fast到stable的过程取决于更新的速度以及升级过程中的事件。通过连接的集群提供的信息,红帽可以将发行版本质量提高到stable频道,并对在fast频道中发现的问题做出更快反应。 - 有针对性地对新功能的开发进行优先级排序。收集的数据可让您了解哪些 OpenShift Dedicated 区域被使用最多使用。通过这些信息,红帽可以专注于开发对客户有严重影响的新功能。
- 更好的支持体验。在红帽客户门户网站上创建支持问题单时,可以为连接的集群提供集群 ID。这可让红帽通过使用连接的信息,简化用户的支持体验。本文档提供有关改进的支持体验的更多信息。
- 预测分析。通过从连接的集群收集的信息,在 OpenShift Cluster Manager 上显示集群的 insights 会被启用。红帽正在努力应用深入学习、机器学习和智能自动化,以帮助识别 OpenShift Dedicated 集群暴露的问题。
在 OpenShift Dedicated 中,远程健康报告总是被启用。您不能选择不使用它。
4.1.1. 关于 Telemetry
Telemetry 会向红帽发送一组精选的集群监控指标子集。Telemeter 客户端每四分三十秒获取一次指标值,并将数据上传到红帽。本文档中描述了这些指标。
红帽使用这一数据流来实时监控集群,必要时将对影响客户的问题做出反应。它同时还有助于红帽向客户推出 OpenShift Dedicated 升级,以便最大程度降低服务影响,持续改进升级体验。
这类调试信息将提供给红帽支持和工程团队,其访问限制等同于访问通过问题单报告的数据。红帽利用所有连接集群信息来帮助改进 OpenShift Dedicated,提高其易用性。
4.1.1.1. Telemetry 收集的信息
Telemetry 收集以下信息:
4.1.1.1.1. 系统信息
- 版本信息,包括 OpenShift Dedicated 集群版本并安装了用于决定更新版本可用性的更新详情
- 更新信息,包括每个集群可用的更新数、用于更新的频道和镜像存储库、更新进度信息以及更新中发生的错误数
- 安装期间生成的唯一随机标识符
- 帮助红帽支持为客户提供有用支持的配置详情,包括云基础架构级别的节点配置、主机名、IP 地址、Kubernetes pod 名称、命名空间和服务
- 在集群中安装的 OpenShift Dedicated 框架组件及其状况和状态
- 为降级 Operator 列出为 "related objects" 的所有命名空间的事件
- 有关降级软件的信息
- 有关证书的有效性的信息
- 部署 OpenShift Dedicated 的供应商平台的名称及数据中心位置
4.1.1.1.2. 大小信息
- 有关集群、机器类型和机器的大小信息,包括 CPU 内核数和每个机器所使用的 RAM 量
- etcd 成员数和存储在 etcd 集群中的对象数量
4.1.1.1.3. 使用信息
- 有关组件、功能和扩展的使用情况信息
- 有关技术预览和不受支持配置的使用详情
Telemetry 不会收集任何身份识别的信息,如用户名或密码。红帽不会收集个人信息。如果红帽发现个人信息被意外地收到,红帽会删除这些信息。有关红帽隐私实践的更多信息,请参考红帽隐私声明。
4.1.1.2. 用户 Telemetry
红帽从浏览器收集匿名用户数据。这种匿名数据包括启用了遥测功能的所有集群的用户的页面、功能和资源类型。
其他注意事项:
- 用户事件被,作为一个 SHA-1 哈希。
-
用户的 IP 地址保存为
0.0.0.0。 - 用户名和 IP 地址永远不会保存为单独的值。
4.1.2. 关于 Insights Operator
Insights Operator 会定期收集配置和组件故障状态,并默认每两小时向红帽报告这些数据。这些信息可让红帽评估配置,以及比 Telemetry 报告更深入的失败数据。
OpenShift Dedicated 用户可以在 Red Hat Hybrid Cloud Console 上的 Advisor 服务中显示每个集群的报告。如果发现了任何问题,红帽 Lightspeed 会提供更详细的信息,如果可用,如何解决问题的步骤。
Insights Operator 不会收集任何身份识别信息,如用户名、密码或证书。有关 Red Hat Lightspeed 数据收集和控制的信息,请参阅 Red Hat Lightspeed 数据和应用程序安全性。
红帽使用所有连接的集群信息以实现:
- 识别潜在的集群问题,并在 Red Hat Hybrid Cloud Console 上的 Advisor 服务中提供解决方案和防止操作
- 通过为产品和支持团队提供聚合和重要信息来改进 OpenShift Dedicated
- 使 OpenShift Dedicated 更直观
4.1.2.1. Insights Operator 收集的信息
Insights Operator 收集以下信息:
- 有关集群及其组件的常规信息,以识别特定于 OpenShift Dedicated 版本和环境的问题。
- 集群的配置文件(如镜像 registry 配置)来确定设置参数不正确的设置和问题。
- 集群组件中发生的错误。
- 运行更新的进度信息,以及任何组件升级的状态。
- 部署 OpenShift Dedicated 的平台以及集群所在区域的详情
-
如果 Operator 报告了一个问题,则会收集
openshift-*和kube-*项目中 OpenShift Dedicated 核心 pod 的信息。这包括状态、资源、安全上下文、卷信息等。
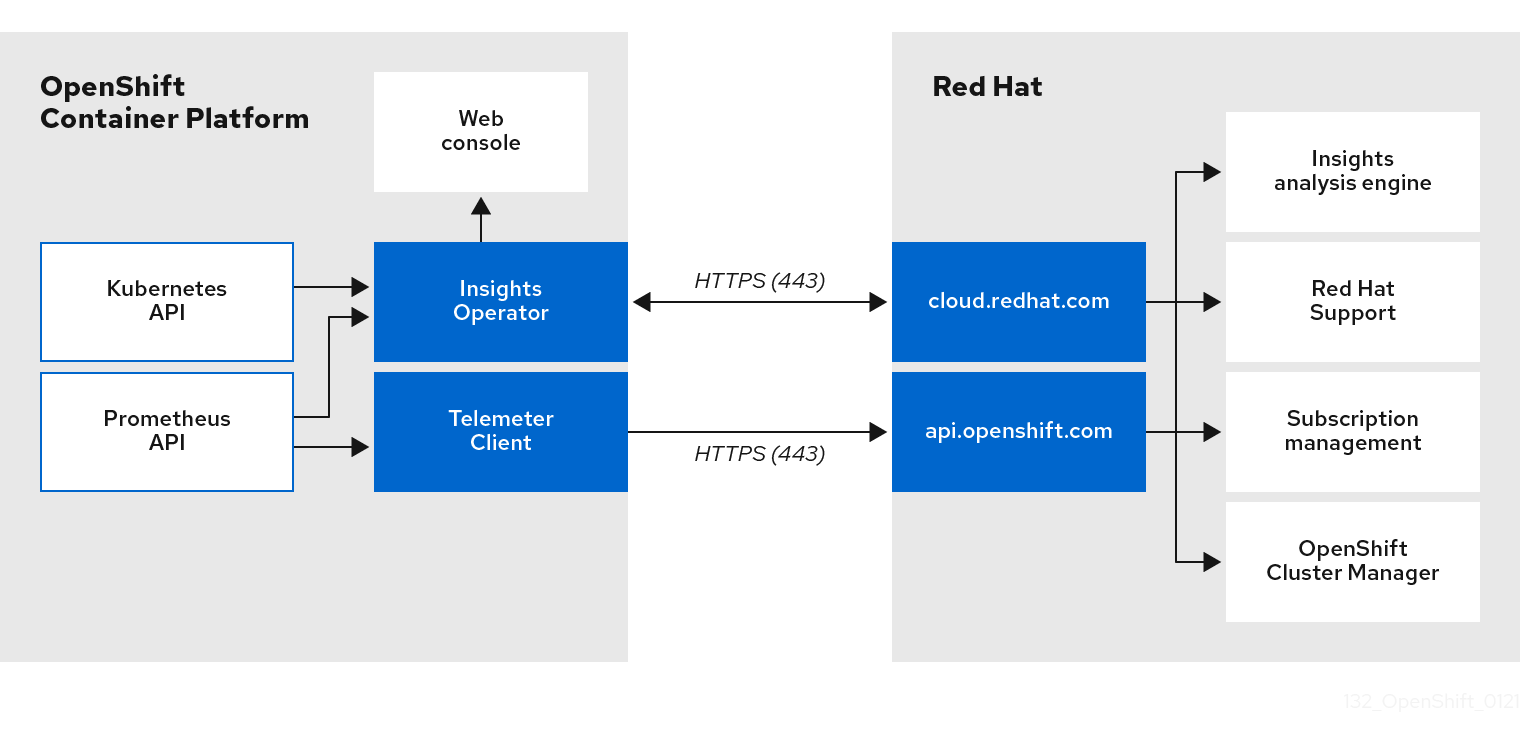
4.1.3. 了解 Telemetry 和 Insights Operator 数据流
Telemeter Client 从 Prometheus API 收集所选的时间序列数据。时间序列数据每 4 分 30 秒上传到 api.openshift.com 进行处理。
Insights Operator 从 Kubernetes API 和 Prometheus API 中收集所选的数据并进行存档。该归档每两小时上传到 OpenShift Cluster Manager 进行处理。Insights Operator 还从 OpenShift Cluster Manager 下载最新的 Red Hat Lightspeed 分析。这用于填充 OpenShift Dedicated Web 控制台的 Overview 页面中包含的 Red Hat Lightspeed 状态 弹出窗口。
所有与红帽的通信都使用传输层安全(TLS)和 mutual 证书验证通过加密频道进行。所有数据在传输及非活跃的情况下都会被加密。
对处理客户数据的系统是通过多因素验证和严格的授权控制来控制的。访问权限的设置是基于需要的,仅限于针对需要的操作。
telemetry 和 Insights Operator 数据流
4.1.4. 有关如何使用远程健康监控数据的更多详情
Telemetry 收集的信息和Insights Operator 收集的信息中提供了与启用健康检查健康相关的数据收集的信息。
如本文档前面部分所述,红帽会收集您使用红帽产品的数据,如提供支持和升级、优化性能或配置、减小服务影响、识别和补救威胁、故障排除、改进提供和用户体验、响应问题、根据情况提供账单目的。
集合保护
红帽采用一些技术和机构措施来保护遥测数据和配置数据。
共享
红帽可能会在红帽内部通过 Telemetry 和 Insights Operator 共享收集的数据,以改进您的用户体验。红帽可能会以汇总的形式与业务合作伙伴共享遥测和配置数据,它们无法辨别客户更好地了解其市场及其客户对红帽产品的使用,或者确保成功集成这些合作伙伴支持的产品。
第三方
红帽可能会与某些第三方合作,协助收集、分析和存储遥测和配置数据。
4.2. 显示远程健康监控收集的数据
用户控制/启用和禁用遥测和配置数据收集
作为管理员,您可以查看 Telemetry 和 Insights Operator 收集的指标。
4.2.1. 显示 Telemetry 收集的数据
您可以查看 Telemetry 收集的集群和组件的时间序列数据。
前提条件
-
已安装 OpenShift Container Platform CLI (
oc)。 -
您可以使用具有
dedicated-admin角色的用户访问集群。
流程
- 登录到集群。
- 运行以下命令,它会查询集群的 Prometheus 服务并返回由 Telemetry 收集的完整时间序列数据集合:
以下示例包含特定于 AWS 上的 OpenShift Dedicated 的一些值。
$ curl -G -k -H "Authorization: Bearer $(oc whoami -t)" \
https://$(oc get route prometheus-k8s-federate -n \
openshift-monitoring -o jsonpath="{.spec.host}")/federate \
--data-urlencode 'match[]={__name__=~"cluster:usage:.*"}' \
--data-urlencode 'match[]={__name__="count:up0"}' \
--data-urlencode 'match[]={__name__="count:up1"}' \
--data-urlencode 'match[]={__name__="cluster_version"}' \
--data-urlencode 'match[]={__name__="cluster_version_available_updates"}' \
--data-urlencode 'match[]={__name__="cluster_version_capability"}' \
--data-urlencode 'match[]={__name__="cluster_operator_up"}' \
--data-urlencode 'match[]={__name__="cluster_operator_conditions"}' \
--data-urlencode 'match[]={__name__="cluster_version_payload"}' \
--data-urlencode 'match[]={__name__="cluster_installer"}' \
--data-urlencode 'match[]={__name__="cluster_infrastructure_provider"}' \
--data-urlencode 'match[]={__name__="cluster_feature_set"}' \
--data-urlencode 'match[]={__name__="instance:etcd_object_counts:sum"}' \
--data-urlencode 'match[]={__name__="ALERTS",alertstate="firing"}' \
--data-urlencode 'match[]={__name__="code:apiserver_request_total:rate:sum"}' \
--data-urlencode 'match[]={__name__="cluster:capacity_cpu_cores:sum"}' \
--data-urlencode 'match[]={__name__="cluster:capacity_memory_bytes:sum"}' \
--data-urlencode 'match[]={__name__="cluster:cpu_usage_cores:sum"}' \
--data-urlencode 'match[]={__name__="cluster:memory_usage_bytes:sum"}' \
--data-urlencode 'match[]={__name__="openshift:cpu_usage_cores:sum"}' \
--data-urlencode 'match[]={__name__="openshift:memory_usage_bytes:sum"}' \
--data-urlencode 'match[]={__name__="workload:cpu_usage_cores:sum"}' \
--data-urlencode 'match[]={__name__="workload:memory_usage_bytes:sum"}' \
--data-urlencode 'match[]={__name__="cluster:virt_platform_nodes:sum"}' \
--data-urlencode 'match[]={__name__="cluster:node_instance_type_count:sum"}' \
--data-urlencode 'match[]={__name__="cnv:vmi_status_running:count"}' \
--data-urlencode 'match[]={__name__="cluster:vmi_request_cpu_cores:sum"}' \
--data-urlencode 'match[]={__name__="node_role_os_version_machine:cpu_capacity_cores:sum"}' \
--data-urlencode 'match[]={__name__="node_role_os_version_machine:cpu_capacity_sockets:sum"}' \
--data-urlencode 'match[]={__name__="subscription_sync_total"}' \
--data-urlencode 'match[]={__name__="olm_resolution_duration_seconds"}' \
--data-urlencode 'match[]={__name__="csv_succeeded"}' \
--data-urlencode 'match[]={__name__="csv_abnormal"}' \
--data-urlencode 'match[]={__name__="cluster:kube_persistentvolumeclaim_resource_requests_storage_bytes:provisioner:sum"}' \
--data-urlencode 'match[]={__name__="cluster:kubelet_volume_stats_used_bytes:provisioner:sum"}' \
--data-urlencode 'match[]={__name__="ceph_cluster_total_bytes"}' \
--data-urlencode 'match[]={__name__="ceph_cluster_total_used_raw_bytes"}' \
--data-urlencode 'match[]={__name__="ceph_health_status"}' \
--data-urlencode 'match[]={__name__="odf_system_raw_capacity_total_bytes"}' \
--data-urlencode 'match[]={__name__="odf_system_raw_capacity_used_bytes"}' \
--data-urlencode 'match[]={__name__="odf_system_health_status"}' \
--data-urlencode 'match[]={__name__="job:ceph_osd_metadata:count"}' \
--data-urlencode 'match[]={__name__="job:kube_pv:count"}' \
--data-urlencode 'match[]={__name__="job:odf_system_pvs:count"}' \
--data-urlencode 'match[]={__name__="job:ceph_pools_iops:total"}' \
--data-urlencode 'match[]={__name__="job:ceph_pools_iops_bytes:total"}' \
--data-urlencode 'match[]={__name__="job:ceph_versions_running:count"}' \
--data-urlencode 'match[]={__name__="job:noobaa_total_unhealthy_buckets:sum"}' \
--data-urlencode 'match[]={__name__="job:noobaa_bucket_count:sum"}' \
--data-urlencode 'match[]={__name__="job:noobaa_total_object_count:sum"}' \
--data-urlencode 'match[]={__name__="odf_system_bucket_count", system_type="OCS", system_vendor="Red Hat"}' \
--data-urlencode 'match[]={__name__="odf_system_objects_total", system_type="OCS", system_vendor="Red Hat"}' \
--data-urlencode 'match[]={__name__="noobaa_accounts_num"}' \
--data-urlencode 'match[]={__name__="noobaa_total_usage"}' \
--data-urlencode 'match[]={__name__="console_url"}' \
--data-urlencode 'match[]={__name__="cluster:ovnkube_master_egress_routing_via_host:max"}' \
--data-urlencode 'match[]={__name__="cluster:network_attachment_definition_instances:max"}' \
--data-urlencode 'match[]={__name__="cluster:network_attachment_definition_enabled_instance_up:max"}' \
--data-urlencode 'match[]={__name__="cluster:ingress_controller_aws_nlb_active:sum"}' \
--data-urlencode 'match[]={__name__="cluster:route_metrics_controller_routes_per_shard:min"}' \
--data-urlencode 'match[]={__name__="cluster:route_metrics_controller_routes_per_shard:max"}' \
--data-urlencode 'match[]={__name__="cluster:route_metrics_controller_routes_per_shard:avg"}' \
--data-urlencode 'match[]={__name__="cluster:route_metrics_controller_routes_per_shard:median"}' \
--data-urlencode 'match[]={__name__="cluster:openshift_route_info:tls_termination:sum"}' \
--data-urlencode 'match[]={__name__="insightsclient_request_send_total"}' \
--data-urlencode 'match[]={__name__="cam_app_workload_migrations"}' \
--data-urlencode 'match[]={__name__="cluster:apiserver_current_inflight_requests:sum:max_over_time:2m"}' \
--data-urlencode 'match[]={__name__="cluster:alertmanager_integrations:max"}' \
--data-urlencode 'match[]={__name__="cluster:telemetry_selected_series:count"}' \
--data-urlencode 'match[]={__name__="openshift:prometheus_tsdb_head_series:sum"}' \
--data-urlencode 'match[]={__name__="openshift:prometheus_tsdb_head_samples_appended_total:sum"}' \
--data-urlencode 'match[]={__name__="monitoring:container_memory_working_set_bytes:sum"}' \
--data-urlencode 'match[]={__name__="namespace_job:scrape_series_added:topk3_sum1h"}' \
--data-urlencode 'match[]={__name__="namespace_job:scrape_samples_post_metric_relabeling:topk3"}' \
--data-urlencode 'match[]={__name__="monitoring:haproxy_server_http_responses_total:sum"}' \
--data-urlencode 'match[]={__name__="rhmi_status"}' \
--data-urlencode 'match[]={__name__="status:upgrading:version:rhoam_state:max"}' \
--data-urlencode 'match[]={__name__="state:rhoam_critical_alerts:max"}' \
--data-urlencode 'match[]={__name__="state:rhoam_warning_alerts:max"}' \
--data-urlencode 'match[]={__name__="rhoam_7d_slo_percentile:max"}' \
--data-urlencode 'match[]={__name__="rhoam_7d_slo_remaining_error_budget:max"}' \
--data-urlencode 'match[]={__name__="cluster_legacy_scheduler_policy"}' \
--data-urlencode 'match[]={__name__="cluster_master_schedulable"}' \
--data-urlencode 'match[]={__name__="che_workspace_status"}' \
--data-urlencode 'match[]={__name__="che_workspace_started_total"}' \
--data-urlencode 'match[]={__name__="che_workspace_failure_total"}' \
--data-urlencode 'match[]={__name__="che_workspace_start_time_seconds_sum"}' \
--data-urlencode 'match[]={__name__="che_workspace_start_time_seconds_count"}' \
--data-urlencode 'match[]={__name__="cco_credentials_mode"}' \
--data-urlencode 'match[]={__name__="cluster:kube_persistentvolume_plugin_type_counts:sum"}' \
--data-urlencode 'match[]={__name__="visual_web_terminal_sessions_total"}' \
--data-urlencode 'match[]={__name__="acm_managed_cluster_info"}' \
--data-urlencode 'match[]={__name__="cluster:vsphere_vcenter_info:sum"}' \
--data-urlencode 'match[]={__name__="cluster:vsphere_esxi_version_total:sum"}' \
--data-urlencode 'match[]={__name__="cluster:vsphere_node_hw_version_total:sum"}' \
--data-urlencode 'match[]={__name__="openshift:build_by_strategy:sum"}' \
--data-urlencode 'match[]={__name__="rhods_aggregate_availability"}' \
--data-urlencode 'match[]={__name__="rhods_total_users"}' \
--data-urlencode 'match[]={__name__="instance:etcd_disk_wal_fsync_duration_seconds:histogram_quantile",quantile="0.99"}' \
--data-urlencode 'match[]={__name__="instance:etcd_mvcc_db_total_size_in_bytes:sum"}' \
--data-urlencode 'match[]={__name__="instance:etcd_network_peer_round_trip_time_seconds:histogram_quantile",quantile="0.99"}' \
--data-urlencode 'match[]={__name__="instance:etcd_mvcc_db_total_size_in_use_in_bytes:sum"}' \
--data-urlencode 'match[]={__name__="instance:etcd_disk_backend_commit_duration_seconds:histogram_quantile",quantile="0.99"}' \
--data-urlencode 'match[]={__name__="appsvcs:cores_by_product:sum"}' \
--data-urlencode 'match[]={__name__="nto_custom_profiles:count"}' \
--data-urlencode 'match[]={__name__="openshift_csi_share_configmap"}' \
--data-urlencode 'match[]={__name__="openshift_csi_share_secret"}' \
--data-urlencode 'match[]={__name__="openshift_csi_share_mount_failures_total"}' \
--data-urlencode 'match[]={__name__="openshift_csi_share_mount_requests_total"}' \
--data-urlencode 'match[]={__name__="cluster:velero_backup_total:max"}' \
--data-urlencode 'match[]={__name__="cluster:velero_restore_total:max"}' \
--data-urlencode 'match[]={__name__="eo_es_storage_info"}' \
--data-urlencode 'match[]={__name__="eo_es_redundancy_policy_info"}' \
--data-urlencode 'match[]={__name__="eo_es_defined_delete_namespaces_total"}' \
--data-urlencode 'match[]={__name__="eo_es_misconfigured_memory_resources_info"}' \
--data-urlencode 'match[]={__name__="cluster:eo_es_data_nodes_total:max"}' \
--data-urlencode 'match[]={__name__="cluster:eo_es_documents_created_total:sum"}' \
--data-urlencode 'match[]={__name__="cluster:eo_es_documents_deleted_total:sum"}' \
--data-urlencode 'match[]={__name__="pod:eo_es_shards_total:max"}' \
--data-urlencode 'match[]={__name__="eo_es_cluster_management_state_info"}' \
--data-urlencode 'match[]={__name__="imageregistry:imagestreamtags_count:sum"}' \
--data-urlencode 'match[]={__name__="imageregistry:operations_count:sum"}' \
--data-urlencode 'match[]={__name__="log_logging_info"}' \
--data-urlencode 'match[]={__name__="log_collector_error_count_total"}' \
--data-urlencode 'match[]={__name__="log_forwarder_pipeline_info"}' \
--data-urlencode 'match[]={__name__="log_forwarder_input_info"}' \
--data-urlencode 'match[]={__name__="log_forwarder_output_info"}' \
--data-urlencode 'match[]={__name__="cluster:log_collected_bytes_total:sum"}' \
--data-urlencode 'match[]={__name__="cluster:log_logged_bytes_total:sum"}' \
--data-urlencode 'match[]={__name__="cluster:kata_monitor_running_shim_count:sum"}' \
--data-urlencode 'match[]={__name__="platform:hypershift_hostedclusters:max"}' \
--data-urlencode 'match[]={__name__="platform:hypershift_nodepools:max"}' \
--data-urlencode 'match[]={__name__="namespace:noobaa_unhealthy_bucket_claims:max"}' \
--data-urlencode 'match[]={__name__="namespace:noobaa_buckets_claims:max"}' \
--data-urlencode 'match[]={__name__="namespace:noobaa_unhealthy_namespace_resources:max"}' \
--data-urlencode 'match[]={__name__="namespace:noobaa_namespace_resources:max"}' \
--data-urlencode 'match[]={__name__="namespace:noobaa_unhealthy_namespace_buckets:max"}' \
--data-urlencode 'match[]={__name__="namespace:noobaa_namespace_buckets:max"}' \
--data-urlencode 'match[]={__name__="namespace:noobaa_accounts:max"}' \
--data-urlencode 'match[]={__name__="namespace:noobaa_usage:max"}' \
--data-urlencode 'match[]={__name__="namespace:noobaa_system_health_status:max"}' \
--data-urlencode 'match[]={__name__="ocs_advanced_feature_usage"}' \
--data-urlencode 'match[]={__name__="os_image_url_override:sum"}' \
--data-urlencode 'match[]={__name__="openshift:openshift_network_operator_ipsec_state:info"}'
4.3. 使用红帽 Lightspeed 来识别集群中的问题
Red Hat Lightspeed 重复分析 Insights Operator 发送的数据,其中包括来自 Deployment Validation Operator (DVO)的工作负载建议。OpenShift Dedicated 用户可以在 Red Hat Hybrid Cloud Console 上显示 Advisor 服务的结果。
您可以使用 Red Hat Lightspeed 公告服务来评估和监控 OpenShift Dedicated 集群的健康状态。无论您是关注单个集群还是整个基础架构,都必须了解公开集群基础架构对服务可用性、容错、性能或安全性的影响。
如果集群安装了 Deployment Validation Operator (DVO),请突出配置可能会导致集群健康问题的工作负载。
红帽 Lightspeed 分析的结果包括在 Red Hat Hybrid Cloud Console 上的 Red Hat Lightspeed 公告服务中。在 Red Hat Hybrid Cloud 控制台中,您可以执行以下操作:
- 查看受特定建议影响的集群和工作负载。
- 使用可靠的过滤功能,将结果优化为这些建议。
- 了解更多有关单独建议、了解它们存在的风险的详细信息,并针对您的单个集群量身定制解决方案。
- 与其他利益相关者分享结果。
4.3.2. 了解红帽 Lightspeed 公告服务建议
Red Hat Lightspeed 公告服务捆绑包信息,有关各种集群状态和组件配置的信息,它们可能会影响集群和工作负载的服务可用性、容错、性能或安全性。这些信息集在 Red Hat Lightspeed 公告服务中称为建议。集群的建议包括以下信息:
- Name: 有关建议的简要描述
- Added: 在 Red Hat Lightspeed 公告服务归档中发布建议时
- Category: 问题是否有可能对服务可用性、容错、性能或安全性造成负面影响
- Total risk: 通过会对您的集群或工作负载造成负面影响的可能性派生的值,如果已发生,对操作的影响
- Clusters:检测到建议的集群列表
- Description:这个问题的简要概要,包括它对您的集群的影响
4.3.3. 显示集群中的潜在问题
本节论述了如何在 OpenShift Cluster Manager 上的 Red Hat Lightspeed Advisor 中显示 Red Hat Lightspeed 报告。
请注意,红帽 Lightspeed 重复分析您的集群并显示最新的结果。这些结果可能会改变,如您解决了一个问题,或发现了一个新问题时。
先决条件
- 集群在 OpenShift Cluster Manager 中注册。
- 启用了远程健康报告(这是默认设置)。
- 登录到 OpenShift Cluster Manager。
流程
进入 OpenShift Cluster Manager 上的 Advisor → Recommendations。
根据结果,Red Hat Lightspeed 公告服务会显示以下之一:
- 如果没有找到匹配的建议,如果红帽 Lightspeed 没有发现任何问题。
- 红帽 Lightspeed 检测到的问题列表,按风险分组(低、中、重要和严重)。
- 还没有集群,如果红帽 Lightspeed 尚未分析集群。这个分析会在集群安装、注册并连接到互联网后立即开始。
如果显示任何问题,请点击条目前面的 > 图标以了解更多详情。
根据具体问题,详细信息还可以包含来自红帽有关此问题的更多信息的链接。
4.3.4. 显示所有红帽 Lightspeed 公告服务建议
默认情况下,Recommendations 视图仅显示集群中检测到的建议。但是,您可以查看公告服务存档中的所有建议。
先决条件
- 启用了远程健康报告(这是默认设置)。
- 集群在 Red Hat Hybrid Cloud Console 注册。
- 登录到 OpenShift Cluster Manager。
流程
- 进入 OpenShift Cluster Manager 上的 Advisor → Recommendations。
点 Clusters Impacted 和 Status 过滤器旁边的 X 图标。
现在,您可以浏览集群的所有潜在建议。
4.3.5. Advisor 建议过滤器
红帽 Lightspeed 公告服务可以返回大量建议。要专注于最重要的建议,您可以将过滤器应用到 Advisor 建议 列表,以排除低优先级的建议。
默认情况下,过滤器被设置为只显示启用的建议,这些建议影响一个或多个集群。要查看 Red Hat Lightspeed 库中的所有或禁用的建议,您可以自定义过滤器。
要应用过滤器,请选择过滤器类型,然后根据下拉列表中可用的选项设置其值。您可以将多个过滤器应用到建议列表中。
您可以设置以下过滤器类型:
- Name :按名称搜索建议。
- Total risk: 从 Critical, Important, Moderate, 和 Low 中选择一个或多个值,代表对集群的负面影响的可能性和严重程度。
- Impact: 从 Critical, High, Medium, 和 Low 中选择一个或多个值,代表对集群操作的连续性影响。
- Likelihood: 从Critical, High, Medium, 和 Low 中选择一个或多个值,代表当建议出现隐患时对集群有负面影响的可能性。
- Category: 根据您所关注的方面,从 Service Availability, Performance, Fault Tolerance, Security, 和 Best Practice 中选择一个或多个类别。
- Status :点单选按钮显示启用的建议(默认)、禁用建议或所有建议。
- Clusters impacted: 设置过滤器以显示当前影响一个或多个集群的建议、没有影响的建议或所有建议。
- Risk of change: 从 High、Moderate、low 和 Very low 中选择一个或多个值,表示解析的实现可能对集群操作带来的风险。
4.3.5.1. 过滤红帽 Lightspeed 公告服务建议
作为 OpenShift Dedicated 集群管理器,您可以过滤建议列表上显示的建议。通过应用过滤器,您可以减少报告的建议数量,并专注于高优先级的建议。
以下流程演示了如何设置和删除 Category 过滤器,但该流程也适用于其他过滤器类型。
先决条件
登陆到 Hybrid Cloud 控制台中的 OpenShift Cluster Manager。
流程
- 进入 OpenShift > Advisor > Recommendations。
- 在 main, filter-type 下拉列表中,选择 Category 过滤器类型。
- 展开 filter-value 下拉列表,再选中您要查看的每个推荐类别旁边的复选框。清除不必要的类别的复选框。
- 可选:添加额外的过滤器来进一步重新定义列表。
列表中仅显示所选类别的建议。
验证
- 应用过滤器后,您可以查看更新的推荐列表。应用的过滤器会在默认过滤器旁边添加。
4.3.5.2. 从 Red Hat Lightspeed 公告服务建议中删除过滤器
您可以将多个过滤器应用到建议列表中。准备就绪后,您可以单独删除它们或完全重置它们。
单独删除过滤器
- 点每个过滤器旁边的 X 图标,包括默认过滤器,以分别删除它们。
删除所有非默认过滤器
- 点 Reset filters 只删除您应用的过滤器,保留默认过滤器。
4.3.6. 禁用 Red Hat Lightspeed 公告服务建议
您可以禁用影响集群的具体建议,以便它们不再出现在报告中。可以禁用单个集群或所有集群的建议。
禁用对所有集群的建议也适用于所有集群。
先决条件
- 启用了远程健康报告(这是默认设置)。
- 集群在 OpenShift Cluster Manager 中注册。
- 登录到 OpenShift Cluster Manager。
流程
- 进入 OpenShift Cluster Manager 上的 Advisor → Recommendations。
- 可选: 根据需要使用 Clusters Impacted 和 Status 过滤器。
使用以下方法之一禁用警报:
禁用警报:
-
点击该警报的 Options 菜单
 ,然后点 Disable recommendations。
- 输入说明并单击 保存。
-
点击该警报的 Options 菜单
要在禁用警报前查看受此警报影响的集群:
- 点要禁用的建议名称。您会被定向到单一推荐页面。
- 查看 Affected clusters 部分中的集群列表。
- 点 Actions → Disable recommendations 禁用所有集群的警报。
- 输入说明并单击 保存。
4.3.7. 启用之前禁用的红帽 Lightspeed 公告服务建议
当所有集群都禁用了一个建议时,您不会再看到 Red Hat Lightspeed 公告服务中的建议。您可以更改此行为。
先决条件
- 启用了远程健康报告(这是默认设置)。
- 集群在 OpenShift Cluster Manager 中注册。
- 登录到 OpenShift Cluster Manager。
流程
- 进入 OpenShift Cluster Manager 上的 Advisor → Recommendations。
过滤在禁用的建议上显示的建议:
- 在 Status 下拉菜单中选择 Status。
- 在 Filter by status 下拉菜单中选择 Disabled。
- 可选:清除 Clusters impacted 过滤器。
- 找到启用的建议。
-
点 Options 菜单
,然后点 Enable recommendations。
4.3.8. 关于工作负载的红帽 Lightspeed 顾问服务建议
您可以使用 Red Hat Lightspeed 公告服务查看和管理影响您的集群和工作负载的建议信息。公告服务利用部署验证功能,帮助 OpenShift 集群管理员查看部署策略的所有运行时违反情况。您可以在 Red Hat Hybrid Cloud Console 的 OpenShift > Advisor > Workloads 中查看工作负载的建议。如需更多信息,请参阅这些其他资源:
4.3.9. 在 web 控制台中显示 Red Hat Lightspeed 状态
Red Hat Lightspeed 会重复分析您的集群,您可以在 OpenShift Dedicated web 控制台中显示已识别的集群潜在问题的状态。此状态显示不同类别中的问题数量,以及 OpenShift Cluster Manager 报告的链接。
先决条件
- 集群在 OpenShift Cluster Manager 中注册。
- 启用了远程健康报告(这是默认设置)。
- 已登陆到 OpenShift Dedicated Web 控制台。
流程
- 在 OpenShift Dedicated Web 控制台中进入 Home → Overview。
在 Status 卡中点 Red Hat Lightspeed。
弹出窗口列出了按风险分组的潜在问题。点单个类别或查看 Red Hat Lightspeed Advisor 中的所有建议,以显示更多详细信息。
4.4. 使用 Insights Operator
Insights Operator 会定期收集配置和组件故障状态,并默认每两小时向红帽报告这些数据。这些信息可让红帽评估配置,以及比 Telemetry 报告更深入的失败数据。OpenShift Dedicated 用户可以在 Red Hat Hybrid Cloud Console 上的 Advisor 服务中显示报告。
4.4.1. 了解 Insights Operator 警报
Insights Operator 通过 Prometheus 监控系统向 Alertmanager 声明警报。您可以使用以下方法之一在 OpenShift Dedicated Web 控制台中的 Alerting UI 中查看这些警报:
- 在 Administrator 视角中,点 Observe → Alerting。
- 在 Developer 视角中,点 Observe → <project_name> → Alerts 标签页。
目前,Insights Operator 在满足条件时发送以下警报:
| 警报 | 描述 |
|---|---|
|
| Insights Operator 被禁用。 |
|
| Red Hat Subscription Management 中不启用简单的内容访问。 |
|
| 红帽 Lightspeed 具有集群的活跃建议。 |
4.4.2. 模糊处理 Deployment Validation Operator 数据
默认情况下,当您安装 Deployment Validation Operator (DVO)时,资源的名称和唯一标识符(UID)包含在 OpenShift Dedicated 的 Insights Operator 捕获和处理的数据中。集群管理员可以将 Insight Operator 配置为模糊来自 Deployment Validation Operator (DVO) 的数据。例如,您可以在发送给红帽的归档文件中模糊处理工作负载名称。
要模糊处理资源名称,您必须在 insights-config ConfigMap 对象中手动设置 obfuscation 属性,使其包含 workload_names 值,如以下步骤中所述。
先决条件
- 启用了远程健康报告(这是默认设置)。
- 使用 "cluster-admin" 角色登录到 OpenShift Dedicated Web 控制台。
-
insights-config
ConfigMap对象存在于openshift-insights命名空间中。 - 集群被自我管理,并安装了 Deployment Validation Operator。
流程
- 进入 Workloads → ConfigMaps 并选择 Project: openshift-insights。
-
点
insights-configConfigMap对象打开它。 - 点 Actions 并选择 Edit ConfigMap。
- 点 YAML 视图 单选按钮。
在文件中,使用
workload_names值设置obfuscation属性。apiVersion: v1 kind: ConfigMap # ... data: config.yaml: | dataReporting: obfuscation: - workload_names # ...- 点击 Save。insights-config config-map 详情页面将打开。
-
验证
config.yamlobfuscation属性的值是否已设置为- workload_names。
第 5 章 收集集群数据
在提交问题单时同时提供您的集群信息,可以帮助红帽支持为您进行排除故障。
建议您提供:
5.1. 关于 must-gather 工具
oc adm must-gather CLI 命令可收集最有助于解决问题的集群信息,包括:
- 资源定义
- 服务日志
默认情况下,oc adm must-gather 命令使用默认的插件镜像,并写入 ./must-gather.local。
另外,您可以使用适当的参数运行命令来收集具体信息,如以下部分所述:
要收集与一个或多个特定功能相关的数据,请使用
--image参数和镜像,如以下部分所述。例如:
$ oc adm must-gather \
  --image=registry.redhat.io/container-native-virtualization/cnv-must-gather-rhel9:v4.20.1
要收集审计日志,请使用
-- /usr/bin/gather_audit_logs参数,如以下部分所述。例如:
$ oc adm must-gather -- /usr/bin/gather_audit_logs注意- 作为默认信息集合的一部分,不会收集审计日志来减小文件的大小。
-
在 Windows 操作系统上,安装
cwRsync客户端,并添加到PATH变量中,以便与oc rsync命令一起使用。
当您运行 oc adm must-gather 时,集群的新项目中会创建一个带有随机名称的新 pod。在该 pod 上收集数据,并保存在当前工作目录中以 must-gather.local 开头的新目录中。
例如:
NAMESPACE                      NAME                 READY   STATUS      RESTARTS      AGE
...
openshift-must-gather-5drcj    must-gather-bklx4    2/2     Running     0             72s
openshift-must-gather-5drcj    must-gather-s8sdh    2/2     Running     0             72s
...
另外,您可以使用 --run-namespace 选项在特定命名空间中运行 oc adm must-gather 命令。
例如:
$ oc adm must-gather --run-namespace <namespace> \
  --image=registry.redhat.io/container-native-virtualization/cnv-must-gather-rhel9:v4.20.1
5.1.1. 为红帽支持收集您的集群数据
您可使用 oc adm must-gather CLI 命令收集有关您的集群的调试信息。
先决条件
您可以使用具有
cluster-admin角色的用户访问集群。注意在 OpenShift Dedicated 部署中,不使用客户云订阅(CCS)模型的用户无法使用
oc adm must-gather命令,因为它需要cluster-admin权限。-
已安装 OpenShift CLI (
oc)。
流程
-
进入要存储
must-gather数据的目录。 运行
oc adm must-gather命令:$ oc adm must-gather注意因为这个命令会默认会选择一个随机 control plane 节点,所以 pod 可能会被调度到处于
NotReady和SchedulingDisabled状态的 control plane 节点。如果此命令失败,例如,您无法在集群中调度 pod,则使用
oc adm inspect命令来收集特定资源的信息。注意请联络红帽支持以获取推荐收集的资源信息。
从工作目录中刚刚创建的
must-gather目录创建一个压缩文件。确保为唯一的 must-gather 数据提供日期和集群 ID。有关如何查找集群 ID 的更多信息,请参阅如何在 OpenShift 集群上找到 cluster-id 或名称。例如,在使用 Linux 操作系统的计算机上运行以下命令:$ tar cvaf must-gather-`date +"%m-%d-%Y-%H-%M-%S"`-<cluster_id>.tar.gz <must_gather_local_dir>1 - 1
- 将
<must_gather_local_dir>替换为实际目录名称。
- 在红帽客户门户网站的客户支持页面中,将压缩文件附加到您的支持问题单中。
5.1.2. must-gather 标记
下表中列出的标记可用于 oc adm must-gather 命令。
| 标记 | 示例命令 | 描述 |
|---|---|---|
|
|
|
为集群中带有 |
|
|
| 在保存收集数据的本地机器上设置一个特定的目录。 |
|
|
|
运行 |
|
|
|
指定要运行的 |
|
|
|
指定一个`<image_stream>`,使用一个命名空间或 namespace or name:tag 值包括一个 |
|
|
| 设置要使用的特定节点。如果没有指定,则默认使用一个随机的 master。 |
|
|
| 设置要使用的一个特定节点选择器。仅在指定需要同时捕获一组集群节点上的数据的命令和镜像时才相关。 |
|
|
|
|
|
|
|
仅返回比指定持续时间更新的日志。默认为所有日志。为了支持这个功能,推荐使用插件,但这并不是必须的。只能使用 |
|
|
|
仅在特定日期和时间后返回日志,以(RFC3339)格式表示。默认为所有日志。为了支持这个功能,推荐使用插件,但这并不是必须的。只能使用 |
|
|
| 指定您要从其中复制收集的数据的 pod 中的一个特定目录。 |
|
|
| 在超时前收集数据的时间长度,以秒、分钟或小时表示,如 3s、5m 或 2h。指定的时间必须大于零。如果没有指定,则默认为 10 分钟。 |
|
|
|
指定可用于 |
5.1.3. 收集有关特定功能的数据
您可通过将 oc adm must-gather CLI 命令与 --image 或 --image-stream 参数结合使用来收集有关特定功能的调试信息。must-gather 工具支持多个镜像,这样您便可通过运行单个命令收集多个功能的数据。
| Image | 用途 |
|---|---|
|
| OpenShift Virtualization 的数据收集。 |
|
| OpenShift Serverless 的数据收集。 |
|
| Red Hat OpenShift Service Mesh 的数据收集。 |
|
| 托管 control plane 的数据收集。 |
|
| MTC 的数据收集。 |
|
| 用于日志记录的数据收集。 |
|
| Network Observability Operator 的数据收集。 |
|
| Red Hat OpenShift GitOps 的数据收集。 |
|
| Secret Store CSI Driver Operator 的数据收集。 |
要确定 OpenShift Dedicated 组件镜像的最新版本,请参阅红帽客户门户网站中的 OpenShift Operator 生命周期 网页。
先决条件
-
您可以使用具有
cluster-admin角色的用户访问集群。 -
已安装 OpenShift CLI (
oc)。
流程
-
进入存储
must-gather数据的目录。 使用一个或多个
--image或--image-stream参数运行oc adm must-gather命令。注意-
要收集除特定功能数据外的默认
must-gather数据,请添加--image-stream=openshift/must-gather参数。
例如,使用以下命令可收集默认集群数据和 OpenShift Virtualization 特定信息:
$ oc adm must-gather \
  --image-stream=openshift/must-gather \
1 --image=registry.redhat.io/container-native-virtualization/cnv-must-gather-rhel9:v4.20.12 您可以将
must-gather工具与额外参数搭配使用,以收集集群中与 OpenShift Logging 和 Cluster Logging Operator 特别相关的数据。对于 OpenShift Logging,运行以下命令:$ oc adm must-gather --image=$(oc -n openshift-logging get deployment.apps/cluster-logging-operator \ -o jsonpath='{.spec.template.spec.containers[?(@.name == "cluster-logging-operator")].image}')例 5.1. OpenShift Logging 的
must-gather输出示例├── cluster-logging │ ├── clo │ │ ├── cluster-logging-operator-74dd5994f-6ttgt │ │ ├── clusterlogforwarder_cr │ │ ├── cr │ │ ├── csv │ │ ├── deployment │ │ └── logforwarding_cr │ ├── collector │ │ ├── fluentd-2tr64 │ ├── curator │ │ └── curator-1596028500-zkz4s │ ├── eo │ │ ├── csv │ │ ├── deployment │ │ └── elasticsearch-operator-7dc7d97b9d-jb4r4 │ ├── es │ │ ├── cluster-elasticsearch │ │ │ ├── aliases │ │ │ ├── health │ │ │ ├── indices │ │ │ ├── latest_documents.json │ │ │ ├── nodes │ │ │ ├── nodes_stats.json │ │ │ └── thread_pool │ │ ├── cr │ │ ├── elasticsearch-cdm-lp8l38m0-1-794d6dd989-4jxms │ │ └── logs │ │ ├── elasticsearch-cdm-lp8l38m0-1-794d6dd989-4jxms │ ├── install │ │ ├── co_logs │ │ ├── install_plan │ │ ├── olmo_logs │ │ └── subscription │ └── kibana │ ├── cr │ ├── kibana-9d69668d4-2rkvz ├── cluster-scoped-resources │ └── core │ ├── nodes │ │ ├── ip-10-0-146-180.eu-west-1.compute.internal.yaml │ └── persistentvolumes │ ├── pvc-0a8d65d9-54aa-4c44-9ecc-33d9381e41c1.yaml ├── event-filter.html ├── gather-debug.log └── namespaces ├── openshift-logging │ ├── apps │ │ ├── daemonsets.yaml │ │ ├── deployments.yaml │ │ ├── replicasets.yaml │ │ └── statefulsets.yaml │ ├── batch │ │ ├── cronjobs.yaml │ │ └── jobs.yaml │ ├── core │ │ ├── configmaps.yaml │ │ ├── endpoints.yaml │ │ ├── events │ │ │ ├── curator-1596021300-wn2ks.162634ebf0055a94.yaml │ │ │ ├── curator.162638330681bee2.yaml │ │ │ ├── elasticsearch-delete-app-1596020400-gm6nl.1626341a296c16a1.yaml │ │ │ ├── elasticsearch-delete-audit-1596020400-9l9n4.1626341a2af81bbd.yaml │ │ │ ├── elasticsearch-delete-infra-1596020400-v98tk.1626341a2d821069.yaml │ │ │ ├── elasticsearch-rollover-app-1596020400-cc5vc.1626341a3019b238.yaml │ │ │ ├── elasticsearch-rollover-audit-1596020400-s8d5s.1626341a31f7b315.yaml │ │ │ ├── elasticsearch-rollover-infra-1596020400-7mgv8.1626341a35ea59ed.yaml │ │ ├── events.yaml │ │ ├── persistentvolumeclaims.yaml │ │ ├── pods.yaml │ │ ├── replicationcontrollers.yaml │ │ ├── secrets.yaml │ │ └── services.yaml │ ├── openshift-logging.yaml │ ├── pods │ │ ├── cluster-logging-operator-74dd5994f-6ttgt │ │ │ ├── cluster-logging-operator │ │ │ │ └── cluster-logging-operator │ │ │ │ └── logs │ │ │ │ ├── current.log │ │ │ │ ├── previous.insecure.log │ │ │ │ └── previous.log │ │ │ └── cluster-logging-operator-74dd5994f-6ttgt.yaml │ │ ├── cluster-logging-operator-registry-6df49d7d4-mxxff │ │ │ ├── cluster-logging-operator-registry │ │ │ │ └── cluster-logging-operator-registry │ │ │ │ └── logs │ │ │ │ ├── current.log │ │ │ │ ├── previous.insecure.log │ │ │ │ └── previous.log │ │ │ ├── cluster-logging-operator-registry-6df49d7d4-mxxff.yaml │ │ │ └── mutate-csv-and-generate-sqlite-db │ │ │ └── mutate-csv-and-generate-sqlite-db │ │ │ └── logs │ │ │ ├── current.log │ │ │ ├── previous.insecure.log │ │ │ └── previous.log │ │ ├── curator-1596028500-zkz4s │ │ ├── elasticsearch-cdm-lp8l38m0-1-794d6dd989-4jxms │ │ ├── elasticsearch-delete-app-1596030300-bpgcx │ │ │ ├── elasticsearch-delete-app-1596030300-bpgcx.yaml │ │ │ └── indexmanagement │ │ │ └── indexmanagement │ │ │ └── logs │ │ │ ├── current.log │ │ │ ├── previous.insecure.log │ │ │ └── previous.log │ │ ├── fluentd-2tr64 │ │ │ ├── fluentd │ │ │ │ └── fluentd │ │ │ │ └── logs │ │ │ │ ├── current.log │ │ │ │ ├── previous.insecure.log │ │ │ │ └── previous.log │ │ │ ├── fluentd-2tr64.yaml │ │ │ └── fluentd-init │ │ │ └── fluentd-init │ │ │ └── logs │ │ │ ├── current.log │ │ │ ├── previous.insecure.log │ │ │ └── previous.log │ │ ├── kibana-9d69668d4-2rkvz │ │ │ ├── kibana │ │ │ │ └── kibana │ │ │ │ └── logs │ │ │ │ ├── current.log │ │ │ │ ├── previous.insecure.log │ │ │ │ └── previous.log │ │ │ ├── kibana-9d69668d4-2rkvz.yaml │ │ │ └── kibana-proxy │ │ │ └── kibana-proxy │ │ │ └── logs │ │ │ ├── current.log │ │ │ ├── previous.insecure.log │ │ │ └── previous.log │ └── route.openshift.io │ └── routes.yaml └── openshift-operators-redhat ├── ...-
要收集除特定功能数据外的默认
使用一个或多个
--image或--image-stream参数运行oc adm must-gather命令。例如,使用以下命令可收集默认集群数据和 KubeVirt 特定信息:$ oc adm must-gather \ --image-stream=openshift/must-gather \1 --image=quay.io/kubevirt/must-gather2 从工作目录中刚刚创建的
must-gather目录创建一个压缩文件。确保为唯一的 must-gather 数据提供日期和集群 ID。有关如何查找集群 ID 的更多信息,请参阅如何在 OpenShift 集群上找到 cluster-id 或名称。例如,在使用 Linux 操作系统的计算机上运行以下命令:$ tar cvaf must-gather-`date +"%m-%d-%Y-%H-%M-%S"`-<cluster_id>.tar.gz <must_gather_local_dir>1 - 1
- 将
<must_gather_local_dir>替换为实际目录名称。
- 在红帽客户门户网站的客户支持页面中,将压缩文件附加到您的支持问题单中。
5.1.4. 收集网络日志
您可以在集群中的所有节点上收集网络日志。
流程
使用
-- gather_network_logs运行oc adm must-gather命令:$ oc adm must-gather -- gather_network_logs注意默认情况下,
must-gather工具从集群中的所有节点收集 OVNnbdb和sbdb数据库。添加-- gather_network_logs选项,使其包含包含 OVNnbdb数据库的 OVN-Kubernetes 事务的额外日志。从工作目录中刚刚创建的
must-gather目录创建一个压缩文件。确保为唯一的 must-gather 数据提供日期和集群 ID。有关如何查找集群 ID 的更多信息,请参阅如何在 OpenShift 集群上找到 cluster-id 或名称。例如,在使用 Linux 操作系统的计算机上运行以下命令:$ tar cvaf must-gather-`date +"%m-%d-%Y-%H-%M-%S"`-<cluster_id>.tar.gz <must_gather_local_dir>1 - 1
- 将
<must_gather_local_dir>替换为实际目录名称。
- 在红帽客户门户网站的客户支持页面中,将压缩文件附加到您的支持问题单中。
5.1.5. 更改 must-gather 存储限制
当使用 oc adm must-gather 命令收集数据时,信息的默认最大存储是容器的存储容量的 30%。达到 30% 限值后,容器被终止,收集过程将停止。收集到的信息会下载到您的本地存储中。要再次运行 must-gather 命令,您需要一个具有更多存储容量的容器,或者调整最大卷百分比。
如果容器达到存储限制,则生成类似以下示例的错误消息。
输出示例
Disk usage exceeds the volume percentage of 30% for mounted directory. Exiting...先决条件
-
您可以使用具有
cluster-admin角色的用户访问集群。 -
已安装 OpenShift CLI (
oc)。
流程
使用
volume-percentage标志运行oc adm must-gather命令。新值不能超过 100。$ oc adm must-gather --volume-percentage <storage_percentage>
5.2. 关于支持日志收集
支持 Log Gather Operator 基于传统 must-gather 工具的功能构建,以自动收集调试数据。它通过将收集的信息打包到一个 .tar 文件中来简化故障排除,并将其自动上传到指定的红帽支持问题单中。
支持 Log Gather 只是一个技术预览功能。技术预览功能不受红帽产品服务等级协议(SLA)支持,且功能可能并不完整。红帽不推荐在生产环境中使用它们。这些技术预览功能可以使用户提早试用新的功能,并有机会在开发阶段提供反馈意见。
有关红帽技术预览功能支持范围的更多信息,请参阅以下链接:
支持日志 Gather 的主要功能包括:
- 不需要管理员特权 :可让您收集和上传日志,而无需升级的权限,使非管理员用户更易于收集数据。
- 简化的日志收集 :从集群收集调试数据,如资源定义和服务日志。
-
可配置数据上传 :提供配置选项,可自动将
.tar文件上传到支持问题单,或者将其保存到本地以进行手动上传。
5.2.1. 使用 Web 控制台安装 Support Log Gather
您可以使用 Web 控制台安装 Support Log Gather。
支持 Log Gather 只是一个技术预览功能。技术预览功能不受红帽产品服务等级协议(SLA)支持,且功能可能并不完整。红帽不推荐在生产环境中使用它们。这些技术预览功能可以使用户提早试用新的功能,并有机会在开发阶段提供反馈意见。
有关红帽技术预览功能支持范围的更多信息,请参阅以下链接:
先决条件
-
您可以使用
cluster-admin权限访问集群。 - 您可以访问 OpenShift Dedicated Web 控制台。
流程
- 登录到 OpenShift Dedicated Web 控制台。
- 进入到 Ecosystem → Software Catalog。
- 在过滤器框中,输入 Support Log Gather。
- 选择 Support Log Gather。
- 从 Version 列表中,选择 Support Log Gather 版本,然后单击 Install。
在 Install Operator 页面中,配置安装设置:
为 Operator 选择 Installed Namespace。
默认 Operator 命名空间为
must-gather-operator。如果must-gather-operator命名空间不存在,则会自动创建它。选择一个 更新批准策略:
- 当有新版本可用时,选择 Automatic 以让 Operator Lifecycle Manager (OLM)自动更新 Operator。
- 如果 Operator 更新必须由具有适当凭证的用户批准,请选择 Manual。
- 点 Install。
验证
验证 Operator 是否已成功安装:
- 进入到 Ecosystem → Software Catalog。
-
验证 Support Log Gather 是否在
must-gather-operator命名空间中 Status 为 Succeeded。
验证支持日志 Gather pod 是否正在运行:
- 进入 Workloads → Pods
验证 Support Log Gather pod 的状态是否为 Running。
您只能在 pod 启动并运行后使用 Support Log Gather。
5.2.2. 使用 CLI 安装支持日志收集
要为支持问题单启用自动日志收集,您可以从命令行界面(CLI)安装支持 Log Gather。
支持 Log Gather 只是一个技术预览功能。技术预览功能不受红帽产品服务等级协议(SLA)支持,且功能可能并不完整。红帽不推荐在生产环境中使用它们。这些技术预览功能可以使用户提早试用新的功能,并有机会在开发阶段提供反馈意见。
有关红帽技术预览功能支持范围的更多信息,请参阅以下链接:
先决条件
-
您可以使用
cluster-admin权限访问集群。
流程
运行以下命令,创建一个名为
must-gather-operator的新项目:$ oc new-project must-gather-operator创建一个
OperatorGroup对象:创建定义
OperatorGroup对象的 YAML 文件,如operatorGroup.yaml:apiVersion: operators.coreos.com/v1 kind: OperatorGroup metadata: name: must-gather-operator namespace: must-gather-operator spec: {}运行以下命令来创建
OperatorGroup对象:$ oc create -f operatorGroup.yaml
创建
Subscription对象:创建一个 YAML 文件,如
subscription.yaml,用于定义Subscription对象:apiVersion: operators.coreos.com/v1alpha1 kind: Subscription metadata: name: support-log-gather-operator namespace: must-gather-operator spec: channel: tech-preview name: support-log-gather-operator source: redhat-operators sourceNamespace: openshift-marketplace installPlanApproval: Automatic运行以下命令来创建
Subscription对象:$ oc create -f subscription.yaml
验证
运行以下命令,验证 Operator 命名空间中的 pod 状态。
$ oc get pods输出示例
NAME                                                              READY   STATUS      RESTARTS   AGE
must-gather-operator-657fc74d64-2gg2w                             1/1     Running     0          13m
所有容器集的状态都必须处于
Running状态。运行以下命令验证订阅是否已创建:
$ oc get subscription -n must-gather-operator输出示例
NAME                          PACKAGE                       SOURCE            CHANNEL
support-log-gather-operator   support-log-gather-operator   redhat-operators  tech-preview
运行以下命令验证 Operator 是否已安装:
$ oc get csv -n must-gather-operator输出示例
NAME                                  DISPLAY                VERSION   REPLACES   PHASE
support-log-gather-operator.v4.20.0   support log gather     4.20.0               Succeeded
5.2.3. 配置支持日志收集实例
您必须从命令行界面(CLI)创建 MustGather 自定义资源(CR),以便从集群中自动收集诊断数据。这个过程还会自动将数据上传到红帽支持问题单中。
支持 Log Gather 只是一个技术预览功能。技术预览功能不受红帽产品服务等级协议(SLA)支持,且功能可能并不完整。红帽不推荐在生产环境中使用它们。这些技术预览功能可以使用户提早试用新的功能,并有机会在开发阶段提供反馈意见。
有关红帽技术预览功能支持范围的更多信息,请参阅以下链接:
先决条件
-
已安装 OpenShift CLI (
oc)工具。 - 已在集群中安装了 Support Log Gather。
- 您有一个红帽支持问题单 ID。
- 您已创建了包含红帽客户门户网站凭证的 Kubernetes secret。secret 必须包含 username 字段和密码字段。
- 您已创建了一个服务帐户。
流程
为
MustGatherCR 创建一个 YAML 文件,如support-log-gather.yaml,其中包含以下基本配置:support-log-gather.yaml示例apiVersion: operator.openshift.io/v1alpha1 kind: MustGather metadata: name: example-mg namespace: must-gather-operator spec: serviceAccountName: must-gather-operator audit: true proxyConfig: httpProxy: "http://proxy.example.com:8080" httpsProxy: "https://proxy.example.com:8443" noProxy: ".example.com,localhost" mustGatherTimeout: "1h30m9s" uploadTarget: type: SFTP sftp: caseID: "04230315" caseManagementAccountSecretRef: name: mustgather-creds host: "sftp.access.redhat.com" retainResourcesOnCompletion: true storage: type: PersistentVolume persistentVolume: claim: name: mustgather-pvc subPath: must-gather-bundles/case-04230315有关配置参数的更多信息,请参阅" MustGather 自定义资源的配置参数"。
运行以下命令来创建
MustGather对象:$ oc create -f support-log-gather.yaml
验证
运行以下命令验证
MustGatherCR 是否已创建:$ oc get mustgather输出示例
NAME          AGE
example-mg    7s
运行以下命令,验证 Operator 命名空间中的 pod 状态。
$ oc get pods输出示例
NAME                                                              READY   STATUS      RESTARTS   AGE
must-gather-operator-657fc74d64-2gg2w                             1/1     Running     0          13m
example-mg-gk8m8                                                  2/2     Running     0          13s
必须创建基于
MustGatherCR 的名称的新 pod。所有容器集的状态都必须处于Running状态。要监控文件上传的进度,请运行以下命令来查看作业 pod 中上传容器的日志:
oc logs -f pod/example-mg-gk8m8 -c upload成功时,流程必须创建一个存档,并将其上传到指定案例的红帽安全文件传输协议(SFTP)服务器。
5.2.4. MustGather 自定义资源的配置参数
您可以通过创建一个 YAML 文件来管理 MustGather 自定义资源(CR),该文件指定数据收集和上传过程的参数。下表提供了您可以在 MustGather CR 中配置的参数概述。
| 参数名称 | 描述 | 类型 |
|---|---|---|
|
|
可选:指定是否收集审计日志。有效值为 |
|
|
|
可选:指定 |
该值必须是带有时间单位的浮点数。有效单位是 |
|
| 可选:定义要使用的代理配置。默认值为集群级别的代理配置。 |
|
|
| 指定 HTTP 请求的代理 URL。 | URL |
|
| 指定 HTTPS 请求的代理 URL。 | |
|
| 指定以逗号分隔的域列表,这些域不能在其中使用代理。 | URL 列表 |
|
|
可选:指定在数据收集完成后是否保留 |
|
|
|
可选:指定服务帐户的名称。默认值为 |
|
|
|
可选:定义 |
|
|
| 定义持久性卷的详细信息。 |
|
|
| 定义持久性卷声明(PVC)的详细信息。 |
|
|
| 指定要用于存储的 PVC 名称。 |
|
|
| 可选:指定用于存储捆绑包的 PVC 的路径。 |
|
|
|
定义存储类型。唯一支持的值是 |
|
|
|
可选:定义 |
|
|
|
可选:指定捆绑包上传的目标服务器。默认情况下,捆绑包被上传到 |
默认情况下,捆绑包被上传到 |
|
| 指定收集诊断数据的红帽支持问题单 ID。 |
|
|
|
定义身份验证并将文件上传到红帽客户门户网站支持问题单所需的凭证。该值必须包含 |
|
|
| 指定包含凭证的 Kubernetes secret 的名称。 |
|
|
|
可选:指定 |
|
|
|
指定 |
|
如果没有指定 spec.uploadTarget 或 spec.storage,pod 会将数据保存到临时卷中,并在 pod 终止时永久删除数据。
5.2.5. 卸载支持日志收集
您可以使用 Web 控制台卸载 Support Log Gather。
先决条件
-
您可以使用
cluster-admin权限访问集群。 - 您可以访问 OpenShift Dedicated Web 控制台。
- 已安装 Support Log Gather。
流程
- 登录到 OpenShift Dedicated Web 控制台。
卸载支持 Log Gather Operator。
- 进入到 Ecosystem → Installed Operators。
- 点 Support Log Gather 条目 旁边的 Options 菜单,然后点 Uninstall Operator。
- 在确认对话框中,点 Uninstall。
5.2.6. 删除支持日志收集资源
卸载 Support Log Gather 后,就可以从集群中删除相关的资源。
先决条件
-
您可以使用
cluster-admin权限访问集群。 - 您可以访问 OpenShift Dedicated Web 控制台。
流程
- 登录到 OpenShift Dedicated Web 控制台。
删除 must-gather-operator 命名空间中的组件部署。
- 点 Project 下拉菜单查看所有可用项目的列表,然后选择 must-gather-operator 项目。
- 进入到 Workloads → Deployments。
- 选择您要删除的部署。
- 单击 Actions 下拉菜单,再选择 Delete Deployment。
- 在确认对话框中,单击 Delete 以删除部署。
另外,使用命令行界面(CLI)删除
must-gather-operator命名空间中组件部署。$ oc delete deployment -n must-gather-operator -l operators.coreos.com/support-log-gather-operator.must-gather-operator
可选:删除由 Support Log Gather 安装的自定义资源定义(CRD):
- 进入到 Administration → CustomResourceDefinitions。
-
在 Name 字段中输入
MustGather来过滤 CRD。 点击以下 CRD
旁边的 Options 菜单,然后选择 Delete Custom Resource Definition:
-
MustGather
-
可选:删除
must-gather-operator命名空间。- 进入到 Administration → Namespaces。
- 点击 must-gather-operator 旁边的 Options 菜单 并选择 Delete Namespace。
-
在确认对话框中,输入
must-gather-operator并点 Delete。
5.3. 获取集群 ID
在向红帽支持提供信息时,提供集群的唯一标识符会很有帮助。您可以使用 OpenShift Dedicated Web 控制台自动填充集群 ID。您还可以使用 web 控制台或 OpenShift CLI(oc)手工获取集群 ID。
先决条件
-
您可以使用具有
dedicated-admin角色的用户访问集群。 -
您可以访问 Web 控制台或安装了 OpenShift CLI (
oc)。
流程
使用 OpenShift Cluster Manager 手动获取集群 ID:
- 导航到 Cluster List。
- 点您需要为其创建一个支持问题单的集群名称。
- 在 Overview 选项卡的 Details 部分的 Cluster ID 字段中找到值。
使用 Web 控制台开支持问题单并自动填充集群 ID:
- 从工具栏导航至 (?)help 并选择 Share Feedback。
- 从 Tell us about your experience 窗口中点 Open a support case。
使用 web 控制台手动获取集群 ID:
- 进入到 Home → Overview。
- 该值包括在 Details 中的 Cluster ID 项中。
要使用 OpenShift CLI(
oc)获取集群 ID,请运行以下命令:$ oc get clusterversion -o jsonpath='{.items[].spec.clusterID}{"\n"}'
5.4. 查询集群节点 journal 日志
您可以在独立集群节点的 /var/log 中收集 journald 单元日志和其他日志。
先决条件
您可以使用具有
cluster-admin角色的用户访问集群。注意在 OpenShift Dedicated 部署中,不使用客户云订阅(CCS)模型的用户无法使用
oc adm node-logs命令,因为它需要cluster-admin权限。-
已安装 OpenShift CLI(
oc)。
流程
查询 OpenShift Dedicated 集群节点的
kubeletjournald单元日志。以下示例仅查询 control plane 节点:$ oc adm node-logs --role=master -u kubelet1 -
kubelet:根据需要替换以查询其他单元日志。
-
从集群节点上
/var/log/下的特定子目录收集日志。获取
/var/log/子目录中所含的日志列表。以下示例列出所有 control plane 节点上的/var/log/openshift-apiserver/中的文件:$ oc adm node-logs --role=master --path=openshift-apiserver检查
/var/log/子目录中的特定日志。以下示例输出来自所有 control plane 节点的/var/log/openshift-apiserver/audit.log内容:$ oc adm node-logs --role=master --path=openshift-apiserver/audit.log
5.5. 网络追踪方法
收集网络追踪(以数据包捕获记录的形式)可以帮助红帽支持对网络问题进行故障排除。
OpenShift Dedicated 支持以两种方式执行网络追踪。查看下表并选择符合您的需要的方法。
| 方法 | 优点和功能 |
|---|---|
| 收集主机网络追踪 | 您可以在一个或多个节点上同时指定的时间执行数据包捕获。在满足指定持续时间时,数据包捕获文件将从节点传输到客户端机器。 您可以排除特定操作触发网络通信问题的原因。运行数据包捕获,执行触发此问题的操作,并使用日志诊断问题。 |
| 从 OpenShift Dedicated 节点或容器收集网络追踪 |
您可以在一个节点或一个容器中执行数据包捕获。您可以以交互方式运行 您可以手动启动数据包捕获,触发网络通信问题,然后手动停止数据包捕获。
此方法使用 |
5.6. 收集主机网络追踪
有时,追踪网络通信并同时捕获多个节点上的数据包简化了与网络相关的问题的故障排除。
您可以使用 oc adm must-gather 命令和 registry.redhat.io/openshift4/network-tools-rhel8 容器镜像的组合来收集来自节点的数据包。分析数据包捕获可帮助您对网络通信问题进行故障排除。
oc adm must-gather 命令用于在特定节点上的 pod 中运行 tcpdump 命令。tcpdump 命令记录 pod 中捕获的数据包。当 tcpdump 命令退出时,oc adm must-gather 命令会用从 pod 捕获的数据包传输到您的客户端机器。
以下流程中的示例命令演示了使用 tcpdump 命令执行数据包捕获。但是,您可以在 --image 参数中指定的容器镜像中运行任何命令,以便同时从多个节点收集故障排除信息。
先决条件
以具有
cluster-admin角色的用户身份登录到 OpenShift Dedicated。注意在 OpenShift Dedicated 部署中,不使用客户云订阅(CCS)模型的用户无法使用
oc adm must-gather命令,因为它需要cluster-admin权限。-
已安装 OpenShift CLI(
oc)。
流程
运行以下命令,在某些节点上运行来自主机网络的数据包捕获:
$ oc adm must-gather \
    --dest-dir /tmp/captures \// <.>
    --source-dir '/tmp/tcpdump/' \// <.>
    --image registry.redhat.io/openshift4/network-tools-rhel8:latest \// <.>
    --node-selector 'node-role.kubernetes.io/worker' \// <.>
    --host-network=true \// <.>
    --timeout 30s \// <.>
    -- \
    tcpdump -i any \// <.>
    -w /tmp/tcpdump/%Y-%m-%dT%H:%M:%S.pcap -W 1 -G 300
<.>
--dest-dir参数指定oc adm must-gather将数据包捕获到相对于客户端机器上/tmp/captures的目录中。您可以指定任何可写目录。<.> 当tcpdump在oc adm must-gather启动时的 debug pod 中运行时,--source-dir参数指定数据包捕获的临时存储在 pod 上的/tmp/tcpdump目录中。<.> The--image参数指定包含tcpdump命令的容器镜像。<.>--node-selector参数和示例值指定在 pod 上的 /tmp/tcpdump 目录中执行数据包捕获。作为替代方案,您可以指定--node-name参数而不是在单个节点上运行数据包捕获。如果省略--node-selector和--node-name参数,则数据包捕获将在所有节点上执行。<.>--host-network=true参数是必需的,以便在节点的网络接口上执行数据包捕获。<.>--timeout参数和值指定运行 debug pod 达到 30 秒。如果没有指定--timeout参数和持续时间,则 debug pod 会运行 10 分钟。<.>-i any参数用于tcpdump命令,指定捕获所有网络接口上的数据包。作为替代方案,您可以指定网络接口名称。- 执行访问 Web 应用等操作,在网络追踪捕获数据包时触发网络通信问题。
查看
oc adm must-gather从 pod 传送到客户端机器的数据包捕获文件:tmp/captures ├── event-filter.html ├── ip-10-0-192-217-ec2-internal1 │ └── registry-redhat-io-openshift4-network-tools-rhel8-sha256-bca... │ └── 2022-01-13T19:31:31.pcap ├── ip-10-0-201-178-ec2-internal2 │ └── registry-redhat-io-openshift4-network-tools-rhel8-sha256-bca... │ └── 2022-01-13T19:31:30.pcap ├── ip-... └── timestamp
5.7. 从 OpenShift Dedicated 节点或容器收集网络追踪
在调查与网络相关的 OpenShift Dedicated 问题时,红帽可能会从特定的 OpenShift Dedicated 集群节点或特定容器请求网络数据包追踪。在 OpenShift Dedicated 中捕获网络 trace 的建议方法是通过 debug pod。
先决条件
您可以使用具有
cluster-admin角色的用户访问集群。注意在 OpenShift Dedicated 部署中,没有使用客户云订阅(CCS)模型的客户无法使用
oc debug命令,因为它需要cluster-admin权限。-
已安装 OpenShift CLI(
oc)。 - 您已有一个红帽支持问题单 ID。
流程
获取集群节点列表:
$ oc get nodes在目标节点上进入一个 debug 会话。此步骤被实例化为一个名为
<node_name>-debug的 debug pod:$ oc debug node/my-cluster-node将
/host设为 debug shell 中的根目录。debug pod 在 pod 中的/host中挂载主机的 root 文件系统。将根目录改为/host,您可以运行主机可执行路径中包含的二进制文件:# chroot /host在
chroot环境控制台中获取节点接口名称:# ip ad启动
toolbox容器,其中包括运行sosreport所需的二进制文件和插件:# toolbox注意如果一个已存在的
toolboxpod 已在运行,则toolbox命令会输出'toolbox-' already exists.Trying to start….要避免tcpdump出现问题,请使用podman rm toolbox-删除正在运行的 toolbox 容器,并生成新 toolbox 容器。在集群节点中启动
tcpdump会话,并将输出重定向到捕获文件中。这个示例使用ens5作为接口名称:$ tcpdump -nn -s 0 -i ens5 -w /host/var/tmp/my-cluster-node_$(date +%d_%m_%Y-%H_%M_%S-%Z).pcap1 - 1
tcpdump捕获文件路径在chroot环境之外,因为 toolbox 容器会在/host中挂载主机的根目录。
如果节点上的特定容器需要
tcpdump捕获,请按照以下步骤操作。确定目标容器 ID。
chroot host命令先于这一步中的crictl命令,因为 toolbox 容器在/host中挂载主机的根目录:# chroot /host crictl ps确定容器的进程 ID。在本例中,容器 ID 是
a7fe32346b120:# chroot /host crictl inspect --output yaml a7fe32346b120 | grep 'pid' | awk '{print $2}'在容器上启动
tcpdump会话,并将输出重定向到捕获文件中。本例使用49628作为容器的进程 ID,ens5是接口名称。nsenter命令进入目标进程的命名空间并在命名空间中运行命令。因为本例中的目标进程是一个容器的进程 ID,tcpdump命令从主机在容器的命名空间中运行:# nsenter -n -t 49628 -- tcpdump -nn -i ens5 -w /host/var/tmp/my-cluster-node-my-container_$(date +%d_%m_%Y-%H_%M_%S-%Z).pcap1 - 1
tcpdump捕获文件路径在chroot环境之外,因为 toolbox 容器会在/host中挂载主机的根目录。
使用以下方法之一向红帽支持提供
tcpdump捕获文件进行分析。将文件上传到现有红帽支持问题单中。
运行
oc debug node/<node_name>命令调整sosreport归档,并将输出重定向到文件中。此命令假设您已退出以前的oc debug会话:$ oc debug node/my-cluster-node -- bash -c 'cat /host/var/tmp/my-tcpdump-capture-file.pcap' > /tmp/my-tcpdump-capture-file.pcap1 - 1
- debug 容器将主机的根目录挂载到
/host。在指定用于连接的目标文件时,引用 debug 容器的根目录的绝对路径,包括/host。
- 在红帽客户门户网站的 Customer Support 页面中进入现有的支持问题单。
- 选择 Attach files 并按提示上传该文件。
5.8. 为红帽支持提供诊断数据
在调查 OpenShift Dedicated 问题时,红帽支持可能会要求您将诊断数据上传到支持问题单中。可以通过红帽客户门户网站将文件上传到支持问题单中。
先决条件
您可以使用具有
cluster-admin角色的用户访问集群。注意在 OpenShift Dedicated 部署中,没有使用客户云订阅(CCS)模型的客户无法使用
oc debug命令,因为它需要cluster-admin权限。-
已安装 OpenShift CLI(
oc)。 - 您已有一个红帽支持问题单 ID。
流程
通过红帽客户门户网站将诊断数据上传到现有红帽支持问题单中。
使用
oc debug node/<node_name> 命令连接OpenShift Dedicated 节点中包含的诊断文件,并将输出重定向到文件中。以下示例将 debug 容器中的/host/var/tmp/my-diagnostic-data.tar.gz复制到/var/tmp/my-diagnostic-data.tar.gz:$ oc debug node/my-cluster-node -- bash -c 'cat /host/var/tmp/my-diagnostic-data.tar.gz' > /var/tmp/my-diagnostic-data.tar.gz1 - 1
- debug 容器将主机的根目录挂载到
/host。在指定用于连接的目标文件时,引用 debug 容器的根目录的绝对路径,包括/host。
- 在红帽客户门户网站的 Customer Support 页面中进入现有的支持问题单。
- 选择 Attach files 并按提示上传该文件。
5.9. 关于 toolbox
toolbox 是一个在 Red Hat Enterprise Linux CoreOS(RHCOS)系统上启动容器的工具。该工具主要用于启动包含运行 sosreport 等命令所需的二进制文件和插件的容器。
toolbox 容器的主要目的是收集诊断信息并将其提供给红帽支持。但是,如果需要额外的诊断工具,您可以添加 RPM 软件包或运行标准支持工具镜像的替代镜像。
5.9.1. 将软件包安装到 toolbox 容器
默认情况下,运行 toolbox 命令使用 registry.redhat.io/rhel9/support-tools:latest 镜像启动一个容器。该镜像包含最常用的支持工具。如果需要一个不是镜像的一部分的支持工具来收集特定于具体节点的数据,可以安装额外的软件包。
先决条件
-
已使用
oc debug node/<node_name>命令访问节点。 - 您可以使用具有 root 权限的用户访问您的系统。
流程
将
/host设为 debug shell 中的根目录。debug pod 在 pod 中的/host中挂载主机的 root 文件系统。将根目录改为/host,您可以运行主机可执行路径中包含的二进制文件:# chroot /host启动 toolbox 容器:
# toolbox安装额外的软件包,如
wget:# dnf install -y <package_name>
5.9.2. 使用 toolbox 启动备用镜像
默认情况下,运行 toolbox 命令使用 registry.redhat.io/rhel9/support-tools:latest 镜像启动一个容器。
您可以通过创建 .toolboxrc 文件并指定要运行的镜像来启动其他镜像。但是,OpenShift Dedicated 4 不支持运行 support-tools 镜像的旧版本,如 registry.redhat.io/rhel8/support-tools:latest。
先决条件
-
已使用
oc debug node/<node_name>命令访问节点。 - 您可以使用具有 root 权限的用户访问您的系统。
流程
将
/host设为 debug shell 中的根目录。debug pod 在 pod 中的/host中挂载主机的 root 文件系统。将根目录改为/host,您可以运行主机可执行路径中包含的二进制文件:# chroot /host可选: 如果您需要使用替代镜像而不是默认镜像,请在 root 用户 ID 的主目录中创建一个
.toolboxrc文件,并指定镜像元数据:REGISTRY=quay.io1 IMAGE=fedora/fedora:latest2 TOOLBOX_NAME=toolbox-fedora-latest3 输入以下命令启动 toolbox 容器:
# toolbox注意如果一个已存在的
toolboxpod 已在运行,则toolbox命令会输出'toolbox-' already exists.Trying to start….为了避免sosreport插件出现问题,请使用podman rm toolbox-删除正在运行的 toolbox 容器,然后生成新的 toolbox 容器。
第 6 章 集群规格总结
6.1. 使用集群版本对象总结集群规格
您可以通过查询 clusterversion 资源来获取 OpenShift Dedicated 集群规格概述。
先决条件
-
您可以使用具有
dedicated-admin角色的用户访问集群。 -
已安装 OpenShift CLI(
oc)。
流程
查询集群版本、可用性、运行时间以及常规状态:
$ oc get clusterversion输出示例
NAME      VERSION   AVAILABLE   PROGRESSING   SINCE   STATUS
version   4.13.8    True        False         8h      Cluster version is 4.13.8
获取集群规格、更新可用性和更新历史记录的详细概述:
$ oc describe clusterversion输出示例
Name:         version
Namespace:
Labels:       <none>
Annotations:  <none>
API Version:  config.openshift.io/v1
Kind:         ClusterVersion
# ...
    Image:    quay.io/openshift-release-dev/ocp-release@sha256:a956488d295fe5a59c8663a4d9992b9b5d0950f510a7387dbbfb8d20fc5970ce
    URL:      https://access.redhat.com/errata/RHSA-2023:4456
    Version:  4.13.8
  History:
    Completion Time:    2023-08-17T13:20:21Z
    Image:              quay.io/openshift-release-dev/ocp-release@sha256:a956488d295fe5a59c8663a4d9992b9b5d0950f510a7387dbbfb8d20fc5970ce
    Started Time:       2023-08-17T12:59:45Z
    State:              Completed
    Verified:           false
    Version:            4.13.8
# ...
第 7 章 故障排除
7.1. 对 Google Cloud 集群部署上的 OpenShift Dedicated 进行故障排除
由于以下原因,OpenShift Dedicated 可以在 Google Cloud 集群部署错误上发生,包括配额限制和设置不足、错误输入的数据、不兼容的配置等。
在以下部分介绍了如何在 Google Cloud 集群安装错误上解析常见的 OpenShift Dedicated。
下表列出了 OpenShift Dedicated on Google Cloud 安装错误代码以及您可以做什么来解决这些错误。
| 错误代码 | 描述 | 解决方案 |
|---|---|---|
| OCM3022 | Google Cloud 项目 ID 无效。 | 在 Google 云控制台中验证项目 ID,并重试集群创建。 |
| OCM3023 | 未找到 Google Cloud 实例类型。 | 验证实例类型并重试集群创建。 如需有关 Google Cloud 实例类型上的 OpenShift Dedicated 的更多信息,请参阅附加资源部分中的 Google Cloud 实例类型。 |
| OCM3024 | Google Cloud precondition 失败。 | 验证机构策略约束并重试集群创建。 有关机构策略约束的更多信息,请参阅 机构策略限制。 |
| OCM3025 | 超过 Google Cloud SSD 配额限制。 |
在 Google Cloud 控制台或 有关管理持久性磁盘 SSD 配额的更多信息,请参阅 分配配额。 |
| OCM3026 | 超过 Google Cloud 计算配额限制。 | 增加 CPU 计算配额并重试集群安装。 有关 CPU 计算配额的更多信息,请参阅 Compute Engine 配额和限制概述。 |
| OCM3027 | 超过 Google Cloud 服务帐户配额限制。 | 确保您的配额允许额外的未使用的服务帐户。检查 Google Cloud 帐户中配额的当前使用情况,然后重试。 有关管理您的配额的更多信息,请参阅使用控制台管理配额。 |
7.2. 验证节点健康状况
7.2.1. 查看节点状态、资源使用量和配置
查看集群节点健康状况、资源消耗统计和节点日志。另外,在单个节点上查询 kubelet 状态。
先决条件
-
您可以使用具有
dedicated-admin角色的用户访问集群。 -
已安装 OpenShift CLI(
oc)。
流程
列出集群中所有节点的名称、状态和角色:
$ oc get nodes总结集群中每个节点的 CPU 和内存使用情况:
$ oc adm top nodes总结特定节点的 CPU 和内存使用情况:
$ oc adm top node my-node
7.3. Troubleshooting Operator 的问题
Operator 是一种打包、部署和管理 OpenShift Dedicated 应用程序的方法。它可以被看作是软件厂商的工程团队的扩展,可以在 OpenShift Dedicated 监控软件的运行情况,并根据软件的当前状态实时做出决策。Operator 被设计为用来无缝地处理升级过程,并对出现的错误自动进行响应,而且不会采取“捷径”(如跳过软件备份过程来节省时间)。
OpenShift Dedicated 4 包括了一组默认的 Operator,它们是集群正常工作所需的。这些默认 Operator 由 Cluster Version Operator(CVO)管理。
作为集群管理员,您可以使用 OpenShift Dedicated Web 控制台或 CLI 从软件目录中安装应用程序 Operator。然后,您可将 Operator 订阅至一个或多个命名空间,供集群上的开发人员使用。应用程序 Operator 由 Operator Lifecycle Manager(OLM)进行管理。
如果遇到 Operator 问题,请验证 Operator 订阅状态。检查集群中的 Operator pod 健康状况,并收集 Operator 日志以进行诊断。
7.3.1. operator 订阅状况类型
订阅可报告以下状况类型:
| 状况 | 描述 |
|---|---|
|
| 用于解析的一个或多个目录源不健康。 |
|
| 缺少订阅的安装计划。 |
|
| 订阅的安装计划正在安装中。 |
|
| 订阅的安装计划失败。 |
|
| 订阅的依赖项解析失败。 |
默认 OpenShift Dedicated 集群 Operator 由 Cluster Version Operator(CVO)管理,它们没有 Subscription 对象。应用程序 Operator 由 Operator Lifecycle Manager(OLM)管理,它们具有 Subscription 对象。
7.3.2. 使用 CLI 查看 Operator 订阅状态
您可以使用 CLI 查看 Operator 订阅状态。
先决条件
-
您可以使用具有
dedicated-admin角色的用户访问集群。 -
已安装 OpenShift CLI(
oc)。
流程
列出 Operator 订阅:
$ oc get subs -n <operator_namespace>使用
oc describe命令检查Subscription资源:$ oc describe sub <subscription_name> -n <operator_namespace>在命令输出中,找到 Operator 订阅状况类型的
Conditions部分。在以下示例中,CatalogSourcesUnhealthy条件类型具有false状态,因为所有可用目录源都健康:输出示例
Name:         cluster-logging
Namespace:    openshift-logging
Labels:       operators.coreos.com/cluster-logging.openshift-logging=
Annotations:  <none>
API Version:  operators.coreos.com/v1alpha1
Kind:         Subscription
# ...
Conditions:
   Last Transition Time:  2019-07-29T13:42:57Z
   Message:               all available catalogsources are healthy
   Reason:                AllCatalogSourcesHealthy
   Status:                False
   Type:                  CatalogSourcesUnhealthy
# ...
默认 OpenShift Dedicated 集群 Operator 由 Cluster Version Operator(CVO)管理,它们没有 Subscription 对象。应用程序 Operator 由 Operator Lifecycle Manager(OLM)管理,它们具有 Subscription 对象。
7.3.3. 使用 CLI 查看 Operator 目录源状态
您可以使用 CLI 查看 Operator 目录源的状态。
先决条件
-
您可以使用具有
dedicated-admin角色的用户访问集群。 -
已安装 OpenShift CLI(
oc)。
流程
列出命名空间中的目录源。例如,您可以检查
openshift-marketplace命名空间,该命名空间用于集群范围的目录源:$ oc get catalogsources -n openshift-marketplace输出示例
NAME                  DISPLAY               TYPE   PUBLISHER   AGE
certified-operators   Certified Operators   grpc   Red Hat     55m
community-operators   Community Operators   grpc   Red Hat     55m
example-catalog       Example Catalog       grpc   Example Org 2m25s
redhat-operators      Red Hat Operators     grpc   Red Hat     55m
使用
oc describe命令获取有关目录源的详情和状态:$ oc describe catalogsource example-catalog -n openshift-marketplace输出示例
Name:         example-catalog
Namespace:    openshift-marketplace
Labels:       <none>
Annotations:  operatorframework.io/managed-by: marketplace-operator
              target.workload.openshift.io/management: {"effect": "PreferredDuringScheduling"}
API Version:  operators.coreos.com/v1alpha1
Kind:         CatalogSource
# ...
Status:
  Connection State:
    Address:              example-catalog.openshift-marketplace.svc:50051
    Last Connect:         2021-09-09T17:07:35Z
    Last Observed State:  TRANSIENT_FAILURE
  Registry Service:
    Created At:         2021-09-09T17:05:45Z
    Port:               50051
    Protocol:           grpc
    Service Name:       example-catalog
    Service Namespace:  openshift-marketplace
# ...
在上例的输出中,最后观察到的状态是
TRANSIENT_FAILURE。此状态表示目录源建立连接时出现问题。列出创建目录源的命名空间中的 pod:
$ oc get pods -n openshift-marketplace输出示例
NAME                                    READY   STATUS             RESTARTS   AGE
certified-operators-cv9nn               1/1     Running            0          36m
community-operators-6v8lp               1/1     Running            0          36m
marketplace-operator-86bfc75f9b-jkgbc   1/1     Running            0          42m
example-catalog-bwt8z                   0/1     ImagePullBackOff   0          3m55s
redhat-operators-smxx8                  1/1     Running            0          36m
在命名空间中创建目录源时,会在该命名空间中为目录源创建一个 pod。在前面的示例中,
example-catalog-bwt8zpod 的状态是ImagePullBackOff。此状态表示拉取目录源的索引镜像存在问题。使用
oc describe命令检查 pod 以获取更多详细信息:$ oc describe pod example-catalog-bwt8z -n openshift-marketplace输出示例
Name:         example-catalog-bwt8z
Namespace:    openshift-marketplace
Priority:     0
Node:         ci-ln-jyryyg2-f76d1-ggdbq-worker-b-vsxjd/10.0.128.2
...
Events:
  Type     Reason          Age                From               Message
  ----     ------          ----               ----               -------
  Normal   Scheduled       48s                default-scheduler  Successfully assigned openshift-marketplace/example-catalog-bwt8z to ci-ln-jyryyf2-f76d1-fgdbq-worker-b-vsxjd
  Normal   AddedInterface  47s                multus             Add eth0 [10.131.0.40/23] from openshift-sdn
  Normal   BackOff         20s (x2 over 46s)  kubelet            Back-off pulling image "quay.io/example-org/example-catalog:v1"
  Warning  Failed          20s (x2 over 46s)  kubelet            Error: ImagePullBackOff
  Normal   Pulling         8s (x3 over 47s)   kubelet            Pulling image "quay.io/example-org/example-catalog:v1"
  Warning  Failed          8s (x3 over 47s)   kubelet            Failed to pull image "quay.io/example-org/example-catalog:v1": rpc error: code = Unknown desc = reading manifest v1 in quay.io/example-org/example-catalog: unauthorized: access to the requested resource is not authorized
  Warning  Failed          8s (x3 over 47s)   kubelet            Error: ErrImagePull
在前面的示例输出中,错误消息表示目录源的索引镜像因为授权问题而无法成功拉取。例如,索引镜像可能存储在需要登录凭证的 registry 中。
7.3.4. 查询 Operator pod 状态
您可以列出集群中的 Operator pod 及其状态。您还可以收集详细的 Operator pod 概述。
先决条件
-
您可以使用具有
dedicated-admin角色的用户访问集群。 - API 服务仍然可以正常工作。
-
已安装 OpenShift CLI(
oc)。
流程
列出集群中运行的 Operator。输出包括 Operator 版本、可用性和运行时间信息:
$ oc get clusteroperators列出在 Operator 命名空间中运行的 Operator pod,以及 pod 状态、重启和年龄:
$ oc get pod -n <operator_namespace>输出详细的 Operator pod 概述:
$ oc describe pod <operator_pod_name> -n <operator_namespace>
7.3.5. 收集 Operator 日志
如果遇到 Operator 问题,您可以从 Operator pod 日志中收集详细诊断信息。
先决条件
-
您可以使用具有
dedicated-admin角色的用户访问集群。 - API 服务仍然可以正常工作。
-
已安装 OpenShift CLI(
oc)。 - 您有 control plane 或 control plane 机器的完全限定域名。
流程
列出在 Operator 命名空间中运行的 Operator pod,以及 pod 状态、重启和年龄:
$ oc get pods -n <operator_namespace>检查 Operator pod 的日志:
$ oc logs pod/<pod_name> -n <operator_namespace>如果 Operator pod 具有多个容器,则上述命令将会产生一个错误,其中包含每个容器的名称。从独立容器查询日志:
$ oc logs pod/<operator_pod_name> -c <container_name> -n <operator_namespace>如果 API 无法正常工作,请使用 SSH 来查看每个 control plane 节点上的 Operator pod 和容器日志。将
<master-node>.<cluster_name>.<base_domain>替换为适当的值。列出每个 control plane 节点上的 pod:
$ ssh core@<master-node>.<cluster_name>.<base_domain> sudo crictl pods对于任何未显示
Ready状态的 Operator pod,详细检查 Pod 的状态。将<operator_pod_id>替换为上一命令输出中列出的 Operator pod ID:$ ssh core@<master-node>.<cluster_name>.<base_domain> sudo crictl inspectp <operator_pod_id>列出与 Operator pod 相关的容器:
$ ssh core@<master-node>.<cluster_name>.<base_domain> sudo crictl ps --pod=<operator_pod_id>对于任何未显示
Ready状态的 Operator 容器,请详细检查容器的状态。将<container_id>替换为上一命令输出中列出的容器 ID:$ ssh core@<master-node>.<cluster_name>.<base_domain> sudo crictl inspect <container_id>检查任何未显示
Ready状态的 Operator 容器的日志。将<container_id>替换为上一命令输出中列出的容器 ID:$ ssh core@<master-node>.<cluster_name>.<base_domain> sudo crictl logs -f <container_id>注意运行 Red Hat Enterprise Linux CoreOS (RHCOS)的 OpenShift Dedicated 4 集群节点不可变,它依赖于 Operator 来应用集群更改。不建议使用 SSH 访问集群节点。在尝试通过 SSH 收集诊断数据前,请运行
oc adm must gather和其他oc命令看它们是否可以提供足够的数据。但是,如果 OpenShift Dedicated API 不可用,或 kubelet 在目标节点上无法正常工作,oc操作将会受到影响。在这种情况下,可以使用ssh core@<node>.<cluster_name>.<base_domain>来访问节点。
7.4. 检查 pod 问题
OpenShift Dedicated 利用 Kubernetes 的 pod 概念,它是共同部署在同一主机上的一个或多个容器。pod 是可在 OpenShift Dedicated 4 上定义、部署和管理的最小计算单元。
在定义了 pod 后,它将分配到节点上运行,直到容器退出,或直到它被删除为止。根据策略和退出代码,Pod 可在退出或保留后删除,以便访问其日志。
首先要检查 pod 出现问题时 pod 的状态。如果发生 pod 故障,请观察 pod 的错误状态以识别特定镜像、容器或 pod 网络问题。根据错误状态集中诊断数据收集。查看 pod 事件消息以及 pod 和容器日志信息。通过访问命令行中运行的 pod,或根据 Pod 的部署配置启动具有 root 访问权限的调试 pod 来动态诊断问题。
7.4.1. 了解 pod 错误状态
pod 失败返回显式错误状态,可在 oc get pods 输出的 status 字段中观察到。Pod 错误状态会涵盖镜像、容器和容器网络相关的故障。
下表提供了 pod 错误状态及其描述列表。
| Pod 错误状态 | 描述 |
|---|---|
|
| 通用镜像检索错误。 |
|
| 镜像检索失败。 |
|
| 指定镜像名称无效。 |
|
| 镜像检查没有成功。 |
|
|
|
|
| 当尝试从 registry 检索镜像时,会出现 HTTP 错误。 |
|
| 指定容器在声明的 pod 中不存在或未由 kubelet 管理。 |
|
| 容器初始化失败。 |
|
| pod 的容器都没有成功启动。 |
|
| 没有 pod 的容器被成功终止。 |
|
| 容器已终止。kubelet 将不会试图重启它。 |
|
| 容器或镜像尝试使用 root 权限运行。 |
|
| Pod 沙盒创建没有成功。 |
|
| Pod 沙盒配置没有获得。 |
|
| pod 沙箱没有成功停止。 |
|
| 网络初始化失败。 |
|
| 网络终止失败。 |
7.4.2. 检查 pod 状态
您可以查询 pod 状态和错误状态。您还可以查询 pod 的相关部署配置,并查看基础镜像的可用性。
先决条件
-
您可以使用具有
dedicated-admin角色的用户访问集群。 -
已安装 OpenShift CLI(
oc)。 -
已安装了
skopeo。
流程
切换到项目:
$ oc project <project_name>列出在命名空间中运行的 pod,以及 pod 状态、错误状态、重启和年龄:
$ oc get pods确定命名空间是否由部署配置管理:
$ oc status如果命名空间由部署配置管理,输出包括部署配置名称和基础镜像引用。
检查以上命令输出中引用的基础镜像:
$ skopeo inspect docker://<image_reference>如果基础镜像引用不正确,请更新部署配置中的引用:
$ oc edit deployment/my-deployment当部署配置退出时,配置将自动重新部署。在部署过程中的 Watch pod 的状态,以确定这个问题是否已解决:
$ oc get pods -w检查命名空间中的事件,以了解与 pod 失败相关的诊断信息:
$ oc get events
7.4.3. 检查 pod 和容器日志
您可以检查 pod 和容器日志,以查看与显式 pod 失败相关的警告和错误消息。根据策略和退出代码,pod 和容器日志在 pod 终止后仍然可用。
先决条件
-
您可以使用具有
dedicated-admin角色的用户访问集群。 - API 服务仍然可以正常工作。
-
已安装 OpenShift CLI(
oc)。
流程
查询特定 pod 的日志:
$ oc logs <pod_name>查询 pod 中特定容器的日志:
$ oc logs <pod_name> -c <container_name>由前面的
oc logs命令所获得的日志由发送到 pod 或容器中的 stdout 的信息组成。检查 pod 中的
/var/log/中包含的日志。列出 pod 中
/var/log中所含的日志文件和子目录:$ oc exec <pod_name> -- ls -alh /var/log输出示例
total 124K
drwxr-xr-x. 1 root root   33 Aug 11 11:23 .
drwxr-xr-x. 1 root root   28 Sep  6  2022 ..
-rw-rw----. 1 root utmp    0 Jul 10 10:31 btmp
-rw-r--r--. 1 root root  33K Jul 17 10:07 dnf.librepo.log
-rw-r--r--. 1 root root  69K Jul 17 10:07 dnf.log
-rw-r--r--. 1 root root 8.8K Jul 17 10:07 dnf.rpm.log
-rw-r--r--. 1 root root  480 Jul 17 10:07 hawkey.log
-rw-rw-r--. 1 root utmp    0 Jul 10 10:31 lastlog
drwx------. 2 root root   23 Aug 11 11:14 openshift-apiserver
drwx------. 2 root root    6 Jul 10 10:31 private
drwxr-xr-x. 1 root root   22 Mar  9 08:05 rhsm
-rw-rw-r--. 1 root utmp    0 Jul 10 10:31 wtmp
查询 pod 中
/var/log中所含的特定日志文件:$ oc exec <pod_name> cat /var/log/<path_to_log>输出示例
2023-07-10T10:29:38+0000 INFO --- logging initialized ---
2023-07-10T10:29:38+0000 DDEBUG timer: config: 13 ms
2023-07-10T10:29:38+0000 DEBUG Loaded plugins: builddep, changelog, config-manager, copr, debug, debuginfo-install, download, generate_completion_cache, groups-manager, needs-restarting, playground, product-id, repoclosure, repodiff, repograph, repomanage, reposync, subscription-manager, uploadprofile
2023-07-10T10:29:38+0000 INFO Updating Subscription Management repositories.
2023-07-10T10:29:38+0000 INFO Unable to read consumer identity
2023-07-10T10:29:38+0000 INFO Subscription Manager is operating in container mode.
2023-07-10T10:29:38+0000 INFO
列出特定容器内
/var/log中含有的日志文件和子目录:$ oc exec <pod_name> -c <container_name> ls /var/log查询特定容器中的
/var/log中所含的特定日志文件:$ oc exec <pod_name> -c <container_name> cat /var/log/<path_to_log>
7.4.4. 访问运行的 pod
您可以通过在 pod 中打开 shell,或通过端口转发获取网络访问,来动态查看正在运行的 pod。
先决条件
-
您可以使用具有
dedicated-admin角色的用户访问集群。 - API 服务仍然可以正常工作。
-
已安装 OpenShift CLI(
oc)。
流程
切换到包含您要访问的 pod 的项目。这是必要的,因为
oc rsh命令不支持使用-n选项指定命名空间:$ oc project <namespace>启动到 pod 的远程 shell:
$ oc rsh <pod_name>1 - 1
- 如果 pod 有多个容器,除非使用
-c <container_name>指定了一个容器,否则oc rsh会默认使用第一个容器。
启动至 pod 中的特定容器中的一个远程 shell :
$ oc rsh -c <container_name> pod/<pod_name>创建一个端口转发会话到 pod 上的端口:
$ oc port-forward <pod_name> <host_port>:<pod_port>1 - 1
- 输入
Ctrl+C来取消端口转发会话。
7.4.5. 启动具有 root 访问权限的 debug pod
您可以基于一个有问题的 pod 部署或部署配置,启动具有根访问权限的 debug pod。pod 用户通常使用非 root 权限运行,但运行具有临时 root 特权的 pod 进行故障排除时在调查问题时很有用:
先决条件
-
您可以使用具有
dedicated-admin角色的用户访问集群。 - API 服务仍然可以正常工作。
-
已安装 OpenShift CLI(
oc)。
流程
根据一个部署启动具有 root 访问权限的 debug pod。
获取项目部署名称:
$ oc get deployment -n <project_name>根据部署启动带有 root 权限的 debug pod:
$ oc debug deployment/my-deployment --as-root -n <project_name>
根据部署配置启动具有 root 访问权限的 debug pod。
获取项目的部署配置名称:
$ oc get deploymentconfigs -n <project_name>根据部署配置,使用 root 权限启动 debug pod:
$ oc debug deploymentconfig/my-deployment-configuration --as-root -n <project_name>
您可以将 -- <command> 附加到前面的 oc debug 命令中,以便在 debug pod 中运行单个命令,而不是运行交互式 shell。
7.4.6. 将文件复制到 pod 和容器,或从 pod 和容器中复制
您可以将文件复制到 pod 或从 pod 复制,以测试配置更改或收集诊断信息。
先决条件
-
您可以使用具有
dedicated-admin角色的用户访问集群。 - API 服务仍然可以正常工作。
-
已安装 OpenShift CLI(
oc)。
7.5. 对 Source-to-Image 进行故障排除
7.5.1. Source-to-Image 故障排除策略
Source-to-Image (S2I) 是一种用于构建可重复生成的 Docker 格式容器镜像的工具。它通过将应用程序源代码注入容器镜像,并汇编新镜像来生成可随时运行的镜像。新镜像融合了基础镜像(构建器)和构建的源。
流程
要确定 S2I 进程中的故障发生位置,您可以观察与以下 S2I 阶段相关的 pod 状态:
- 在构建配置阶段,构建 pod 用于从基础镜像和应用程序源代码创建应用程序容器镜像。
- 在部署配置阶段,部署 pod 用于从构建配置阶段构建的应用程序容器镜像中部署应用程序 pod。部署 pod 还会部署其他资源,如服务和路由。部署配置在构建配置成功后开始。
-
在部署 pod 启动应用程序 pod 后,应用程序故障可能会在运行的应用程序 pod 中发生。例如,即使应用程序 pod 处于
Running状态,应用程序的行为也可能不会如预期。在这种情况下,您可以访问正在运行的应用程序 pod,以调查 pod 中的应用程序故障。
当对 S2I 问题进行故障排除时,请按照这个策略操作:
- 监控构建、部署和应用程序 pod 状态。
- 确定发生问题 S2I 流程的阶段。
- 检查与失败阶段对应的日志。
7.5.2. 收集 Source-to-Image 诊断数据
S2I 工具按顺序运行构建 pod 和部署 pod。部署 pod 负责根据构建阶段创建的应用程序容器镜像部署应用程序 pod。观察构建、部署和应用程序 pod 状态,以确定 S2I 进程中的故障发生位置。然后,重点收集诊断数据。
先决条件
-
您可以使用具有
dedicated-admin角色的用户访问集群。 - API 服务仍然可以正常工作。
-
已安装 OpenShift CLI(
oc)。
流程
在整个 S2I 过程中监控 pod 状态,以确定在哪个阶段发生故障:
$ oc get pods -w1 - 1
- 使用
-w来监控 pod 是否有变化,直到您使用Ctrl+C退出命令。
检查 pod 失败的日志以找出错误。
如果构建 pod 失败,请检查构建 pod 的日志:
$ oc logs -f pod/<application_name>-<build_number>-build注意另外,您可以使用
oc logs -f bc/<application_name>来查看构建配置的日志。构建配置的日志包括来自构建 pod 的日志。如果部署 pod 失败,请查看部署 pod 的日志:
$ oc logs -f pod/<application_name>-<build_number>-deploy注意另外,您可以使用
oc logs -f bc/<application_name>来查看部署配置的日志。此操作会从部署 pod 输出日志,直到部署 pod 成功完成为止。如果在部署 pod 完成后运行,命令会输出来自应用程序 pod 的日志。部署 pod 完成后,仍可通过运行oc logs -f pod/<application_name>-<build_number>-deploy来访问其日志。如果应用程序 pod 失败,或者应用程序没有如预期在正在运行的应用程序 pod 中发生,请查看应用程序 pod 的日志:
$ oc logs -f pod/<application_name>-<build_number>-<random_string>
7.5.3. 收集应用程序诊断数据以调查应用程序失败
应用程序故障可在运行的应用程序 pod 中发生。在这些情况下,您可以使用以下策略检索诊断信息:
- 检查与应用程序 pod 相关的事件。
- 查看应用程序 pod 的日志,包括不是由 OpenShift Logging 框架收集的特定应用程序日志文件。
- 以互动方式测试应用程序功能,并在应用程序容器中运行诊断工具。
先决条件
-
您可以使用具有
dedicated-admin角色的用户访问集群。 -
已安装 OpenShift CLI(
oc)。
流程
列出与特定应用程序 pod 相关的事件。以下示例检索名为
my-app-1-akdlg的应用程序 pod 的事件:$ oc describe pod/my-app-1-akdlg检查应用程序 pod 的日志:
$ oc logs -f pod/my-app-1-akdlg在正在运行的应用程序 pod 中查询特定日志。发送到 stdout 的日志由 OpenShift Logging 框架收集,并包含在上一命令的输出中。以下查询只适用于没有发送到 stdout 的日志。
如果应用程序日志可以在 pod 内不需要 root 权限的情况下就可以进行访问,则按如下方式处理日志文件:
$ oc exec my-app-1-akdlg -- cat /var/log/my-application.log如果需要 root 访问权限才能查看应用程序日志,您可以启动具有 root 权限的 debug 容器,然后从容器内查看日志文件。从项目的
DeploymentConfig对象启动 debug 容器。pod 用户通常使用非 root 权限运行,但运行具有临时 root 特权的 pod 进行故障排除时在调查问题时很有用:$ oc debug dc/my-deployment-configuration --as-root -- cat /var/log/my-application.log注意如果您运行不使用
-- <command>的oc debug dc/<deployment_configuration> --as-root,则可以获得 debug pod 内带有 root 权限的一个互动式 shell 。
以互动方式测试应用程序功能,并在带有互动 shell 的应用程序容器中运行诊断工具。
在应用程序容器上启动一个交互式 shell:
$ oc exec -it my-app-1-akdlg /bin/bash- 在 shell 中以互动方式测试应用程序功能。例如,您可以运行容器的入口点命令并观察结果。然后,在更新源代码并通过 S2I 进程重建应用程序容器前,直接从命令行测试更改。
运行容器中的诊断二进制文件。
注意运行一些诊断二进制文件需要 root 权限。在这些情况下,您可以通过运行
oc debug dc/<deployment_configuration> --as-root,根据有问题的 pod 的DeploymentConfig对象启动一个带有 root 访问权限的 debug pod。然后,您可以从 debug pod 中以 root 用户身份运行诊断二进制文件。
7.6. 存储问题故障排除
7.6.1. 解决多附件错误
当节点崩溃或立即关闭时,预期会从节点卸载附加的 ReadWriteOnce(RWO)卷,以便被调度到另一节点上的 pod 使用。
但是,不可能在新节点中挂载,因为失败的节点无法卸载附加的卷。
报告了一个 multi-attach 错误:
输出示例
Unable to attach or mount volumes: unmounted volumes=[sso-mysql-pvol], unattached volumes=[sso-mysql-pvol default-token-x4rzc]: timed out waiting for the condition
Multi-Attach error for volume "pvc-8837384d-69d7-40b2-b2e6-5df86943eef9" Volume is already used by pod(s) sso-mysql-1-ns6b4
流程
要解决 multi-attach 问题,请使用以下解决方案之一:
使用 RWX 卷启用多个附件。
对于大多数存储解决方案,您可以使用 ReadWriteMany(RWX)卷以防止多附加错误。
使用 RWO 卷时,恢复或删除故障节点。
对于不支持 RWX 的存储,如 VMware vSphere,必须改为使用 RWO 卷。但是, RWO 卷无法挂载到多个节点上。
如果您遇到带有 RWO 卷的多附件错误消息,请强制在关闭或崩溃的节点上删除 pod,以避免关键工作负载中的数据丢失,例如在附加动态持久性卷时。
$ oc delete pod <old_pod> --force=true --grace-period=0该命令会在 6 分钟后删除处于关闭或崩溃的节点上的卷。
7.7. 调查监控问题
OpenShift Dedicated 包括一个预配置、预安装和自我更新的监控堆栈,为核心平台组件提供监控。在 OpenShift Dedicated 4 中,集群管理员可以选择性地为用户定义的项目启用监控。
如果出现问题,请使用这些步骤:
- 您自己的指标不可用。
- Prometheus 消耗大量磁盘空间。
-
KubePersistentVolumeFillingUp警报正在触发 Prometheus。
7.7.2. 确定为什么 Prometheus 消耗大量磁盘空间
开发人员可以使用键值对的形式为指标定义属性。潜在的键值对数量与属性的可能值数量对应。具有无限数量可能值的属性被称为未绑定属性。例如,customer_id 属性不绑定,因为它有无限多个可能的值。
每个分配的键值对都有唯一的时间序列。在标签中使用许多未绑定属性可导致所创建的时间序列数量出现指数增加。这可能会影响 Prometheus 性能,并消耗大量磁盘空间。
当 Prometheus 消耗大量磁盘时,您可以使用以下方法:
- 使用 Prometheus HTTP API 检查时间序列数据库(TSDB)状态,以了解有关哪些标签创建最多时间序列数据的更多信息。这样做需要集群管理员特权。
- 检查正在收集的提取示例数量。
要减少创建的唯一时间序列数量,您可以减少分配给用户定义的指标的未绑定属性数量
注意使用绑定到一组有限可能值的属性可减少潜在的键-值对组合数量。
- 对可在用户定义的项目中提取的示例数量实施限制。这需要集群管理员特权。
先决条件
-
您可以使用具有
dedicated-admin角色的用户访问集群。 -
已安装 OpenShift CLI(
oc)。
流程
- 在 OpenShift Dedicated Web 控制台中,进入 Observe → Metrics。
在 Expression 字段中输入 Prometheus Query Language (PromQL) 查询。以下示例查询有助于识别可能导致高磁盘空间消耗的高卡性指标:
通过运行以下查询,您可以识别具有最高提取示例数的十个作业:
topk(10, max by(namespace, job) (topk by(namespace, job) (1, scrape_samples_post_metric_relabeling)))通过运行以下查询,您可以通过识别在上一小时内创建了最多时间序列数据的十个作业,从而找出相关的时间序列:
topk(10, sum by(namespace, job) (sum_over_time(scrape_series_added[1h])))
如果指标的提取示例数大于预期,请检查分配给指标的未绑定标签值数量:
- 如果指标与用户定义的项目相关,请查看分配给您的工作负载的指标键-值对。它们通过应用程序级别的 Prometheus 客户端库实施。尝试限制标签中引用的未绑定属性数量。
- 如果指标与 OpenShift Dedicated 核心项目相关,请在红帽客户门户网站上创建一个红帽支持问题单。
以
dedicated-admin身份登录时,按照以下步骤使用 Prometheus HTTP API 查看 TSDB 状态:运行以下命令来获取 Prometheus API 路由 URL:
$ HOST=$(oc -n openshift-monitoring get route prometheus-k8s -ojsonpath='{.status.ingress[].host}')运行以下命令来提取身份验证令牌:
$ TOKEN=$(oc whoami -t)运行以下命令,查询 Prometheus 的 TSDB 状态:
$ curl -H "Authorization: Bearer $TOKEN" -k "https://$HOST/api/v1/status/tsdb"输出示例
"status": "success","data":{"headStats":{"numSeries":507473,
"numLabelPairs":19832,"chunkCount":946298,"minTime":1712253600010,
"maxTime":1712257935346},"seriesCountByMetricName":
[{"name":"etcd_request_duration_seconds_bucket","value":51840},
{"name":"apiserver_request_sli_duration_seconds_bucket","value":47718},
...
7.8. 诊断 OpenShift CLI(oc)问题
7.8.1. 了解 OpenShift CLI(oc)日志级别
使用 OpenShift CLI (oc),您可以从终端创建应用程序并管理 OpenShift Dedicated 项目。
如果出现特定于 oc 命令的问题,将 oc 日志级别提高为输出 API 请求、API 响应以及命令生成的 curl 请求详情。这提供了特定的 oc 命令的底层操作信息,以帮助您了解故障的本质。
oc 日志级别范围从 1 到 10。下表提供了 oc 日志级别列表及其描述。
| 日志级别 | 描述 |
|---|---|
| 1 到 5 | 没有额外的日志记录到 stderr。 |
| 6 | 为 stderr 记录 API 请求。 |
| 7 | 将 API 请求和标头记录到 stderr。 |
| 8 | 记录 API 请求、标头和正文,以及 API 响应标头和正文到 stderr。 |
| 9 |
记录日志 API 请求、标头和正文、API 响应标头和正文,以及 |
| 10 |
记录日志 API 请求、标头和正文、API 响应标头和正文,以及 |
7.8.2. 指定 OpenShift CLI(oc)日志级别
您可以通过提高命令的日志级别来调查 OpenShift CLI(oc)问题。
OpenShift Dedicated 用户的当前会话令牌通常包含在记录的 curl 请求中。您还可以手动获取当前用户的会话令牌,以便在测试 oc 命令的底层进程的各个方面时使用。
先决条件
-
安装 OpenShift CLI (
oc) 。
流程
在运行
oc命令时指定oc日志级别:$ oc <command> --loglevel <log_level>其中:
- <command>
- 指定您正在运行的命令。
- <log_level>
- 指定要应用到命令的日志级别。
要获取当前用户的会话令牌,请运行以下命令:
$ oc whoami -t输出示例
sha256~RCV3Qcn7H-OEfqCGVI0CvnZ6...
7.9. 红帽受管资源
7.9.1. 概述
以下涵盖了由 Service Reliability Engineering Platform (SRE-P)团队管理或保护的所有 OpenShift Dedicated 资源。客户不得修改这些资源,因为这样做可能会导致集群不稳定。
7.9.2. Hive 受管资源
以下列表显示了由 OpenShift Hive 管理的 OpenShift Dedicated 资源,即集中式配置管理系统。除了安装期间创建的 OpenShift Container Platform 资源外,这些资源还除外。OpenShift Hive 持续尝试保持所有 OpenShift Dedicated 集群的一致性。应该通过 OpenShift Cluster Manager 对 OpenShift Dedicated 资源进行更改,以便 OpenShift Cluster Manager 和 Hive 同步。如果 OpenShift Cluster Manager 不支持修改问题中的资源,请联系 ocm-feedback@redhat.com。
例 7.1. Hive 受管资源列表
Resources:
  ConfigMap:
  - namespace: openshift-config
    name: rosa-brand-logo
  - namespace: openshift-console
    name: custom-logo
  - namespace: openshift-deployment-validation-operator
    name: deployment-validation-operator-config
  - namespace: openshift-file-integrity
    name: fr-aide-conf
  - namespace: openshift-managed-upgrade-operator
    name: managed-upgrade-operator-config
  - namespace: openshift-monitoring
    name: cluster-monitoring-config
  - namespace: openshift-monitoring
    name: managed-namespaces
  - namespace: openshift-monitoring
    name: ocp-namespaces
  - namespace: openshift-monitoring
    name: osd-rebalance-infra-nodes
  - namespace: openshift-monitoring
    name: sre-dns-latency-exporter-code
  - namespace: openshift-monitoring
    name: sre-dns-latency-exporter-trusted-ca-bundle
  - namespace: openshift-monitoring
    name: sre-ebs-iops-reporter-code
  - namespace: openshift-monitoring
    name: sre-ebs-iops-reporter-trusted-ca-bundle
  - namespace: openshift-monitoring
    name: sre-stuck-ebs-vols-code
  - namespace: openshift-monitoring
    name: sre-stuck-ebs-vols-trusted-ca-bundle
  - namespace: openshift-security
    name: osd-audit-policy
  - namespace: openshift-validation-webhook
    name: webhook-cert
  - namespace: openshift
    name: motd
  Endpoints:
  - namespace: openshift-deployment-validation-operator
    name: deployment-validation-operator-metrics
  - namespace: openshift-monitoring
    name: sre-dns-latency-exporter
  - namespace: openshift-monitoring
    name: sre-ebs-iops-reporter
  - namespace: openshift-monitoring
    name: sre-stuck-ebs-vols
  - namespace: openshift-scanning
    name: loggerservice
  - namespace: openshift-security
    name: audit-exporter
  - namespace: openshift-validation-webhook
    name: validation-webhook
  Namespace:
  - name: dedicated-admin
  - name: openshift-addon-operator
  - name: openshift-aqua
  - name: openshift-aws-vpce-operator
  - name: openshift-backplane
  - name: openshift-backplane-cee
  - name: openshift-backplane-csa
  - name: openshift-backplane-cse
  - name: openshift-backplane-csm
  - name: openshift-backplane-managed-scripts
  - name: openshift-backplane-mobb
  - name: openshift-backplane-srep
  - name: openshift-backplane-tam
  - name: openshift-cloud-ingress-operator
  - name: openshift-codeready-workspaces
  - name: openshift-compliance
  - name: openshift-compliance-monkey
  - name: openshift-container-security
  - name: openshift-custom-domains-operator
  - name: openshift-customer-monitoring
  - name: openshift-deployment-validation-operator
  - name: openshift-managed-node-metadata-operator
  - name: openshift-file-integrity
  - name: openshift-logging
  - name: openshift-managed-upgrade-operator
  - name: openshift-must-gather-operator
  - name: openshift-observability-operator
  - name: openshift-ocm-agent-operator
  - name: openshift-operators-redhat
  - name: openshift-osd-metrics
  - name: openshift-rbac-permissions
  - name: openshift-route-monitor-operator
  - name: openshift-scanning
  - name: openshift-security
  - name: openshift-splunk-forwarder-operator
  - name: openshift-sre-pruning
  - name: openshift-suricata
  - name: openshift-validation-webhook
  - name: openshift-velero
  - name: openshift-monitoring
  - name: openshift
  - name: openshift-cluster-version
  - name: keycloak
  - name: goalert
  - name: configure-goalert-operator
  ReplicationController:
  - namespace: openshift-monitoring
    name: sre-ebs-iops-reporter-1
  - namespace: openshift-monitoring
    name: sre-stuck-ebs-vols-1
  Secret:
  - namespace: openshift-authentication
    name: v4-0-config-user-idp-0-file-data
  - namespace: openshift-authentication
    name: v4-0-config-user-template-error
  - namespace: openshift-authentication
    name: v4-0-config-user-template-login
  - namespace: openshift-authentication
    name: v4-0-config-user-template-provider-selection
  - namespace: openshift-config
    name: htpasswd-secret
  - namespace: openshift-config
    name: osd-oauth-templates-errors
  - namespace: openshift-config
    name: osd-oauth-templates-login
  - namespace: openshift-config
    name: osd-oauth-templates-providers
  - namespace: openshift-config
    name: rosa-oauth-templates-errors
  - namespace: openshift-config
    name: rosa-oauth-templates-login
  - namespace: openshift-config
    name: rosa-oauth-templates-providers
  - namespace: openshift-config
    name: support
  - namespace: openshift-config
    name: tony-devlab-primary-cert-bundle-secret
  - namespace: openshift-ingress
    name: tony-devlab-primary-cert-bundle-secret
  - namespace: openshift-kube-apiserver
    name: user-serving-cert-000
  - namespace: openshift-kube-apiserver
    name: user-serving-cert-001
  - namespace: openshift-monitoring
    name: dms-secret
  - namespace: openshift-monitoring
    name: observatorium-credentials
  - namespace: openshift-monitoring
    name: pd-secret
  - namespace: openshift-scanning
    name: clam-secrets
  - namespace: openshift-scanning
    name: logger-secrets
  - namespace: openshift-security
    name: splunk-auth
  ServiceAccount:
  - namespace: openshift-backplane-managed-scripts
    name: osd-backplane
  - namespace: openshift-backplane-srep
    name: 6804d07fb268b8285b023bcf65392f0e
  - namespace: openshift-backplane-srep
    name: osd-delete-ownerrefs-serviceaccounts
  - namespace: openshift-backplane
    name: osd-delete-backplane-serviceaccounts
  - namespace: openshift-cloud-ingress-operator
    name: cloud-ingress-operator
  - namespace: openshift-custom-domains-operator
    name: custom-domains-operator
  - namespace: openshift-managed-upgrade-operator
    name: managed-upgrade-operator
  - namespace: openshift-machine-api
    name: osd-disable-cpms
  - namespace: openshift-marketplace
    name: osd-patch-subscription-source
  - namespace: openshift-monitoring
    name: configure-alertmanager-operator
  - namespace: openshift-monitoring
    name: osd-cluster-ready
  - namespace: openshift-monitoring
    name: osd-rebalance-infra-nodes
  - namespace: openshift-monitoring
    name: sre-dns-latency-exporter
  - namespace: openshift-monitoring
    name: sre-ebs-iops-reporter
  - namespace: openshift-monitoring
    name: sre-stuck-ebs-vols
  - namespace: openshift-network-diagnostics
    name: sre-pod-network-connectivity-check-pruner
  - namespace: openshift-ocm-agent-operator
    name: ocm-agent-operator
  - namespace: openshift-rbac-permissions
    name: rbac-permissions-operator
  - namespace: openshift-splunk-forwarder-operator
    name: splunk-forwarder-operator
  - namespace: openshift-sre-pruning
    name: bz1980755
  - namespace: openshift-scanning
    name: logger-sa
  - namespace: openshift-scanning
    name: scanner-sa
  - namespace: openshift-sre-pruning
    name: sre-pruner-sa
  - namespace: openshift-suricata
    name: suricata-sa
  - namespace: openshift-validation-webhook
    name: validation-webhook
  - namespace: openshift-velero
    name: managed-velero-operator
  - namespace: openshift-velero
    name: velero
  - namespace: openshift-backplane-srep
    name: UNIQUE_BACKPLANE_SERVICEACCOUNT_ID
  Service:
  - namespace: openshift-deployment-validation-operator
    name: deployment-validation-operator-metrics
  - namespace: openshift-monitoring
    name: sre-dns-latency-exporter
  - namespace: openshift-monitoring
    name: sre-ebs-iops-reporter
  - namespace: openshift-monitoring
    name: sre-stuck-ebs-vols
  - namespace: openshift-scanning
    name: loggerservice
  - namespace: openshift-security
    name: audit-exporter
  - namespace: openshift-validation-webhook
    name: validation-webhook
  AddonOperator:
  - name: addon-operator
  ValidatingWebhookConfiguration:
  - name: sre-hiveownership-validation
  - name: sre-namespace-validation
  - name: sre-pod-validation
  - name: sre-prometheusrule-validation
  - name: sre-regular-user-validation
  - name: sre-scc-validation
  - name: sre-techpreviewnoupgrade-validation
  DaemonSet:
  - namespace: openshift-monitoring
    name: sre-dns-latency-exporter
  - namespace: openshift-scanning
    name: logger
  - namespace: openshift-scanning
    name: scanner
  - namespace: openshift-security
    name: audit-exporter
  - namespace: openshift-suricata
    name: suricata
  - namespace: openshift-validation-webhook
    name: validation-webhook
  DeploymentConfig:
  - namespace: openshift-monitoring
    name: sre-ebs-iops-reporter
  - namespace: openshift-monitoring
    name: sre-stuck-ebs-vols
  ClusterRoleBinding:
  - name: aqua-scanner-binding
  - name: backplane-cluster-admin
  - name: backplane-impersonate-cluster-admin
  - name: bz1980755
  - name: configure-alertmanager-operator-prom
  - name: dedicated-admins-cluster
  - name: dedicated-admins-registry-cas-cluster
  - name: logger-clusterrolebinding
  - name: openshift-backplane-managed-scripts-reader
  - name: osd-cluster-admin
  - name: osd-cluster-ready
  - name: osd-delete-backplane-script-resources
  - name: osd-delete-ownerrefs-serviceaccounts
  - name: osd-patch-subscription-source
  - name: osd-rebalance-infra-nodes
  - name: pcap-dedicated-admins
  - name: splunk-forwarder-operator
  - name: splunk-forwarder-operator-clusterrolebinding
  - name: sre-pod-network-connectivity-check-pruner
  - name: sre-pruner-buildsdeploys-pruning
  - name: velero
  - name: webhook-validation
  ClusterRole:
  - name: backplane-cee-readers-cluster
  - name: backplane-impersonate-cluster-admin
  - name: backplane-readers-cluster
  - name: backplane-srep-admins-cluster
  - name: backplane-srep-admins-project
  - name: bz1980755
  - name: dedicated-admins-aggregate-cluster
  - name: dedicated-admins-aggregate-project
  - name: dedicated-admins-cluster
  - name: dedicated-admins-manage-operators
  - name: dedicated-admins-project
  - name: dedicated-admins-registry-cas-cluster
  - name: dedicated-readers
  - name: image-scanner
  - name: logger-clusterrole
  - name: openshift-backplane-managed-scripts-reader
  - name: openshift-splunk-forwarder-operator
  - name: osd-cluster-ready
  - name: osd-custom-domains-dedicated-admin-cluster
  - name: osd-delete-backplane-script-resources
  - name: osd-delete-backplane-serviceaccounts
  - name: osd-delete-ownerrefs-serviceaccounts
  - name: osd-get-namespace
  - name: osd-netnamespaces-dedicated-admin-cluster
  - name: osd-patch-subscription-source
  - name: osd-readers-aggregate
  - name: osd-rebalance-infra-nodes
  - name: osd-rebalance-infra-nodes-openshift-pod-rebalance
  - name: pcap-dedicated-admins
  - name: splunk-forwarder-operator
  - name: sre-allow-read-machine-info
  - name: sre-pruner-buildsdeploys-cr
  - name: webhook-validation-cr
  RoleBinding:
  - namespace: kube-system
    name: cloud-ingress-operator-cluster-config-v1-reader
  - namespace: kube-system
    name: managed-velero-operator-cluster-config-v1-reader
  - namespace: openshift-aqua
    name: dedicated-admins-openshift-aqua
  - namespace: openshift-backplane-managed-scripts
    name: backplane-cee-mustgather
  - namespace: openshift-backplane-managed-scripts
    name: backplane-srep-mustgather
  - namespace: openshift-backplane-managed-scripts
    name: osd-delete-backplane-script-resources
  - namespace: openshift-cloud-ingress-operator
    name: osd-rebalance-infra-nodes-openshift-pod-rebalance
  - namespace: openshift-codeready-workspaces
    name: dedicated-admins-openshift-codeready-workspaces
  - namespace: openshift-config
    name: dedicated-admins-project-request
  - namespace: openshift-config
    name: dedicated-admins-registry-cas-project
  - namespace: openshift-config
    name: muo-pullsecret-reader
  - namespace: openshift-config
    name: oao-openshiftconfig-reader
  - namespace: openshift-config
    name: osd-cluster-ready
  - namespace: openshift-custom-domains-operator
    name: osd-rebalance-infra-nodes-openshift-pod-rebalance
  - namespace: openshift-customer-monitoring
    name: dedicated-admins-openshift-customer-monitoring
  - namespace: openshift-customer-monitoring
    name: prometheus-k8s-openshift-customer-monitoring
  - namespace: openshift-dns
    name: dedicated-admins-openshift-dns
  - namespace: openshift-dns
    name: osd-rebalance-infra-nodes-openshift-dns
  - namespace: openshift-image-registry
    name: osd-rebalance-infra-nodes-openshift-pod-rebalance
  - namespace: openshift-ingress-operator
    name: cloud-ingress-operator
  - namespace: openshift-ingress
    name: cloud-ingress-operator
  - namespace: openshift-kube-apiserver
    name: cloud-ingress-operator
  - namespace: openshift-machine-api
    name: cloud-ingress-operator
  - namespace: openshift-logging
    name: admin-dedicated-admins
  - namespace: openshift-logging
    name: admin-system:serviceaccounts:dedicated-admin
  - namespace: openshift-logging
    name: openshift-logging-dedicated-admins
  - namespace: openshift-logging
    name: openshift-logging:serviceaccounts:dedicated-admin
  - namespace: openshift-machine-api
    name: osd-cluster-ready
  - namespace: openshift-machine-api
    name: sre-ebs-iops-reporter-read-machine-info
  - namespace: openshift-machine-api
    name: sre-stuck-ebs-vols-read-machine-info
  - namespace: openshift-managed-node-metadata-operator
    name: osd-rebalance-infra-nodes-openshift-pod-rebalance
  - namespace: openshift-machine-api
    name: osd-disable-cpms
  - namespace: openshift-marketplace
    name: dedicated-admins-openshift-marketplace
  - namespace: openshift-monitoring
    name: backplane-cee
  - namespace: openshift-monitoring
    name: muo-monitoring-reader
  - namespace: openshift-monitoring
    name: oao-monitoring-manager
  - namespace: openshift-monitoring
    name: osd-cluster-ready
  - namespace: openshift-monitoring
    name: osd-rebalance-infra-nodes-openshift-monitoring
  - namespace: openshift-monitoring
    name: osd-rebalance-infra-nodes-openshift-pod-rebalance
  - namespace: openshift-monitoring
    name: sre-dns-latency-exporter
  - namespace: openshift-monitoring
    name: sre-ebs-iops-reporter
  - namespace: openshift-monitoring
    name: sre-stuck-ebs-vols
  - namespace: openshift-must-gather-operator
    name: backplane-cee-mustgather
  - namespace: openshift-must-gather-operator
    name: backplane-srep-mustgather
  - namespace: openshift-must-gather-operator
    name: osd-rebalance-infra-nodes-openshift-pod-rebalance
  - namespace: openshift-network-diagnostics
    name: sre-pod-network-connectivity-check-pruner
  - namespace: openshift-network-operator
    name: osd-rebalance-infra-nodes-openshift-pod-rebalance
  - namespace: openshift-ocm-agent-operator
    name: osd-rebalance-infra-nodes-openshift-pod-rebalance
  - namespace: openshift-operators-redhat
    name: admin-dedicated-admins
  - namespace: openshift-operators-redhat
    name: admin-system:serviceaccounts:dedicated-admin
  - namespace: openshift-operators-redhat
    name: openshift-operators-redhat-dedicated-admins
  - namespace: openshift-operators-redhat
    name: openshift-operators-redhat:serviceaccounts:dedicated-admin
  - namespace: openshift-operators
    name: dedicated-admins-openshift-operators
  - namespace: openshift-osd-metrics
    name: osd-rebalance-infra-nodes-openshift-pod-rebalance
  - namespace: openshift-osd-metrics
    name: prometheus-k8s
  - namespace: openshift-rbac-permissions
    name: osd-rebalance-infra-nodes-openshift-pod-rebalance
  - namespace: openshift-rbac-permissions
    name: prometheus-k8s
  - namespace: openshift-route-monitor-operator
    name: osd-rebalance-infra-nodes-openshift-pod-rebalance
  - namespace: openshift-scanning
    name: scanner-rolebinding
  - namespace: openshift-security
    name: osd-rebalance-infra-nodes-openshift-security
  - namespace: openshift-security
    name: prometheus-k8s
  - namespace: openshift-splunk-forwarder-operator
    name: osd-rebalance-infra-nodes-openshift-pod-rebalance
  - namespace: openshift-suricata
    name: suricata-rolebinding
  - namespace: openshift-user-workload-monitoring
    name: dedicated-admins-uwm-config-create
  - namespace: openshift-user-workload-monitoring
    name: dedicated-admins-uwm-config-edit
  - namespace: openshift-user-workload-monitoring
    name: dedicated-admins-uwm-managed-am-secret
  - namespace: openshift-user-workload-monitoring
    name: osd-rebalance-infra-nodes-openshift-user-workload-monitoring
  - namespace: openshift-velero
    name: osd-rebalance-infra-nodes-openshift-pod-rebalance
  - namespace: openshift-velero
    name: prometheus-k8s
  Role:
  - namespace: kube-system
    name: cluster-config-v1-reader
  - namespace: kube-system
    name: cluster-config-v1-reader-cio
  - namespace: openshift-aqua
    name: dedicated-admins-openshift-aqua
  - namespace: openshift-backplane-managed-scripts
    name: backplane-cee-pcap-collector
  - namespace: openshift-backplane-managed-scripts
    name: backplane-srep-pcap-collector
  - namespace: openshift-backplane-managed-scripts
    name: osd-delete-backplane-script-resources
  - namespace: openshift-codeready-workspaces
    name: dedicated-admins-openshift-codeready-workspaces
  - namespace: openshift-config
    name: dedicated-admins-project-request
  - namespace: openshift-config
    name: dedicated-admins-registry-cas-project
  - namespace: openshift-config
    name: muo-pullsecret-reader
  - namespace: openshift-config
    name: oao-openshiftconfig-reader
  - namespace: openshift-config
    name: osd-cluster-ready
  - namespace: openshift-customer-monitoring
    name: dedicated-admins-openshift-customer-monitoring
  - namespace: openshift-customer-monitoring
    name: prometheus-k8s-openshift-customer-monitoring
  - namespace: openshift-dns
    name: dedicated-admins-openshift-dns
  - namespace: openshift-dns
    name: osd-rebalance-infra-nodes-openshift-dns
  - namespace: openshift-ingress-operator
    name: cloud-ingress-operator
  - namespace: openshift-ingress
    name: cloud-ingress-operator
  - namespace: openshift-kube-apiserver
    name: cloud-ingress-operator
  - namespace: openshift-machine-api
    name: cloud-ingress-operator
  - namespace: openshift-logging
    name: dedicated-admins-openshift-logging
  - namespace: openshift-machine-api
    name: osd-cluster-ready
  - namespace: openshift-machine-api
    name: osd-disable-cpms
  - namespace: openshift-marketplace
    name: dedicated-admins-openshift-marketplace
  - namespace: openshift-monitoring
    name: backplane-cee
  - namespace: openshift-monitoring
    name: muo-monitoring-reader
  - namespace: openshift-monitoring
    name: oao-monitoring-manager
  - namespace: openshift-monitoring
    name: osd-cluster-ready
  - namespace: openshift-monitoring
    name: osd-rebalance-infra-nodes-openshift-monitoring
  - namespace: openshift-must-gather-operator
    name: backplane-cee-mustgather
  - namespace: openshift-must-gather-operator
    name: backplane-srep-mustgather
  - namespace: openshift-network-diagnostics
    name: sre-pod-network-connectivity-check-pruner
  - namespace: openshift-operators
    name: dedicated-admins-openshift-operators
  - namespace: openshift-osd-metrics
    name: prometheus-k8s
  - namespace: openshift-rbac-permissions
    name: prometheus-k8s
  - namespace: openshift-scanning
    name: scanner-role
  - namespace: openshift-security
    name: osd-rebalance-infra-nodes-openshift-security
  - namespace: openshift-security
    name: prometheus-k8s
  - namespace: openshift-suricata
    name: suricata-role
  - namespace: openshift-user-workload-monitoring
    name: dedicated-admins-user-workload-monitoring-create-cm
  - namespace: openshift-user-workload-monitoring
    name: dedicated-admins-user-workload-monitoring-manage-am-secret
  - namespace: openshift-user-workload-monitoring
    name: osd-rebalance-infra-nodes-openshift-user-workload-monitoring
  - namespace: openshift-velero
    name: prometheus-k8s
  CronJob:
  - namespace: openshift-backplane-managed-scripts
    name: osd-delete-backplane-script-resources
  - namespace: openshift-backplane-srep
    name: osd-delete-ownerrefs-serviceaccounts
  - namespace: openshift-backplane
    name: osd-delete-backplane-serviceaccounts
  - namespace: openshift-machine-api
    name: osd-disable-cpms
  - namespace: openshift-marketplace
    name: osd-patch-subscription-source
  - namespace: openshift-monitoring
    name: osd-rebalance-infra-nodes
  - namespace: openshift-network-diagnostics
    name: sre-pod-network-connectivity-check-pruner
  - namespace: openshift-sre-pruning
    name: builds-pruner
  - namespace: openshift-sre-pruning
    name: bz1980755
  - namespace: openshift-sre-pruning
    name: deployments-pruner
  Job:
  - namespace: openshift-monitoring
    name: osd-cluster-ready
  CredentialsRequest:
  - namespace: openshift-cloud-ingress-operator
    name: cloud-ingress-operator-credentials-aws
  - namespace: openshift-cloud-ingress-operator
    name: cloud-ingress-operator-credentials-gcp
  - namespace: openshift-monitoring
    name: sre-ebs-iops-reporter-aws-credentials
  - namespace: openshift-monitoring
    name: sre-stuck-ebs-vols-aws-credentials
  - namespace: openshift-velero
    name: managed-velero-operator-iam-credentials-aws
  - namespace: openshift-velero
    name: managed-velero-operator-iam-credentials-gcp
  APIScheme:
  - namespace: openshift-cloud-ingress-operator
    name: rh-api
  PublishingStrategy:
  - namespace: openshift-cloud-ingress-operator
    name: publishingstrategy
  ScanSettingBinding:
  - namespace: openshift-compliance
    name: fedramp-high-ocp
  - namespace: openshift-compliance
    name: fedramp-high-rhcos
  ScanSetting:
  - namespace: openshift-compliance
    name: osd
  TailoredProfile:
  - namespace: openshift-compliance
    name: rhcos4-high-rosa
  OAuth:
  - name: cluster
  EndpointSlice:
  - namespace: openshift-deployment-validation-operator
    name: deployment-validation-operator-metrics-rhtwg
  - namespace: openshift-monitoring
    name: sre-dns-latency-exporter-4cw9r
  - namespace: openshift-monitoring
    name: sre-ebs-iops-reporter-6tx5g
  - namespace: openshift-monitoring
    name: sre-stuck-ebs-vols-gmdhs
  - namespace: openshift-scanning
    name: loggerservice-zprbq
  - namespace: openshift-security
    name: audit-exporter-nqfdk
  - namespace: openshift-validation-webhook
    name: validation-webhook-97b8t
  FileIntegrity:
  - namespace: openshift-file-integrity
    name: osd-fileintegrity
  MachineHealthCheck:
  - namespace: openshift-machine-api
    name: srep-infra-healthcheck
  - namespace: openshift-machine-api
    name: srep-metal-worker-healthcheck
  - namespace: openshift-machine-api
    name: srep-worker-healthcheck
  MachineSet:
  - namespace: openshift-machine-api
    name: sbasabat-mc-qhqkn-infra-us-east-1a
  - namespace: openshift-machine-api
    name: sbasabat-mc-qhqkn-worker-us-east-1a
  ContainerRuntimeConfig:
  - name: custom-crio
  KubeletConfig:
  - name: custom-kubelet
  MachineConfig:
  - name: 00-master-chrony
  - name: 00-worker-chrony
  SubjectPermission:
  - namespace: openshift-rbac-permissions
    name: backplane-cee
  - namespace: openshift-rbac-permissions
    name: backplane-csa
  - namespace: openshift-rbac-permissions
    name: backplane-cse
  - namespace: openshift-rbac-permissions
    name: backplane-csm
  - namespace: openshift-rbac-permissions
    name: backplane-mobb
  - namespace: openshift-rbac-permissions
    name: backplane-srep
  - namespace: openshift-rbac-permissions
    name: backplane-tam
  - namespace: openshift-rbac-permissions
    name: dedicated-admin-serviceaccounts
  - namespace: openshift-rbac-permissions
    name: dedicated-admin-serviceaccounts-core-ns
  - namespace: openshift-rbac-permissions
    name: dedicated-admins
  - namespace: openshift-rbac-permissions
    name: dedicated-admins-alert-routing-edit
  - namespace: openshift-rbac-permissions
    name: dedicated-admins-core-ns
  - namespace: openshift-rbac-permissions
    name: dedicated-admins-customer-monitoring
  - namespace: openshift-rbac-permissions
    name: osd-delete-backplane-serviceaccounts
  VeleroInstall:
  - namespace: openshift-velero
    name: cluster
  PrometheusRule:
  - namespace: openshift-monitoring
    name: rhmi-sre-cluster-admins
  - namespace: openshift-monitoring
    name: rhoam-sre-cluster-admins
  - namespace: openshift-monitoring
    name: sre-alertmanager-silences-active
  - namespace: openshift-monitoring
    name: sre-alerts-stuck-builds
  - namespace: openshift-monitoring
    name: sre-alerts-stuck-volumes
  - namespace: openshift-monitoring
    name: sre-cloud-ingress-operator-offline-alerts
  - namespace: openshift-monitoring
    name: sre-avo-pendingacceptance
  - namespace: openshift-monitoring
    name: sre-configure-alertmanager-operator-offline-alerts
  - namespace: openshift-monitoring
    name: sre-control-plane-resizing-alerts
  - namespace: openshift-monitoring
    name: sre-dns-alerts
  - namespace: openshift-monitoring
    name: sre-ebs-iops-burstbalance
  - namespace: openshift-monitoring
    name: sre-elasticsearch-jobs
  - namespace: openshift-monitoring
    name: sre-elasticsearch-managed-notification-alerts
  - namespace: openshift-monitoring
    name: sre-excessive-memory
  - namespace: openshift-monitoring
    name: sre-fr-alerts-low-disk-space
  - namespace: openshift-monitoring
    name: sre-haproxy-reload-fail
  - namespace: openshift-monitoring
    name: sre-internal-slo-recording-rules
  - namespace: openshift-monitoring
    name: sre-kubequotaexceeded
  - namespace: openshift-monitoring
    name: sre-leader-election-master-status-alerts
  - namespace: openshift-monitoring
    name: sre-managed-kube-apiserver-missing-on-node
  - namespace: openshift-monitoring
    name: sre-managed-kube-controller-manager-missing-on-node
  - namespace: openshift-monitoring
    name: sre-managed-kube-scheduler-missing-on-node
  - namespace: openshift-monitoring
    name: sre-managed-node-metadata-operator-alerts
  - namespace: openshift-monitoring
    name: sre-managed-notification-alerts
  - namespace: openshift-monitoring
    name: sre-managed-upgrade-operator-alerts
  - namespace: openshift-monitoring
    name: sre-managed-velero-operator-alerts
  - namespace: openshift-monitoring
    name: sre-node-unschedulable
  - namespace: openshift-monitoring
    name: sre-oauth-server
  - namespace: openshift-monitoring
    name: sre-pending-csr-alert
  - namespace: openshift-monitoring
    name: sre-proxy-managed-notification-alerts
  - namespace: openshift-monitoring
    name: sre-pruning
  - namespace: openshift-monitoring
    name: sre-pv
  - namespace: openshift-monitoring
    name: sre-router-health
  - namespace: openshift-monitoring
    name: sre-runaway-sdn-preventing-container-creation
  - namespace: openshift-monitoring
    name: sre-slo-recording-rules
  - namespace: openshift-monitoring
    name: sre-telemeter-client
  - namespace: openshift-monitoring
    name: sre-telemetry-managed-labels-recording-rules
  - namespace: openshift-monitoring
    name: sre-upgrade-send-managed-notification-alerts
  - namespace: openshift-monitoring
    name: sre-uptime-sla
  ServiceMonitor:
  - namespace: openshift-monitoring
    name: sre-dns-latency-exporter
  - namespace: openshift-monitoring
    name: sre-ebs-iops-reporter
  - namespace: openshift-monitoring
    name: sre-stuck-ebs-vols
  ClusterUrlMonitor:
  - namespace: openshift-route-monitor-operator
    name: api
  RouteMonitor:
  - namespace: openshift-route-monitor-operator
    name: console
  NetworkPolicy:
  - namespace: openshift-deployment-validation-operator
    name: allow-from-openshift-insights
  - namespace: openshift-deployment-validation-operator
    name: allow-from-openshift-olm
  ManagedNotification:
  - namespace: openshift-ocm-agent-operator
    name: sre-elasticsearch-managed-notifications
  - namespace: openshift-ocm-agent-operator
    name: sre-managed-notifications
  - namespace: openshift-ocm-agent-operator
    name: sre-proxy-managed-notifications
  - namespace: openshift-ocm-agent-operator
    name: sre-upgrade-managed-notifications
  OcmAgent:
  - namespace: openshift-ocm-agent-operator
    name: ocmagent
  - namespace: openshift-security
    name: audit-exporter
  Console:
  - name: cluster
  CatalogSource:
  - namespace: openshift-addon-operator
    name: addon-operator-catalog
  - namespace: openshift-cloud-ingress-operator
    name: cloud-ingress-operator-registry
  - namespace: openshift-compliance
    name: compliance-operator-registry
  - namespace: openshift-container-security
    name: container-security-operator-registry
  - namespace: openshift-custom-domains-operator
    name: custom-domains-operator-registry
  - namespace: openshift-deployment-validation-operator
    name: deployment-validation-operator-catalog
  - namespace: openshift-managed-node-metadata-operator
    name: managed-node-metadata-operator-registry
  - namespace: openshift-file-integrity
    name: file-integrity-operator-registry
  - namespace: openshift-managed-upgrade-operator
    name: managed-upgrade-operator-catalog
  - namespace: openshift-monitoring
    name: configure-alertmanager-operator-registry
  - namespace: openshift-must-gather-operator
    name: must-gather-operator-registry
  - namespace: openshift-observability-operator
    name: observability-operator-catalog
  - namespace: openshift-ocm-agent-operator
    name: ocm-agent-operator-registry
  - namespace: openshift-osd-metrics
    name: osd-metrics-exporter-registry
  - namespace: openshift-rbac-permissions
    name: rbac-permissions-operator-registry
  - namespace: openshift-route-monitor-operator
    name: route-monitor-operator-registry
  - namespace: openshift-splunk-forwarder-operator
    name: splunk-forwarder-operator-catalog
  - namespace: openshift-velero
    name: managed-velero-operator-registry
  OperatorGroup:
  - namespace: openshift-addon-operator
    name: addon-operator-og
  - namespace: openshift-aqua
    name: openshift-aqua
  - namespace: openshift-cloud-ingress-operator
    name: cloud-ingress-operator
  - namespace: openshift-codeready-workspaces
    name: openshift-codeready-workspaces
  - namespace: openshift-compliance
    name: compliance-operator
  - namespace: openshift-container-security
    name: container-security-operator
  - namespace: openshift-custom-domains-operator
    name: custom-domains-operator
  - namespace: openshift-customer-monitoring
    name: openshift-customer-monitoring
  - namespace: openshift-deployment-validation-operator
    name: deployment-validation-operator-og
  - namespace: openshift-managed-node-metadata-operator
    name: managed-node-metadata-operator
  - namespace: openshift-file-integrity
    name: file-integrity-operator
  - namespace: openshift-logging
    name: openshift-logging
  - namespace: openshift-managed-upgrade-operator
    name: managed-upgrade-operator-og
  - namespace: openshift-must-gather-operator
    name: must-gather-operator
  - namespace: openshift-observability-operator
    name: observability-operator-og
  - namespace: openshift-ocm-agent-operator
    name: ocm-agent-operator-og
  - namespace: openshift-osd-metrics
    name: osd-metrics-exporter
  - namespace: openshift-rbac-permissions
    name: rbac-permissions-operator
  - namespace: openshift-route-monitor-operator
    name: route-monitor-operator
  - namespace: openshift-splunk-forwarder-operator
    name: splunk-forwarder-operator-og
  - namespace: openshift-velero
    name: managed-velero-operator
  Subscription:
  - namespace: openshift-addon-operator
    name: addon-operator
  - namespace: openshift-cloud-ingress-operator
    name: cloud-ingress-operator
  - namespace: openshift-compliance
    name: compliance-operator-sub
  - namespace: openshift-container-security
    name: container-security-operator-sub
  - namespace: openshift-custom-domains-operator
    name: custom-domains-operator
  - namespace: openshift-deployment-validation-operator
    name: deployment-validation-operator
  - namespace: openshift-managed-node-metadata-operator
    name: managed-node-metadata-operator
  - namespace: openshift-file-integrity
    name: file-integrity-operator-sub
  - namespace: openshift-managed-upgrade-operator
    name: managed-upgrade-operator
  - namespace: openshift-monitoring
    name: configure-alertmanager-operator
  - namespace: openshift-must-gather-operator
    name: must-gather-operator
  - namespace: openshift-observability-operator
    name: observability-operator
  - namespace: openshift-ocm-agent-operator
    name: ocm-agent-operator
  - namespace: openshift-osd-metrics
    name: osd-metrics-exporter
  - namespace: openshift-rbac-permissions
    name: rbac-permissions-operator
  - namespace: openshift-route-monitor-operator
    name: route-monitor-operator
  - namespace: openshift-splunk-forwarder-operator
    name: openshift-splunk-forwarder-operator
  - namespace: openshift-velero
    name: managed-velero-operator
  PackageManifest:
  - namespace: openshift-splunk-forwarder-operator
    name: splunk-forwarder-operator
  - namespace: openshift-addon-operator
    name: addon-operator
  - namespace: openshift-rbac-permissions
    name: rbac-permissions-operator
  - namespace: openshift-cloud-ingress-operator
    name: cloud-ingress-operator
  - namespace: openshift-managed-node-metadata-operator
    name: managed-node-metadata-operator
  - namespace: openshift-velero
    name: managed-velero-operator
  - namespace: openshift-deployment-validation-operator
    name: managed-upgrade-operator
  - namespace: openshift-managed-upgrade-operator
    name: managed-upgrade-operator
  - namespace: openshift-container-security
    name: container-security-operator
  - namespace: openshift-route-monitor-operator
    name: route-monitor-operator
  - namespace: openshift-file-integrity
    name: file-integrity-operator
  - namespace: openshift-custom-domains-operator
    name: managed-node-metadata-operator
  - namespace: openshift-route-monitor-operator
    name: custom-domains-operator
  - namespace: openshift-managed-upgrade-operator
    name: managed-upgrade-operator
  - namespace: openshift-ocm-agent-operator
    name: ocm-agent-operator
  - namespace: openshift-observability-operator
    name: observability-operator
  - namespace: openshift-monitoring
    name: configure-alertmanager-operator
  - namespace: openshift-must-gather-operator
    name: deployment-validation-operator
  - namespace: openshift-osd-metrics
    name: osd-metrics-exporter
  - namespace: openshift-compliance
    name: compliance-operator
  - namespace: openshift-rbac-permissions
    name: rbac-permissions-operator
  Status:
  - {}
  Project:
  - name: dedicated-admin
  - name: openshift-addon-operator
  - name: openshift-aqua
  - name: openshift-backplane
  - name: openshift-backplane-cee
  - name: openshift-backplane-csa
  - name: openshift-backplane-cse
  - name: openshift-backplane-csm
  - name: openshift-backplane-managed-scripts
  - name: openshift-backplane-mobb
  - name: openshift-backplane-srep
  - name: openshift-backplane-tam
  - name: openshift-cloud-ingress-operator
  - name: openshift-codeready-workspaces
  - name: openshift-compliance
  - name: openshift-container-security
  - name: openshift-custom-domains-operator
  - name: openshift-customer-monitoring
  - name: openshift-deployment-validation-operator
  - name: openshift-managed-node-metadata-operator
  - name: openshift-file-integrity
  - name: openshift-logging
  - name: openshift-managed-upgrade-operator
  - name: openshift-must-gather-operator
  - name: openshift-observability-operator
  - name: openshift-ocm-agent-operator
  - name: openshift-operators-redhat
  - name: openshift-osd-metrics
  - name: openshift-rbac-permissions
  - name: openshift-route-monitor-operator
  - name: openshift-scanning
  - name: openshift-security
  - name: openshift-splunk-forwarder-operator
  - name: openshift-sre-pruning
  - name: openshift-suricata
  - name: openshift-validation-webhook
  - name: openshift-velero
  ClusterResourceQuota:
  - name: loadbalancer-quota
  - name: persistent-volume-quota
  SecurityContextConstraints:
  - name: osd-scanning-scc
  - name: osd-suricata-scc
  - name: pcap-dedicated-admins
  - name: splunkforwarder
  SplunkForwarder:
  - namespace: openshift-security
    name: splunkforwarder
  Group:
  - name: cluster-admins
  - name: dedicated-admins
  User:
  - name: backplane-cluster-admin
  Backup:
  - namespace: openshift-velero
    name: daily-full-backup-20221123112305
  - namespace: openshift-velero
    name: daily-full-backup-20221125042537
  - namespace: openshift-velero
    name: daily-full-backup-20221126010038
  - namespace: openshift-velero
    name: daily-full-backup-20221127010039
  - namespace: openshift-velero
    name: daily-full-backup-20221128010040
  - namespace: openshift-velero
    name: daily-full-backup-20221129050847
  - namespace: openshift-velero
    name: hourly-object-backup-20221128051740
  - namespace: openshift-velero
    name: hourly-object-backup-20221128061740
  - namespace: openshift-velero
    name: hourly-object-backup-20221128071740
  - namespace: openshift-velero
    name: hourly-object-backup-20221128081740
  - namespace: openshift-velero
    name: hourly-object-backup-20221128091740
  - namespace: openshift-velero
    name: hourly-object-backup-20221129050852
  - namespace: openshift-velero
    name: hourly-object-backup-20221129051747
  - namespace: openshift-velero
    name: weekly-full-backup-20221116184315
  - namespace: openshift-velero
    name: weekly-full-backup-20221121033854
  - namespace: openshift-velero
    name: weekly-full-backup-20221128020040
  Schedule:
  - namespace: openshift-velero
    name: daily-full-backup
  - namespace: openshift-velero
    name: hourly-object-backup
  - namespace: openshift-velero
    name: weekly-full-backup
7.9.3. OpenShift Dedicated 核心命名空间
OpenShift Dedicated 核心命名空间会在集群安装过程中安装。
例 7.2. 核心命名空间列表
apiVersion: v1
kind: ConfigMap
metadata:
  name: ocp-namespaces
  namespace: openshift-monitoring
data:
  managed_namespaces.yaml: |
    Resources:
      Namespace:
      - name: kube-system
      - name: openshift-apiserver
      - name: openshift-apiserver-operator
      - name: openshift-authentication
      - name: openshift-authentication-operator
      - name: openshift-cloud-controller-manager
      - name: openshift-cloud-controller-manager-operator
      - name: openshift-cloud-credential-operator
      - name: openshift-cloud-network-config-controller
      - name: openshift-cluster-api
      - name: openshift-cluster-csi-drivers
      - name: openshift-cluster-machine-approver
      - name: openshift-cluster-node-tuning-operator
      - name: openshift-cluster-samples-operator
      - name: openshift-cluster-storage-operator
      - name: openshift-config
      - name: openshift-config-managed
      - name: openshift-config-operator
      - name: openshift-console
      - name: openshift-console-operator
      - name: openshift-console-user-settings
      - name: openshift-controller-manager
      - name: openshift-controller-manager-operator
      - name: openshift-dns
      - name: openshift-dns-operator
      - name: openshift-etcd
      - name: openshift-etcd-operator
      - name: openshift-host-network
      - name: openshift-image-registry
      - name: openshift-ingress
      - name: openshift-ingress-canary
      - name: openshift-ingress-operator
      - name: openshift-insights
      - name: openshift-kni-infra
      - name: openshift-kube-apiserver
      - name: openshift-kube-apiserver-operator
      - name: openshift-kube-controller-manager
      - name: openshift-kube-controller-manager-operator
      - name: openshift-kube-scheduler
      - name: openshift-kube-scheduler-operator
      - name: openshift-kube-storage-version-migrator
      - name: openshift-kube-storage-version-migrator-operator
      - name: openshift-machine-api
      - name: openshift-machine-config-operator
      - name: openshift-marketplace
      - name: openshift-monitoring
      - name: openshift-multus
      - name: openshift-network-diagnostics
      - name: openshift-network-operator
      - name: openshift-nutanix-infra
      - name: openshift-oauth-apiserver
      - name: openshift-openstack-infra
      - name: openshift-operator-lifecycle-manager
      - name: openshift-operators
      - name: openshift-ovirt-infra
      - name: openshift-sdn
      - name: openshift-ovn-kubernetes
      - name: openshift-platform-operators
      - name: openshift-route-controller-manager
      - name: openshift-service-ca
      - name: openshift-service-ca-operator
      - name: openshift-user-workload-monitoring
      - name: openshift-vsphere-infra
7.9.4. OpenShift Dedicated 附加组件命名空间
OpenShift Dedicated 附加组件是集群安装后可以安装的服务。这些额外服务包括 AWS CloudWatch、Red Hat OpenShift Dev Spaces、Red Hat OpenShift API Management 和 Cluster Logging Operator。以下命名空间中的资源的任何更改可能会在升级过程中被附加组件覆盖,这可能会导致附加组件功能不支持的配置。
例 7.3. 附加组件受管命名空间列表
addon-namespaces:
  ocs-converged-dev: openshift-storage
  managed-api-service-internal: redhat-rhoami-operator
  codeready-workspaces-operator: codeready-workspaces-operator
  managed-odh: redhat-ods-operator
  codeready-workspaces-operator-qe: codeready-workspaces-operator-qe
  integreatly-operator: redhat-rhmi-operator
  nvidia-gpu-addon: redhat-nvidia-gpu-addon
  integreatly-operator-internal: redhat-rhmi-operator
  rhoams: redhat-rhoam-operator
  ocs-converged: openshift-storage
  addon-operator: redhat-addon-operator
  prow-operator: prow
  cluster-logging-operator: openshift-logging
  advanced-cluster-management: redhat-open-cluster-management
  cert-manager-operator: redhat-cert-manager-operator
  dba-operator: addon-dba-operator
  reference-addon: redhat-reference-addon
  ocm-addon-test-operator: redhat-ocm-addon-test-operator
7.9.5. OpenShift Dedicated 验证 Webhook
OpenShift Dedicated 验证 Webhook 是由 OpenShift SRE 团队维护的一组动态准入控制。对于各种类型的请求,这些 HTTP 回调也称为 Webhook,以确保集群稳定性。Webhook 评估每个请求,并接受或拒绝它们。以下列表描述了各种带有控制注册的操作和资源的规则的 Webhook。任何尝试绕过这些验证 Webhook 都可能会影响集群的稳定性和可支持性。
例 7.4. 验证 Webhook 列表
[
  {
    "webhookName": "clusterlogging-validation",
    "rules": [
      {
        "operations": [
          "CREATE",
          "UPDATE"
        ],
        "apiGroups": [
          "logging.openshift.io"
        ],
        "apiVersions": [
          "v1"
        ],
        "resources": [
          "clusterloggings"
        ],
        "scope": "Namespaced"
      }
    ],
    "documentString": "Managed OpenShift Customers may set log retention outside the allowed range of 0-7 days"
  },
  {
    "webhookName": "clusterrolebindings-validation",
    "rules": [
      {
        "operations": [
          "DELETE"
        ],
        "apiGroups": [
          "rbac.authorization.k8s.io"
        ],
        "apiVersions": [
          "v1"
        ],
        "resources": [
          "clusterrolebindings"
        ],
        "scope": "Cluster"
      }
    ],
    "documentString": "Managed OpenShift Customers may not delete the cluster role bindings under the managed namespaces: (^openshift-.*|kube-system)"
  },
  {
    "webhookName": "clusterroles-validation",
    "rules": [
      {
        "operations": [
          "DELETE"
        ],
        "apiGroups": [
          "rbac.authorization.k8s.io"
        ],
        "apiVersions": [
          "v1"
        ],
        "resources": [
          "clusterroles"
        ],
        "scope": "Cluster"
      }
    ],
    "documentString": "Managed OpenShift Customers may not delete protected ClusterRoles including cluster-admin, view, edit, admin, specific system roles (system:admin, system:node, system:node-proxier, system:kube-scheduler, system:kube-controller-manager), and backplane-* roles"
  },
  {
    "webhookName": "customresourcedefinitions-validation",
    "rules": [
      {
        "operations": [
          "CREATE",
          "UPDATE",
          "DELETE"
        ],
        "apiGroups": [
          "apiextensions.k8s.io"
        ],
        "apiVersions": [
          "*"
        ],
        "resources": [
          "customresourcedefinitions"
        ],
        "scope": "Cluster"
      }
    ],
    "documentString": "Managed OpenShift Customers may not change CustomResourceDefinitions managed by Red Hat."
  },
  {
    "webhookName": "hiveownership-validation",
    "rules": [
      {
        "operations": [
          "UPDATE",
          "DELETE"
        ],
        "apiGroups": [
          "quota.openshift.io"
        ],
        "apiVersions": [
          "*"
        ],
        "resources": [
          "clusterresourcequotas"
        ],
        "scope": "Cluster"
      }
    ],
    "webhookObjectSelector": {
      "matchLabels": {
        "hive.openshift.io/managed": "true"
      }
    },
    "documentString": "Managed OpenShift customers may not edit certain managed resources. A managed resource has a \"hive.openshift.io/managed\": \"true\" label."
  },
  {
    "webhookName": "imagecontentpolicies-validation",
    "rules": [
      {
        "operations": [
          "CREATE",
          "UPDATE"
        ],
        "apiGroups": [
          "config.openshift.io"
        ],
        "apiVersions": [
          "*"
        ],
        "resources": [
          "imagedigestmirrorsets",
          "imagetagmirrorsets"
        ],
        "scope": "Cluster"
      },
      {
        "operations": [
          "CREATE",
          "UPDATE"
        ],
        "apiGroups": [
          "operator.openshift.io"
        ],
        "apiVersions": [
          "*"
        ],
        "resources": [
          "imagecontentsourcepolicies"
        ],
        "scope": "Cluster"
      }
    ],
    "documentString": "Managed OpenShift customers may not create ImageContentSourcePolicy, ImageDigestMirrorSet, or ImageTagMirrorSet resources that configure mirrors that would conflict with system registries (e.g. quay.io, registry.redhat.io, registry.access.redhat.com, etc). For more details, see https://docs.openshift.com/"
  },
  {
    "webhookName": "ingress-config-validation",
    "rules": [
      {
        "operations": [
          "CREATE",
          "UPDATE",
          "DELETE"
        ],
        "apiGroups": [
          "config.openshift.io"
        ],
        "apiVersions": [
          "*"
        ],
        "resources": [
          "ingresses"
        ],
        "scope": "Cluster"
      }
    ],
    "documentString": "Managed OpenShift customers may not modify ingress config resources because it can can degrade cluster operators and can interfere with OpenShift SRE monitoring."
  },
  {
    "webhookName": "ingresscontroller-validation",
    "rules": [
      {
        "operations": [
          "CREATE",
          "UPDATE"
        ],
        "apiGroups": [
          "operator.openshift.io"
        ],
        "apiVersions": [
          "*"
        ],
        "resources": [
          "ingresscontroller",
          "ingresscontrollers"
        ],
        "scope": "Namespaced"
      }
    ],
    "documentString": "Managed OpenShift Customer may create IngressControllers without necessary taints. This can cause those workloads to be provisioned on master nodes."
  },
  {
    "webhookName": "namespace-validation",
    "rules": [
      {
        "operations": [
          "CREATE",
          "UPDATE",
          "DELETE"
        ],
        "apiGroups": [
          ""
        ],
        "apiVersions": [
          "*"
        ],
        "resources": [
          "namespaces"
        ],
        "scope": "Cluster"
      }
    ],
    "documentString": "Managed OpenShift Customers may not modify namespaces specified in the [openshift-monitoring/managed-namespaces openshift-monitoring/ocp-namespaces] ConfigMaps because customer workloads should be placed in customer-created namespaces. Customers may not create namespaces identified by this regular expression (^com$|^io$|^in$) because it could interfere with critical DNS resolution. Additionally, customers may not set or change the values of these Namespace labels [managed.openshift.io/storage-pv-quota-exempt managed.openshift.io/service-lb-quota-exempt]."
  },
  {
    "webhookName": "networkpolicies-validation",
    "rules": [
      {
        "operations": [
          "CREATE",
          "UPDATE",
          "DELETE"
        ],
        "apiGroups": [
          "networking.k8s.io"
        ],
        "apiVersions": [
          "*"
        ],
        "resources": [
          "networkpolicies"
        ],
        "scope": "Namespaced"
      }
    ],
    "documentString": "Managed OpenShift Customers may not create NetworkPolicies in namespaces managed by Red Hat."
  },
  {
    "webhookName": "node-validation-osd",
    "rules": [
      {
        "operations": [
          "CREATE",
          "UPDATE",
          "DELETE"
        ],
        "apiGroups": [
          ""
        ],
        "apiVersions": [
          "*"
        ],
        "resources": [
          "nodes",
          "nodes/*"
        ],
        "scope": "*"
      }
    ],
    "documentString": "Managed OpenShift customers may not alter Node objects."
  },
  {
    "webhookName": "pod-validation",
    "rules": [
      {
        "operations": [
          "*"
        ],
        "apiGroups": [
          "v1"
        ],
        "apiVersions": [
          "*"
        ],
        "resources": [
          "pods"
        ],
        "scope": "Namespaced"
      }
    ],
    "documentString": "Managed OpenShift Customers may use tolerations on Pods that could cause those Pods to be scheduled on infra or master nodes."
  },
  {
    "webhookName": "podimagespec-mutation",
    "rules": [
      {
        "operations": [
          "CREATE"
        ],
        "apiGroups": [
          ""
        ],
        "apiVersions": [
          "v1"
        ],
        "resources": [
          "pods"
        ],
        "scope": "Namespaced"
      }
    ],
    "documentString": "OpenShift debugging tools on Managed OpenShift clusters must be available even if internal image registry is removed."
  },
  {
    "webhookName": "prometheusrule-validation",
    "rules": [
      {
        "operations": [
          "CREATE",
          "UPDATE",
          "DELETE"
        ],
        "apiGroups": [
          "monitoring.coreos.com"
        ],
        "apiVersions": [
          "*"
        ],
        "resources": [
          "prometheusrules"
        ],
        "scope": "Namespaced"
      }
    ],
    "documentString": "Managed OpenShift Customers may not create PrometheusRule in namespaces managed by Red Hat."
  },
  {
    "webhookName": "regular-user-validation",
    "rules": [
      {
        "operations": [
          "*"
        ],
        "apiGroups": [
          "cloudcredential.openshift.io",
          "machine.openshift.io",
          "admissionregistration.k8s.io",
          "addons.managed.openshift.io",
          "cloudingress.managed.openshift.io",
          "managed.openshift.io",
          "ocmagent.managed.openshift.io",
          "splunkforwarder.managed.openshift.io",
          "upgrade.managed.openshift.io"
        ],
        "apiVersions": [
          "*"
        ],
        "resources": [
          "*/*"
        ],
        "scope": "*"
      },
      {
        "operations": [
          "*"
        ],
        "apiGroups": [
          "autoscaling.openshift.io"
        ],
        "apiVersions": [
          "*"
        ],
        "resources": [
          "clusterautoscalers",
          "machineautoscalers"
        ],
        "scope": "*"
      },
      {
        "operations": [
          "*"
        ],
        "apiGroups": [
          "config.openshift.io"
        ],
        "apiVersions": [
          "*"
        ],
        "resources": [
          "clusterversions",
          "clusterversions/status",
          "schedulers",
          "apiservers",
          "proxies"
        ],
        "scope": "*"
      },
      {
        "operations": [
          "CREATE",
          "UPDATE",
          "DELETE"
        ],
        "apiGroups": [
          ""
        ],
        "apiVersions": [
          "*"
        ],
        "resources": [
          "configmaps"
        ],
        "scope": "*"
      },
      {
        "operations": [
          "*"
        ],
        "apiGroups": [
          "machineconfiguration.openshift.io"
        ],
        "apiVersions": [
          "*"
        ],
        "resources": [
          "machineconfigs",
          "machineconfigpools"
        ],
        "scope": "*"
      },
      {
        "operations": [
          "*"
        ],
        "apiGroups": [
          "operator.openshift.io"
        ],
        "apiVersions": [
          "*"
        ],
        "resources": [
          "kubeapiservers",
          "openshiftapiservers"
        ],
        "scope": "*"
      },
      {
        "operations": [
          "*"
        ],
        "apiGroups": [
          "managed.openshift.io"
        ],
        "apiVersions": [
          "*"
        ],
        "resources": [
          "subjectpermissions",
          "subjectpermissions/*"
        ],
        "scope": "*"
      },
      {
        "operations": [
          "*"
        ],
        "apiGroups": [
          "network.openshift.io"
        ],
        "apiVersions": [
          "*"
        ],
        "resources": [
          "netnamespaces",
          "netnamespaces/*"
        ],
        "scope": "*"
      }
    ],
    "documentString": "Managed OpenShift customers may not manage any objects in the following APIGroups [splunkforwarder.managed.openshift.io autoscaling.openshift.io ocmagent.managed.openshift.io upgrade.managed.openshift.io config.openshift.io machineconfiguration.openshift.io operator.openshift.io network.openshift.io cloudcredential.openshift.io machine.openshift.io admissionregistration.k8s.io addons.managed.openshift.io cloudingress.managed.openshift.io managed.openshift.io], nor may Managed OpenShift customers alter the APIServer, KubeAPIServer, OpenShiftAPIServer, ClusterVersion, Proxy or SubjectPermission objects."
  },
  {
    "webhookName": "scc-validation",
    "rules": [
      {
        "operations": [
          "UPDATE",
          "DELETE"
        ],
        "apiGroups": [
          "security.openshift.io"
        ],
        "apiVersions": [
          "*"
        ],
        "resources": [
          "securitycontextconstraints"
        ],
        "scope": "Cluster"
      }
    ],
    "documentString": "Managed OpenShift Customers may not modify the following default SCCs: [anyuid hostaccess hostmount-anyuid hostnetwork hostnetwork-v2 node-exporter nonroot nonroot-v2 privileged restricted restricted-v2]"
  },
  {
    "webhookName": "sdn-migration-validation",
    "rules": [
      {
        "operations": [
          "UPDATE"
        ],
        "apiGroups": [
          "config.openshift.io"
        ],
        "apiVersions": [
          "*"
        ],
        "resources": [
          "networks"
        ],
        "scope": "Cluster"
      }
    ],
    "documentString": "Managed OpenShift customers may not modify the network config type because it can can degrade cluster operators and can interfere with OpenShift SRE monitoring."
  },
  {
    "webhookName": "service-mutation",
    "rules": [
      {
        "operations": [
          "CREATE",
          "UPDATE"
        ],
        "apiGroups": [
          ""
        ],
        "apiVersions": [
          "v1"
        ],
        "resources": [
          "services"
        ],
        "scope": "Namespaced"
      }
    ],
    "documentString": "LoadBalancer-type services on Managed OpenShift clusters must contain an additional annotation for managed policy compliance."
  },
  {
    "webhookName": "serviceaccount-validation",
    "rules": [
      {
        "operations": [
          "DELETE"
        ],
        "apiGroups": [
          ""
        ],
        "apiVersions": [
          "v1"
        ],
        "resources": [
          "serviceaccounts"
        ],
        "scope": "Namespaced"
      }
    ],
    "documentString": "Managed OpenShift Customers may not delete the service accounts under the managed namespaces。"
  },
  {
    "webhookName": "techpreviewnoupgrade-validation",
    "rules": [
      {
        "operations": [
          "CREATE",
          "UPDATE"
        ],
        "apiGroups": [
          "config.openshift.io"
        ],
        "apiVersions": [
          "*"
        ],
        "resources": [
          "featuregates"
        ],
        "scope": "Cluster"
      }
    ],
    "documentString": "Managed OpenShift Customers may not use TechPreviewNoUpgrade FeatureGate that could prevent any future ability to do a y-stream upgrade to their clusters."
  }
]
Legal Notice
Copyright © Red Hat
OpenShift documentation is licensed under the Apache License 2.0 (https://www.apache.org/licenses/LICENSE-2.0).
Modified versions must remove all Red Hat trademarks.
Portions adapted from https://github.com/kubernetes-incubator/service-catalog/ with modifications by Red Hat.
Red Hat, Red Hat Enterprise Linux, the Red Hat logo, the Shadowman logo, JBoss, OpenShift, Fedora, the Infinity logo, and RHCE are trademarks of Red Hat, Inc., registered in the United States and other countries.
Linux® is the registered trademark of Linus Torvalds in the United States and other countries.
Java® is a registered trademark of Oracle and/or its affiliates.
XFS® is a trademark of Silicon Graphics International Corp. or its subsidiaries in the United States and/or other countries.
MySQL® is a registered trademark of MySQL AB in the United States, the European Union and other countries.
Node.js® is an official trademark of the OpenJS Foundation.
The OpenStack® Word Mark and OpenStack logo are either registered trademarks/service marks or trademarks/service marks of the OpenStack Foundation, in the United States and other countries and are used with the OpenStack Foundation’s permission. We are not affiliated with, endorsed or sponsored by the OpenStack Foundation, or the OpenStack community.
All other trademarks are the property of their respective owners.