Chapter 6. Reviewing monitoring dashboards
OpenShift Container Platform 4.8 provides a comprehensive set of monitoring dashboards that help you understand the state of cluster components and user-defined workloads.
In the Administrator perspective you can access dashboards for core OpenShift Container Platform components, including:
- API performance
- etcd
- Kubernetes compute resources
- Kubernetes network resources
- Prometheus
- USE method dashboards relating to cluster and node performance
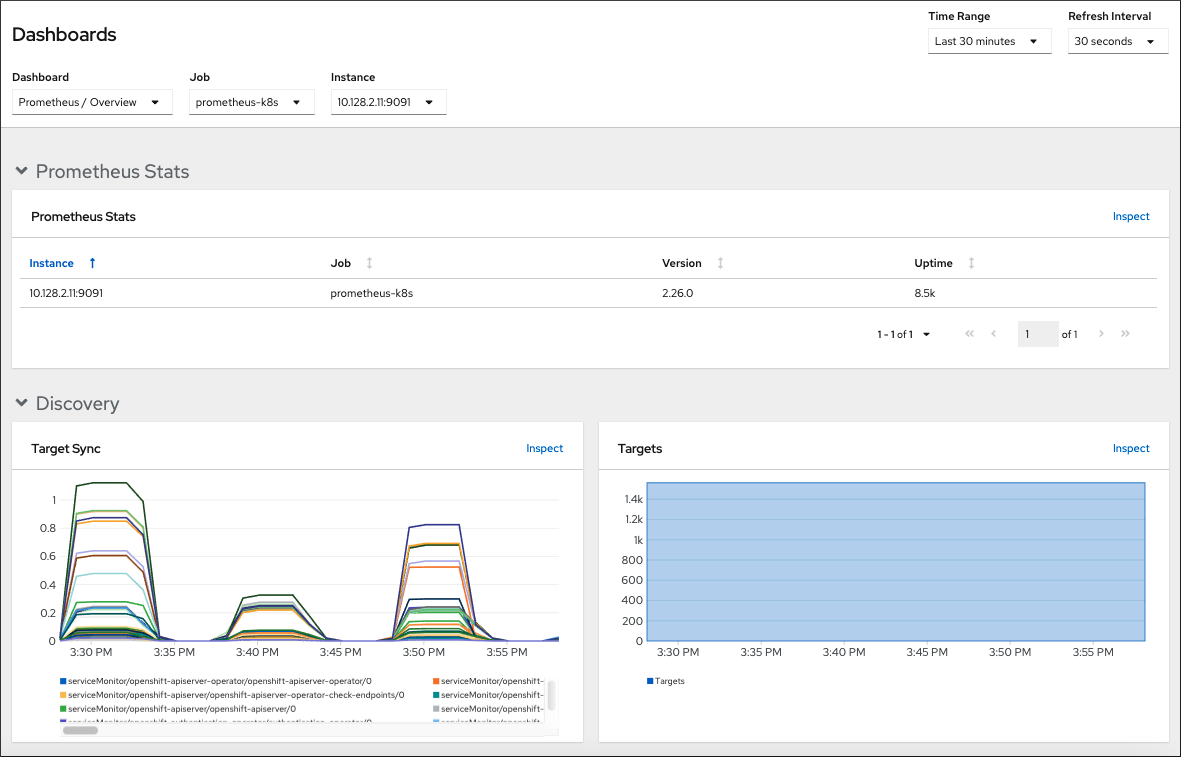
Figure 6.1. Example dashboard in the Administrator perspective
In the Developer perspective you can access dashboards that provide the following statistics for a selected project:
- CPU usage
- Memory usage
- Bandwidth information
- Packet rate information
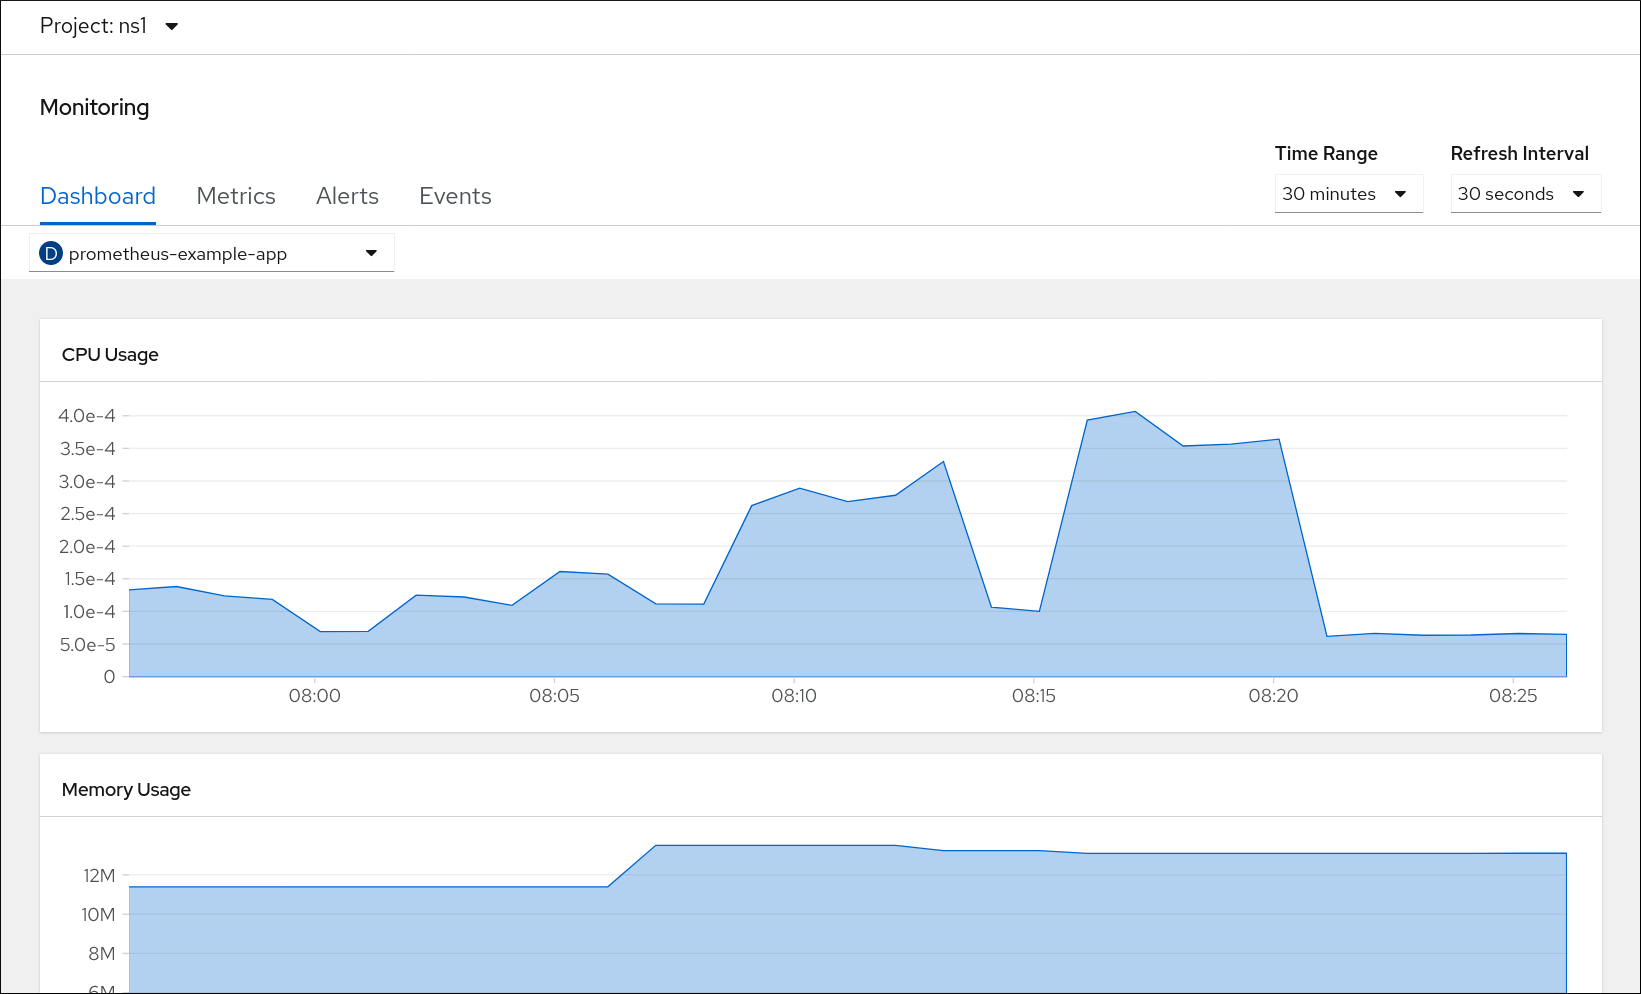
Figure 6.2. Example dashboard in the Developer perspective
In the Developer perspective, you can view dashboards for only one project at a time.
6.1. Reviewing monitoring dashboards as a cluster administrator
In the Administrator perspective, you can view dashboards relating to core OpenShift Container Platform cluster components.
Prerequisites
-
You have access to the cluster as a user with the
cluster-adminrole.
Procedure
-
In the Administrator perspective in the OpenShift Container Platform web console, navigate to Monitoring
Dashboards. - Choose a dashboard in the Dashboard list. Some dashboards, such as etcd and Prometheus dashboards, produce additional sub-menus when selected.
Optional: Select a time range for the graphs in the Time Range list.
- Select a pre-defined time period.
Set a custom time range by selecting Custom time range in the Time Range list.
- Input or select the From and To dates and times.
- Click Save to save the custom time range.
- Optional: Select a Refresh Interval.
- Hover over each of the graphs within a dashboard to display detailed information about specific items.
6.2. Reviewing monitoring dashboards as a developer
In the Developer perspective, you can view dashboards relating to a selected project. You must have access to monitor a project to view dashboard information for it.
Prerequisites
- You have access to the cluster as a developer or as a user with view permissions for the project that you are viewing the dashboard for.
Procedure
-
In the Developer perspective in the OpenShift Container Platform web console, navigate to Monitoring
Dashboard. - Choose a project in the Project: list.
- Choose a workload in the All Workloads list.
Optional: Select a time range for the graphs in the Time Range list.
- Select a pre-defined time period.
Set a custom time range by selecting Custom time range in the Time Range list.
- Input or select the From and To dates and times.
- Click Save to save the custom time range.
- Optional: Select a Refresh Interval.
- Hover over each of the graphs within a dashboard to display detailed information about specific items.